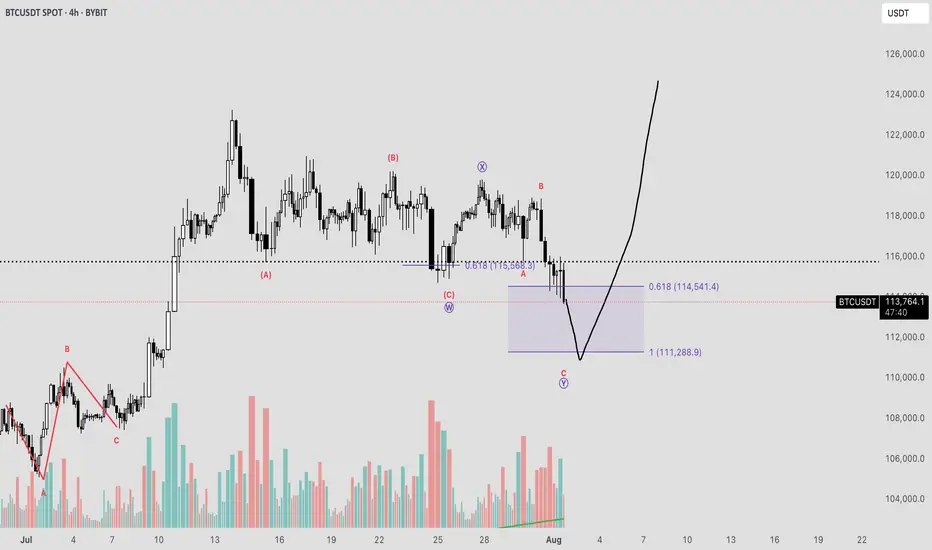
BTC Double Combo CorrectionFollowing a failure to maintain support at several critical technical levels, Bitcoin now appears vulnerable to a potential decline toward the ~$111,000 region. This projection is derived from an Elliott Wave corrective structure identified as a WXY Double Combination. The initial leg of the pattern features an ABC correction terminating near the 0.618 Fibonacci extension, thereby establishing the W pivot. This is succeeded by the X pivot, followed by a sharp, impulsive decline forming the Y wave.
By applying a trend-based Fibonacci extension across the W, X, and Y pivots, we can estimate the probable termination point of the corrective sequence—typically extending into the 1.0 to 1.1 Fibonacci range.
This move is anticipated to unfold over the weekend, potentially presenting a strategic buying opportunity, contingent on a favorable reaction at the projected low. Sunday evening may offer optimal conditions for entry, as traditional market participants—limited to weekday trading—could miss the initial dip, subsequently being compelled to re-enter at elevated price levels.
Community ideas
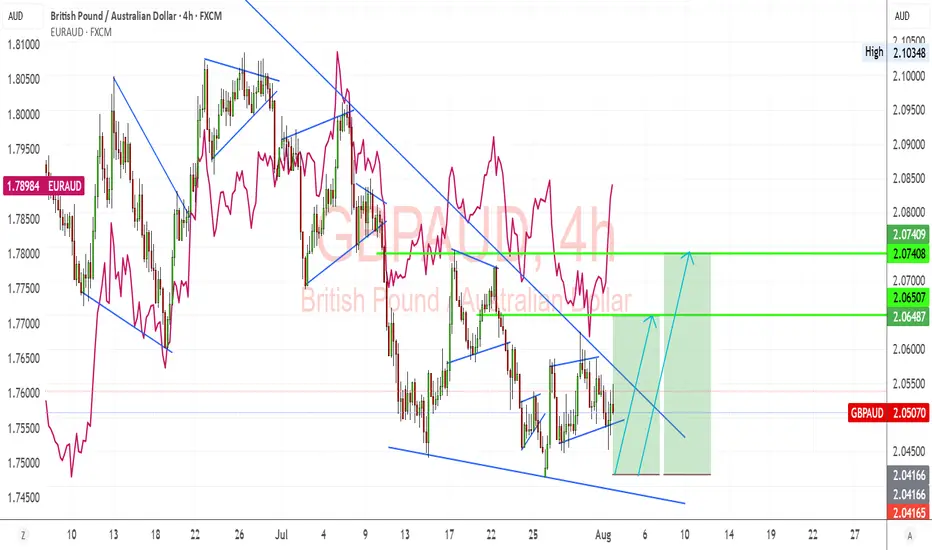
GBPAUD Potential Bullish Reversal Setup – Key Breakout Levels GBPAUD is showing signs of a potential bullish reversal after a prolonged downtrend, with price consolidating within a descending wedge pattern. The pair is testing a breakout point, and fundamentals favor a bullish recovery supported by GBP strength relative to AUD weakness.
Technical Analysis (4H Chart)
Pattern: Descending wedge formation, often a bullish reversal structure.
Current Level: 2.0507, holding within the wedge and preparing for a potential breakout.
Key Support Levels:
2.0416 – immediate support and invalidation zone if broken.
2.0350 – extended support if bearish pressure resumes.
Resistance Levels:
2.0650 – near-term breakout level.
2.0740 – secondary bullish target if breakout confirms.
Projection: If the wedge breaks upward, price could rally toward 2.0650 initially, then 2.0740 for further confirmation of bullish momentum.
Fundamental Analysis
Bias: Bullish if breakout confirms.
Key Fundamentals:
GBP: BOE remains cautious but leans toward maintaining tight policy amid sticky inflation.
AUD: RBA is constrained by weaker growth and trade risks linked to global tariffs, limiting AUD upside.
Global Sentiment: Risk-off sentiment weighs on AUD, favoring GBP relative strength.
Risks:
Hawkish RBA surprise or strong China data could strengthen AUD.
BOE dovish signals may cap GBP upside.
Key Events:
BOE policy updates and UK inflation data.
RBA meeting and Chinese economic releases.
Leader/Lagger Dynamics
GBP/AUD is a lagger, often following EUR/AUD and GBP/USD movements, but it could gain momentum if GBP strength broadens against risk-sensitive currencies.
Summary: Bias and Watchpoints
GBP/AUD is setting up for a bullish reversal, with key breakout confirmation above 2.0650. A move toward 2.0740 would reinforce this scenario. The main watchpoints are BOE policy tone, RBA updates, and China’s economic signals.
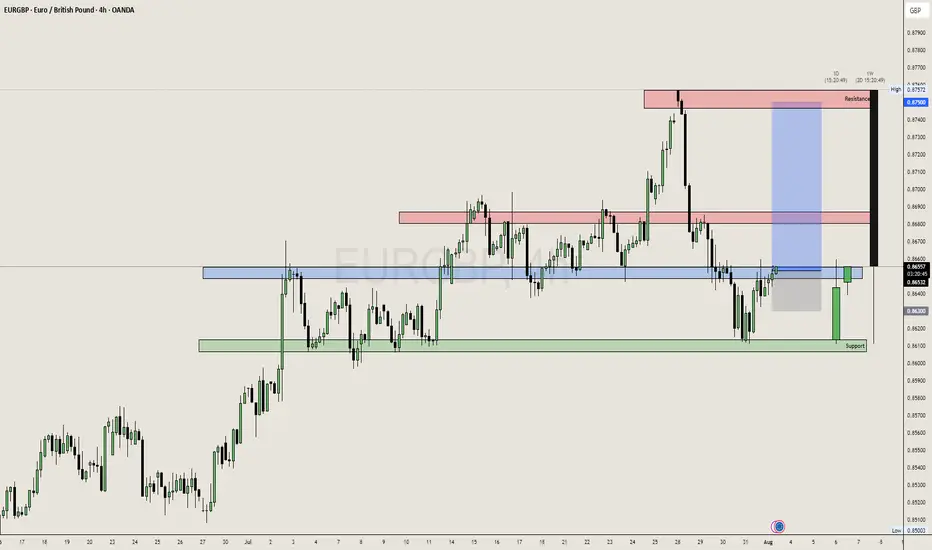
EURGBP, Bullish Breakout!!!EURGBP after getting rejected from the support we can expect again a upside movement.
I am expecting a movement from 0.86500 to 0.8700 at least, we can plan sl below 0.86300.
Safe Player wait for proper breakout and wait for retest of 0.8650 area.
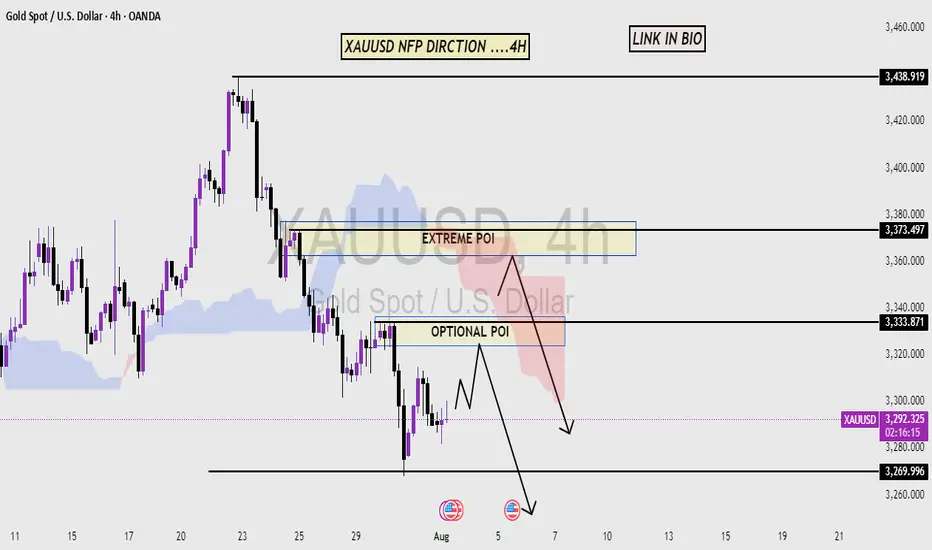
XAU/USD GOLD NFP DIRECTIONThis chart analysis is for XAU/USD (Gold vs. U.S. Dollar) on the 4-hour timeframe. The focus is on a bearish market structure, highlighting potential Price of Interest (POI) zones for a short (sell) setup.
Key Elements:
Market Structure: Clear downtrend with lower highs and lower lows.
POIs Identified:
Optional POI: An initial supply zone where price might react.
Extreme POI: A more significant supply zone marked for a stronger potential reversal.
Labels & Notes:
The price levels are marked between 3,320 – 3,340, showing where the reversal is expected.
Interpretation:
The chart anticipates a retracement upward into the POIs before continuing the bearish move. Traders may look to enter short positions around these zones, especially the Extreme POI, which is seen as a high-probability reversal area.
Bitcoin is at KEY zone - time for LONGBitcoin is at KEY zone - time for LONG
price hit key zone
if we furtunite - pric will go up to take range high

The idea of shorting on rallies below 3315 remains unchanged.Gold remains generally weak, with multiple rebounds showing signs of fatigue. The upward moving average continues to suppress prices, indicating that the bearish trend remains intact, and the short-term market outlook remains bearish. Trading strategies remain bearish today, with a key focus on the 3300-3315 area, a key short-term resistance zone. If the market rebounds before the US market opens and approaches this area, or if a clear topping signal appears near this range, consider entering a short position. Today will see the release of the non-farm payroll data, which may influence the market's trajectory. We recommend prioritizing short-term trading before the release, and reconsidering the market's direction based on market feedback after the release. Structurally, gold continues to exhibit a volatile downward trend, with lower highs and lower lows. Today's low is expected to be lower than yesterday's. Short-term short positions are focused on 3285-3280, with a break below this level potentially allowing for further declines. Please carefully time your entry, strictly implement risk management, and avoid emotional trading.
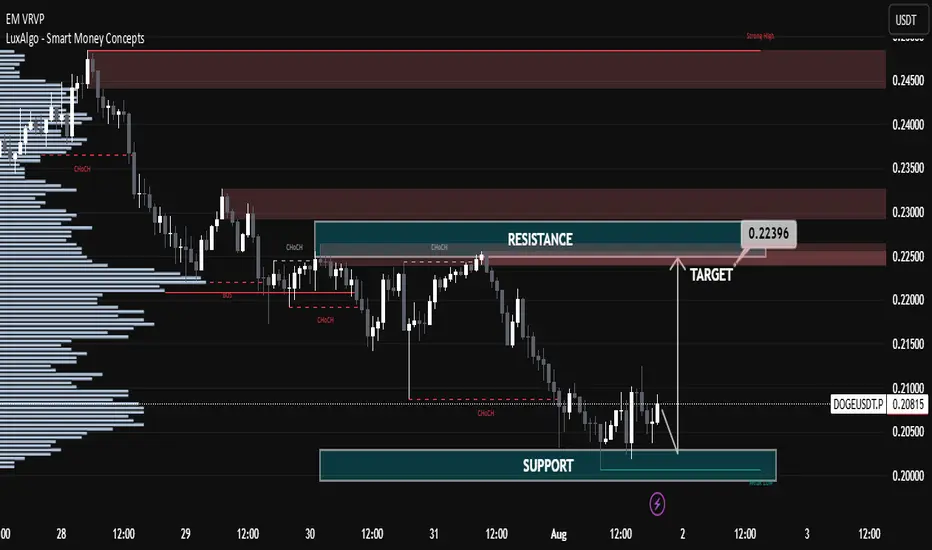
DOGEUSDT Technical Analysis – Bullish Reversal Anticipated DOGEUSDT Technical Analysis – Bullish Reversal Anticipated
🔍 Key Technical Zones:
Support Zone: $0.1990 – $0.2015
Strong bullish reactions noted from this level in previous attempts.
Confluence with volume accumulation on the left (as seen in the Volume Profile).
Signifies a strong demand zone where buyers are stepping in.
Resistance Zone / Target: $0.2220 – $0.2240
Previous structural high and supply zone.
Marked as the first major liquidity area.
Also aligns with imbalance and CHoCH (Change of Character), a common SMC concept.
🔄 Market Structure:
CHoCH (Change of Character) marked multiple times, indicating attempts by bulls to reclaim structure.
Recent price action shows accumulation near support.
Sideways consolidation suggests potential for a bullish breakout.
Liquidity sweep of recent lows could indicate that smart money is accumulating positions before a move higher.
🎯 Trade Setup Idea:
Entry Area: Between $0.2000 – $0.2060 (inside the support zone)
Target: $0.22396 (as marked)
Stop Loss: Below $0.1980 (below the visible support range)
🔧 Indicators and Tools Used:
Volume Profile (VRVP): Shows most volume traded around $0.205 – $0.207, indicating strong positioning from market participants.
Smart Money Concepts (SMC): CHoCH and liquidity concepts signal potential accumulation and reversal.
Price Action Analysis: Clean swing structure with support-resistance rotation visible.
📌 Conclusion:
DOGEUSDT is currently trading in a range-bound structure with a bullish bias from the support zone. If the price sustains above $0.205 and breaks above minor resistance, the upside target of $0.22396 is likely. This setup is supported by strong volume accumulation and smart money structure shifts.
Bitcoin: New All-Time High — What’s Next?Bitcoin had an incredible run, breaking the old all-time high ($111,980) with strong bullish momentum and setting a fresh ATH at $123,218 (Binance). We just witnessed the first major corrective move of ~6% and a decent bounce so far — but the big question is:
What’s next? Will Bitcoin break higher over the summer or form a trading range here?
Let’s dive into the technicals.
🧩 Higher Timeframe Structure
May–June Range:
BTC was stuck between $110K–$100K, forming an ABC corrective pattern. Using trend-based Fib extension (TBFE) from A–B–C:
✅ C wave completed at $98,922 (1.0 TBFE)
✅ Upside target hit at $122,137 (-1 TBFE)
Full Bull Market TBFE:
➡️ 1.0 → $107,301 → previously rejected
➡️ 1.272 → $123,158 → recent rejection zone
Pitchfork (log scale):
➡️ Tapped the upper resistance edge before rejecting.
Previous Bear Market Fib Extension:
➡️ 2.0 extension at $122,524 hit.
2018–2022 Cycle TBFE:
➡️ 1.618 at $122,011 tapped.
Macro Fibonacci Channel:
➡️ Connecting 2018 low ($3,782), 2021 ATH ($69K), 2022 low ($15,476) →
1.618–1.666 resistance band: $121K–$123.5K.
✅ Conclusion: Multiple fib confluences mark the $122K–$123K zone as critical resistance.
Daily Timeframe
➡️ FVG / Imbalance:
Big daily Fair Value Gap between the prior ATH and $115,222 swing low.
BTC broke the prior ATH (pATH) without retest → a pullback to this zone is likely.
Lower Timeframe / Short-Term Outlook
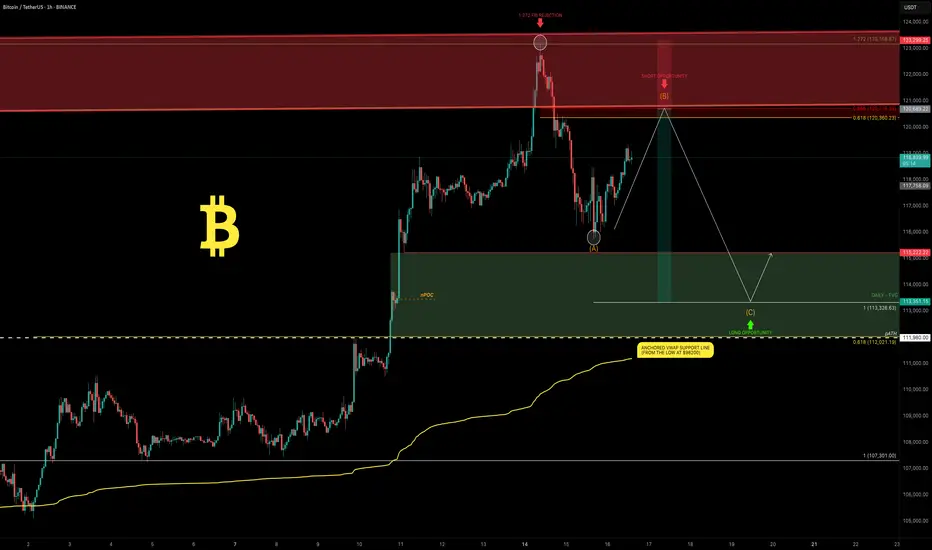
We likely saw a completed 5-wave impulse up → now correcting.
The -6% move was probably wave A, current bounce = wave B, next leg = wave C.
➡ Wave B short zone: $120K–$121K
➡ Wave C target (1.0 TBFE projection): ~$113,326
➡ Confluence at mid-FVG + nPOC
Trade Setups
🔴 Short Setup:
Entry: $120,300–$121,000
Stop: Above current ATH (~$123,300)
Target: $113,500
R:R ≈ 1:2.3
🟢 Long Setup:
Entry: Between Prior ATH and $113,000
Stop: Below anchored VWAP (~$110,500)
Target: Higher, depending on bounce confirmation.
🧠 Educational Insight: Why Fibs Matter at Market Extremes
When markets push into new all-time highs, most classic support/resistance levels disappear — there’s simply no historical price action to lean on. That’s where Fibonacci extensions, channels, and projections become powerful tools.
Here’s why:
➡ Fibonacci extensions (like the 1.272, 1.618, 2.0) help estimate where trend exhaustion or profit-taking zones may appear. They are based on the psychology of crowd behavior, as traders anchor expectations to proportional moves from previous swings.
➡ Trend-Based Fib Extensions (TBFE) project potential reversal or continuation zones using not just price levels, but also the symmetry of prior wave moves.
➡ Fibonacci channels align trend angles across multiple market cycles, giving macro context — like how the 2018 low, 2021 ATH, and 2022 low project the current 1.618–1.666 resistance zone.
In short:
When you don’t have left-hand price history, you lean on right-hand geometry.
That’s why the $122K–123K zone wasn’t just random — it’s a convergence of multiple fib levels, cycle projections, and technical structures across timeframes.
⚡ Final Thoughts
Bitcoin faces major resistance around $122K–$123K backed by multiple fib and structural levels. A retest of the prior ATH zone (~$112K–$113K) looks probable before the next big directional move. Watch lower timeframe structure for signs of completion in this corrective phase.
_________________________________
💬 If you found this helpful, drop a like and comment!
Want breakdowns of other charts? Leave your requests below.
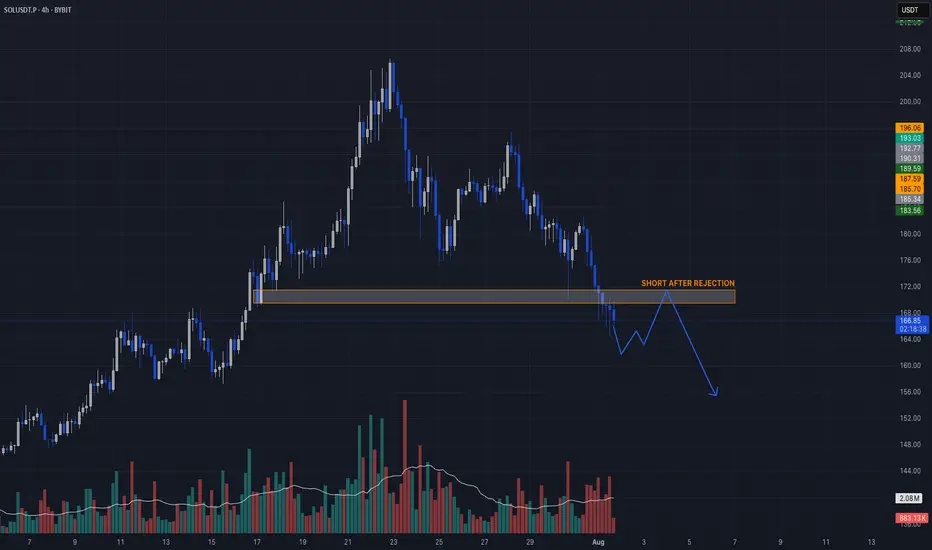
Momentum Continuation after Structural BreakdownHey Candle Fam,
We’re eyeing a clean short setup on SOL after structure broke down and buyers failed to hold key levels. Time to fade the bounce and let the market do the work.
🔥 SOLUSDT.P TRADE IDEA 🔥
Bias: Short
Strategy: Momentum Continuation after Structural Breakdown
Entry: 169.50 – 171.80
Stop Loss: 174.60
Take Profits:
▫️ TP1: 165.10
▫️ TP2: 161.30
▫️ TP3: 158.00 (extension target)
⸻
📊 Rationale:
– HTF structure: Sharp retracement from $215 top, lower highs forming
– LTF structure: Breakdown confirmed, no bullish CHoCH present
– Liquidity targeting: Clean sweep zones below $165 and $160
– Order flow: Sell-side delta dominance, funding positive = longs could unwind
– Volume profile: Imbalance between $172–175 now acting as rejection zone
🎯 Idea: Look for a minor pullback to $170–172, then ride downside liquidity flush. Protect profits fast if market spikes unexpectedly.
⸻
🧠 Stay sharp. Trade smart. Let the market come to us.
Candle Craft | Signal. Structure. Execution.
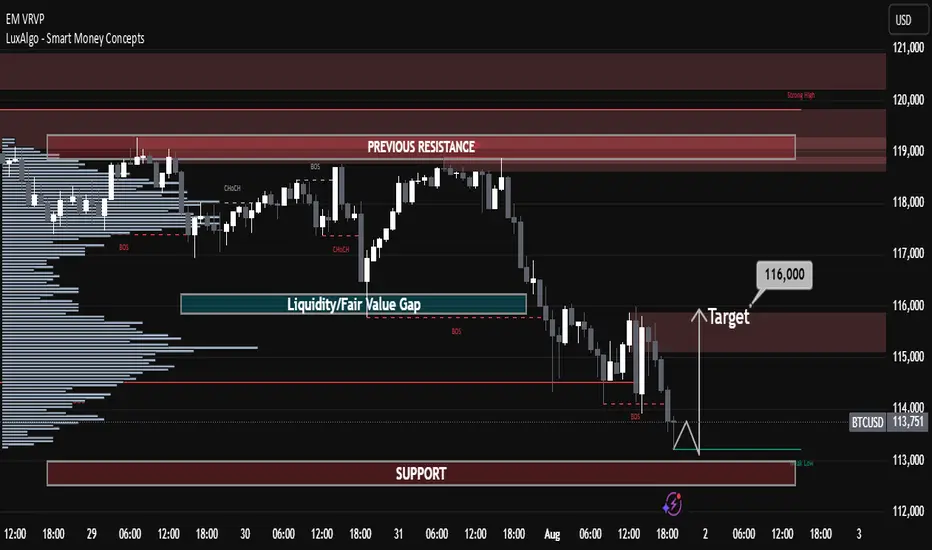
BTCUSD Technical Analysis (Smart Money Concepts) BTCUSD Technical Analysis (Smart Money Concepts)
Market Structure Overview:
Break of Structure (BOS) observed multiple times confirms a strong bearish trend.
Change of Character (CHoCH) around 30th July indicated initial shift from bullish to bearish intent.
Price has been forming lower highs and lower lows, respecting the bearish structure.
Key Zones:
🔴 Previous Resistance Zone (119,000 - 120,500)
Strong supply area from where price sharply reversed.
Also aligned with a Strong High marked at ~$120,000 – key for any future bullish invalidation.
🟫 Current Target Zone – 116,000
Acts as an immediate imbalance fill/FVG retracement zone.
Target highlighted as potential retracement point before continuing lower.
🟦 Liquidity / Fair Value Gap (FVG) Zone
Located between ~115,800 and 114,500.
Price may aim to revisit this zone on pullback, filling inefficiencies.
🟩 Support Zone (~113,000)
Price currently reacting near this zone.
This area has acted as a demand zone in the past and is expected to provide short-term support.
Volume Profile & Order Flow:
Visible Range Volume Profile shows heavy activity near the resistance cluster, indicating strong distribution by institutional players.
Low volume in the FVG area further confirms inefficiency and potential for a retracement move.
Smart Money Perspective:
The current structure reflects distribution at highs, followed by markdown phase.
Price swept liquidity below local lows and may now seek to mitigate previous supply or FVG around 116,000 before resuming bearish trend.
📌 Conclusion:
Bias: Bearish until 116K is tested and rejected.
Next Move Expectation: Possible liquidity sweep → bounce to 116K → short continuation.
Invalidation Level: Break and close above 117K would signal strength returning.
✅ Educational Note:
This is a classic Smart Money trap setup — liquidity grab near lows, fakeout pump to FVG, and potential short continuation. Traders should be cautious of fake rallies into known supply zones.
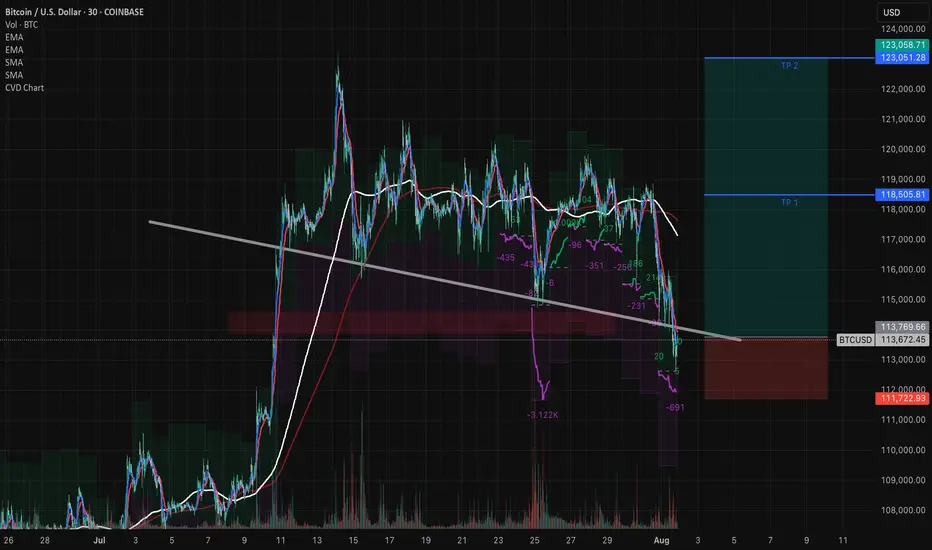
WAIT FOR A TRIPLE CONFIRMATION AND CAPITALIZE ON THE TARIFFS
Analysis and Prediction by DunnInvesting
Market Overview
The BTCUSD chart on a 1-hour timeframe shows a recent consolidation phase following a sharp decline. Key technical indicators suggest a potential reversal or continuation pattern. The price is approaching a critical support zone around $113,792.86, with a descending trendline acting as resistance.
Thought Process
Support Zone Identification: The $113,792.86 level aligns with a historical support zone and the 50-period EMA, indicating a strong area for potential buying interest.
Trendline Resistance: The descending trendline has capped recent upward movements. A break above this level could signal a bullish reversal.
Triple Confirmation: Wait for three confirmations:
A bullish candlestick pattern (e.g., engulfing candle) at the support zone.
A break above the trendline with increased volume.
A retest of the trendline as new support.
This setup offers a clear entry point with defined risk below the support zone, making it understandable and actionable.
Trade Plan
Entry: $114,500 after triple confirmation.
Take Profit 1 (TP1): $118,505 (4.5% gain).
Take Profit 2 (TP2): $123,051 (7.5% gain).
Stop Loss: $112,000 (below support, ~2.2% risk).
Risk-Reward Ratio: 1:2.04 (TP1) and 1:3.41 (TP2).
Profit Targets and Stop Loss
TP1 at $118,505 targets a conservative 4.5% move.
TP2 at $123,051 aims for a more ambitious 7.5% upside.
Stop loss at $112,000 protects against a breakdown below support.
Clarifying Notes
This idea leverages the current market uncertainty around tariffs, which could drive volatility and create trading opportunities. Monitor volume and news closely for validation.
Disclaimer
This is not financial advice. Trading involves risk, and you should only trade with capital you can afford to lose. Consult a financial advisor before making any trading decisions.
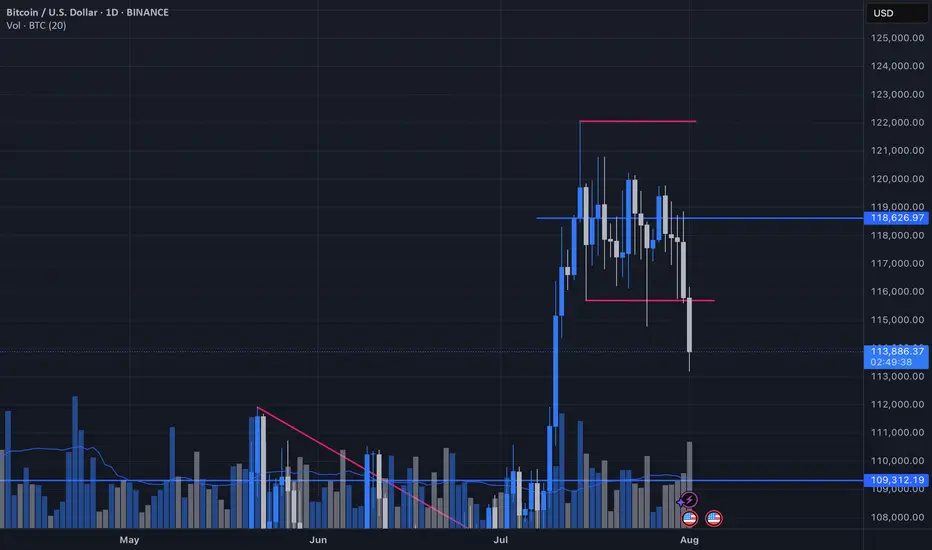
Bitcoin Range Broken?Most likely this range is broken and everybody is right, we chop around/head down... However the daily has not closed so I wonder, what would you do if three hours from now this closes above the $115,700 area?
XAUUSD ANNASIS OUTLOOK BULLISH 1/8/2025 XAUUSD – Trade in Progress
Long from $3,295 – targetting $3,355 / $3,365
+600+ pips potential on extended breakout
Bulls gaining strength above $3,300
Holding with confidence – structure supports it
#XAUUSD #GoldTrade #LiveSetup #TargetPending

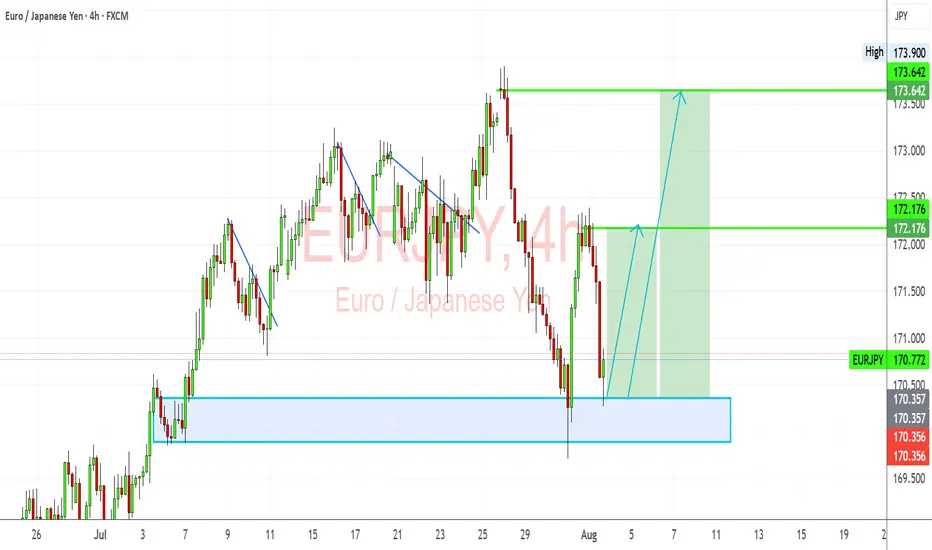
EURJPY: Bullish Rebound from Key Demand ZoneEURJPY has bounced off a critical demand zone and is showing signs of a bullish recovery. Despite the recent pullback, the pair’s structure remains fundamentally and technically bullish, driven by JPY weakness and EUR resilience.
Technical Analysis (4H Chart)
Pattern: Price tested a strong demand zone near 170.35–170.50 and rejected it aggressively.
Current Level: 170.77, starting a potential bullish leg toward higher resistance levels.
Key Support Levels:
170.35 – key demand zone and invalidation level for bulls.
169.90 – deeper support if demand zone breaks.
Resistance Levels:
172.17 – first bullish target and interim resistance.
173.64 – major target if bullish continuation sustains.
Projection: A successful rebound from 170.35 could drive price toward 172.17 initially, then 173.64 if momentum holds.
Fundamental Analysis
Bias: Bullish.
Key Fundamentals:
EUR: ECB’s slower path toward easing supports EUR stability relative to JPY.
JPY: Weakness persists as BoJ maintains dovish bias, though FX intervention risk limits JPY downside speed.
Global Sentiment: Mild risk-on mood supports EUR strength against JPY.
Risks:
BoJ verbal intervention or actual FX intervention could trigger temporary JPY strength.
Sharp reversal in global risk sentiment could weaken EUR/JPY.
Key Events:
ECB speeches and data (CPI, growth updates).
BoJ FX comments and broader market risk appetite.
Leader/Lagger Dynamics
EUR/JPY is a leader among JPY pairs, often moving in sync with GBP/JPY and CHF/JPY. Its movement also tends to precede confirmation in risk-sensitive JPY crosses.
Summary: Bias and Watchpoints
EUR/JPY is bullish from the 170.35 demand zone, with a potential move toward 172.17 and 173.64. Key watchpoints include ECB communication, BoJ stance, and market risk sentiment. As long as 170.35 holds, bulls remain in control.
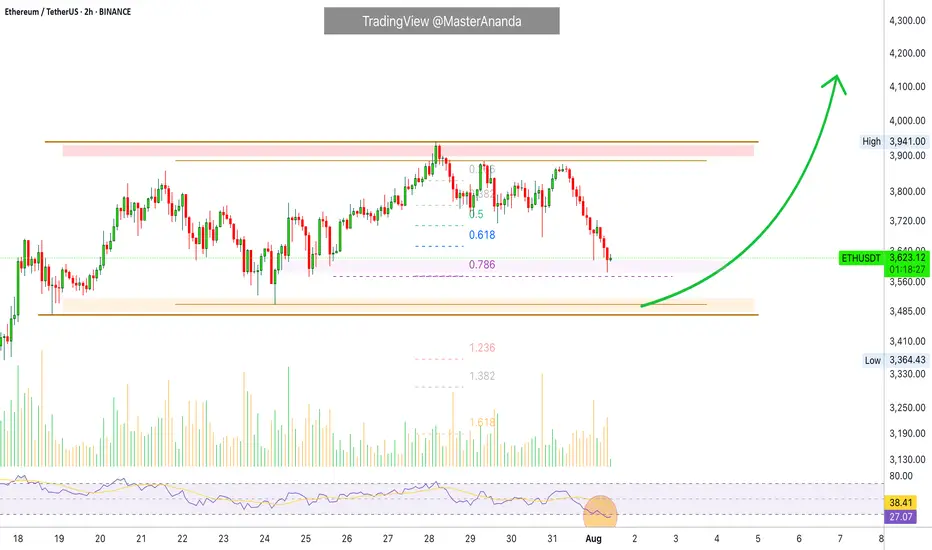
Ethereum Short-Term · Trading within Bullish RangeI am looking at Ethereum short-term using the same timeframe I used for Bitcoin, 2h. We have some interesting signals.
Here ETHUSDT is trading within higher lows. This is interesting because Bitcoin produced a lower low recently. The same volume signal is present here, ETHUSDT has been producing lower bearish volume since last month.
The RSI produced a lower low while ETHUSDT produced a higher low. This is called a hidden bullish divergence. Ethereum's bears did not only fail to take out the last low 24-July but also the previous one, and this clearly reveals bullish support.
The RSI being oversold is also a positive condition and can signal a reversal happening soon. Not truly a reversal because we are not in a downtrend, we are still witnessing a small pause after a strong rise; consolidation near resistance. A continuation reads better.
Ethereum's price continues really strong and the short-term signals are pointing to bullish action being favored in the coming days. We can wait easily and patiently because the best is yet to come. Never SHORT in a bull market, the market will surprise you with how fast things can turn. Better wait for support and go LONG.
Namaste.
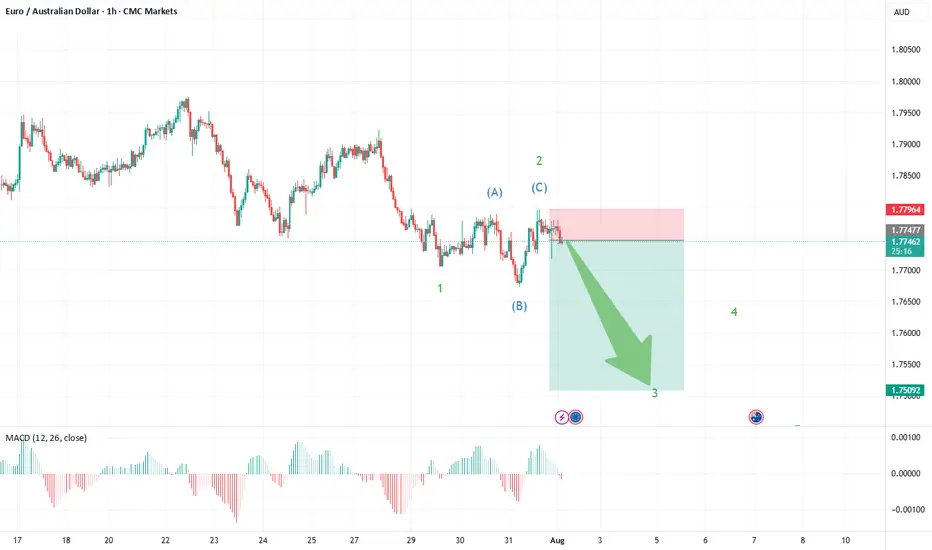
EUR/AUD: Short Setup Forming—Is the Downside Just Beginning?EUR/AUD is flashing the early signs of a new short trading opportunity, with the latest chart pointing toward a fresh move lower as the corrective phase may be wrapping up.
What the Current Structure Shows (Primary Scenario)
Corrective Pattern Complete: The strong advance off the May 14th, 2025 lows at 1.7247 unfolded as a classic double zigzag (WXY), culminating at recent highs. Price action has since reversed and formed an initial impulse down—clear evidence that the correction may be over.
Wave 1 Down, Expanded Flat for Wave 2: The chart now displays a completed wave 1 on the downside, followed by an expanded flat for wave 2—where price retraced upward but failed to break the previous peak, a sign of fading bullish momentum.
The recent structure shows a sharp, impulsive move down (wave 1), fitting Elliott Wave expectations for a new trend immediately after a complex correction.
The expanded flat for wave 2—where the B wave exceeded the start of A and C pushed higher—typically heralds a strong, extended wave 3. This supports a bearish outlook from current levels.
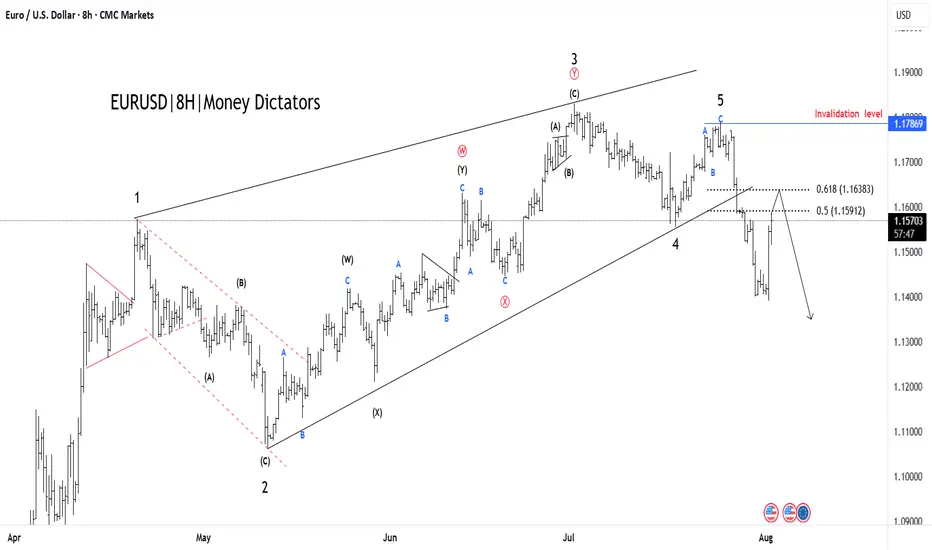
EUR/USD Elliott Wave Count Signals Downside TargetsThe EUR/USD chart is displaying a completed 5-wave Elliott impulse structure, suggesting the potential start of a larger corrective move to the downside. Wave 5 appears to have finished after a classic ending diagonal pattern, with price now breaking below the wave 4 support trendline — a strong confirmation of trend exhaustion.
Currently, price is retracing upward towards the 0.5–0.618 Fibonacci retracement zone of the last impulsive leg, around 1.15912–1.16383, which may serve as the final rejection zone for bears to re-enter. This area aligns perfectly with prior support-turned-resistance and is considered the potential reversal pocket.
If price holds below the 1.17869 invalidation level, the structure supports the beginning of an ABC correction or a larger bearish impulse.
Target 1 (T1): 1.14800
Target 2 (T2): 1.13915
Stop Loss (SL): 1.17869
This scenario remains valid as long as the price does not break above 1.17869. A clean break and close above this level would invalidate the bearish setup and suggest a possible wave extension.
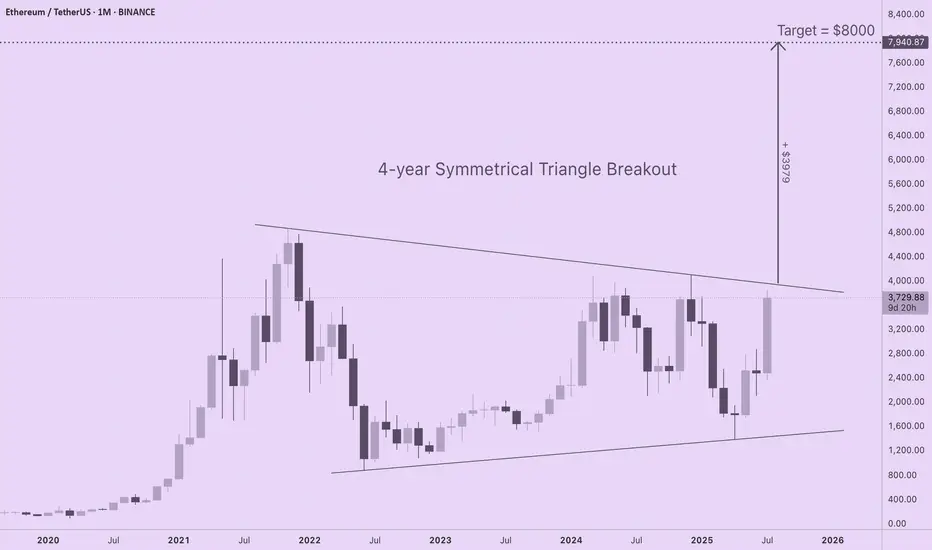
ETH Targets $8000 with 4-Year Symmetrical Triangle BreakoutIf you are seeking realistic ETH price targets based upon solid long-term market structure, check out this 4-year symmetrical triangle forming on the ETH/USD monthly chart. ETH is coiling for a major move to $8000, yet none of the CT "influencers" I follow are talking about this. I am new to technical analysis, so I am interested in learning your thoughts about this pattern and which tools or indicators you prefer for setting price discovery targets.
For those of you new to technical analysis, symmetrical triangle patterns can form on long timeframes (weeks, months, or years), indicating indecision between bulls and bears as price compresses within a continually narrowing range. A breakout from a symmetrical triangle typically follows the direction that preceded their formation, and the longer the consolidation period, the stronger the move.
The chart shows a strong euphoric phase in 2021 followed by a bear market low. Subsequent failure to reach previous ATHs is balanced by a pattern of higher lows. Since ETH was in an uptrend prior to triangle formation, odds are this is a continuation pattern, especially given profound shifts in capital flows and sentiment for the asset over the last several weeks.
With trendlines set at the price extremes, the height of the triangle is roughly $3980. If a breakout occurs at a price of $3960, ETH will target a price of $7940 (height of triangle + breakout price). A more conservative price target of $7000 is obtained by resetting the trendlines at the monthly opening and closing prices (omitting the wicks).
Regardless of the specific method for drawing the triangle, ETH is primed for a major move to the upside that has been four years in the making.
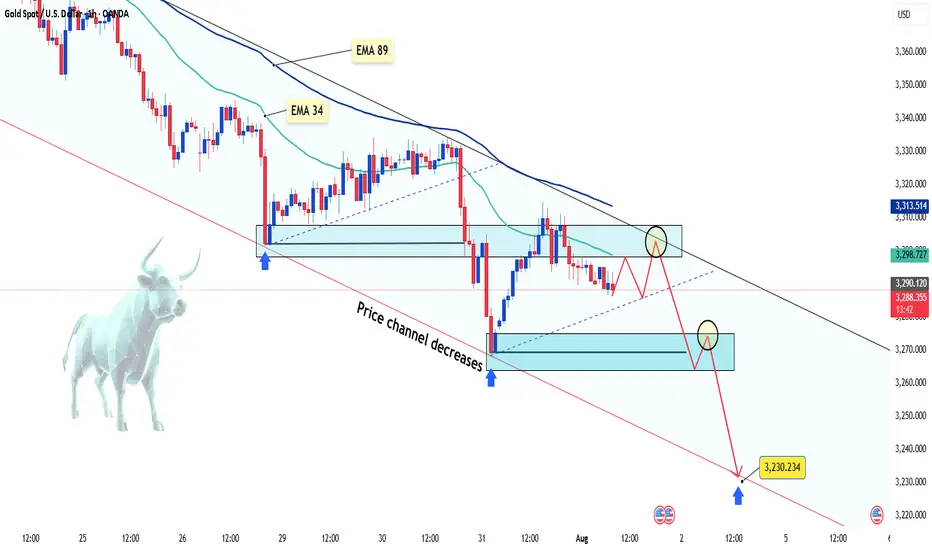
Gold keeps falling – is there more to come?Hello everyone, great to see you again!
Today, gold remains under pressure following a series of strong U.S. economic data releases, which have reinforced expectations that the Federal Reserve will keep interest rates elevated for longer. As a result, the U.S. dollar has strengthened, Treasury yields have climbed, and gold has lost its footing.
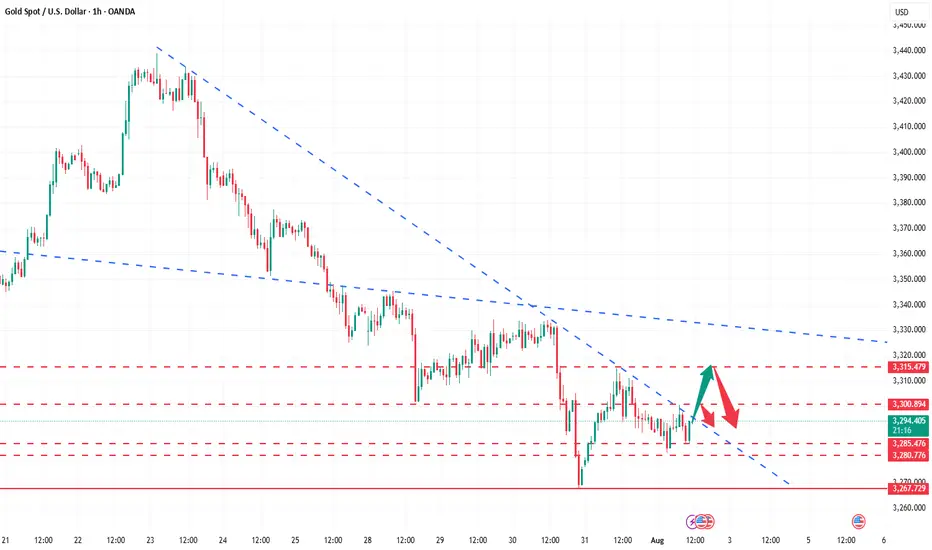
On the H1 chart, XAUUSD is clearly trading within a descending price channel. Both the EMA 34 and EMA 89 are acting as dynamic resistance zones. Recent attempts to rally have consistently failed at these levels, mirroring the bearish setup seen before July 29.
Currently, price is retesting a minor resistance area. If this retest fails, the next downside targets lie near 3,270 – and potentially down to 3,230 USD, which aligns with the lower boundary of the price channel.
From my perspective, the bearish momentum is likely to continue.
What about you? How do you think gold will close the day?
BTCUSD 8/1/2025Come Tap into the mind of SnipeGoat as he gives you a Full Top-Down Analysis of Bitcoins Price Action as we come into the month of August. What is Price doing? Where is Price going? Come get the answer here!
_SnipeGoat_
_TheeCandleReadingGURU_
#PriceAction #MarketStructure #TechnicalAnalysis #Bearish #Bullish #Bitcoin #Crypto #BTCUSD #Forex #NakedChartReader #ZEROindicators #PreciseLevels #ProperTiming #PerfectDirection #ScalpingTrader #IntradayTrader #DayTrader #SwingTrader #PositionalTrader #HighLevelTrader #MambaMentality #GodMode #UltraInstinct #TheeBibleStrategy

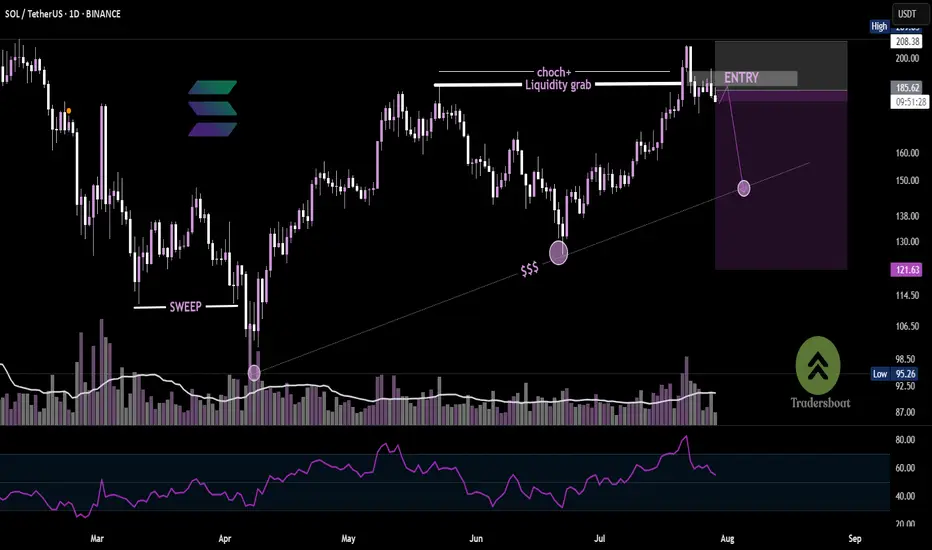
SOLUSDT-1D Liquidity Grab + CHoCH = Short Setup on SOL? SOL on the daily chart shows signs of a potential trend reversal:
🔻 Liquidity grab above previous highs
🔄 CHoCH (Change of Character) confirmed
📥 Entry zone tapped, price showing early signs of rejection
📉 If supply holds, eyes on the $120 zone as next target
🔍 RSI rolling over from highs = weakness incoming?
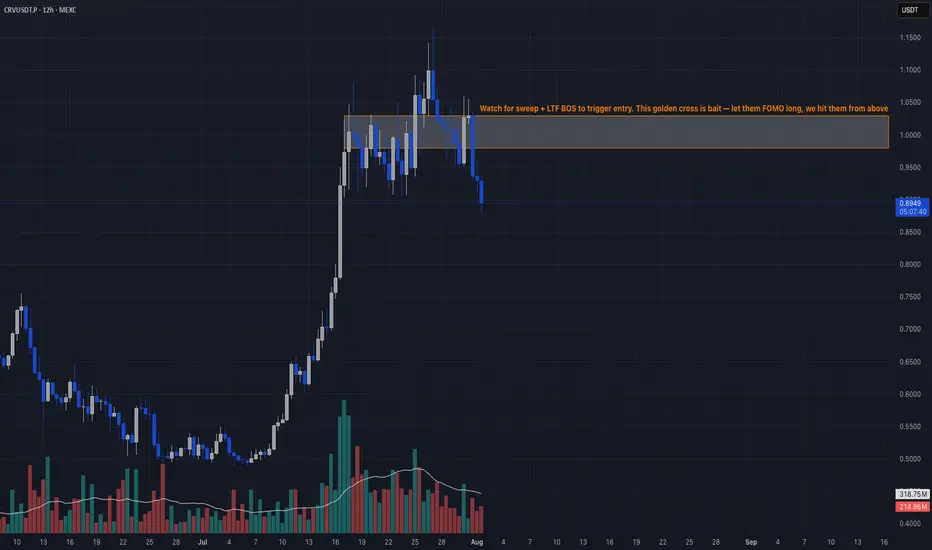
Retail Trap at Resistance📣 Team, get this…
CRV printed 5 green candles, triggered a golden cross, and suddenly every YouTube thumbnail said “TO THE MOON.” 🌝 That’s exactly the kind of retail trap we love to fade. This ain’t DeFi summer, it’s just overheated spaghetti. 🍝
🔥 TRADE SETUP
Bias: Short
Strategy: Retail Trap at Resistance
Entry: $0.98 – $1.03
SL: $1.10
TPs: $0.78, $0.65, $0.50
Why?
– RSI 83 + MACD maxed out = overcooked
– LTF CHoCH after sweeping $1.03
– Positive funding across exchanges → ripe for short squeeze reversal
– Retail buying golden cross = premium exit liquidity
Candle Craft | Signal. Structure. Execution.
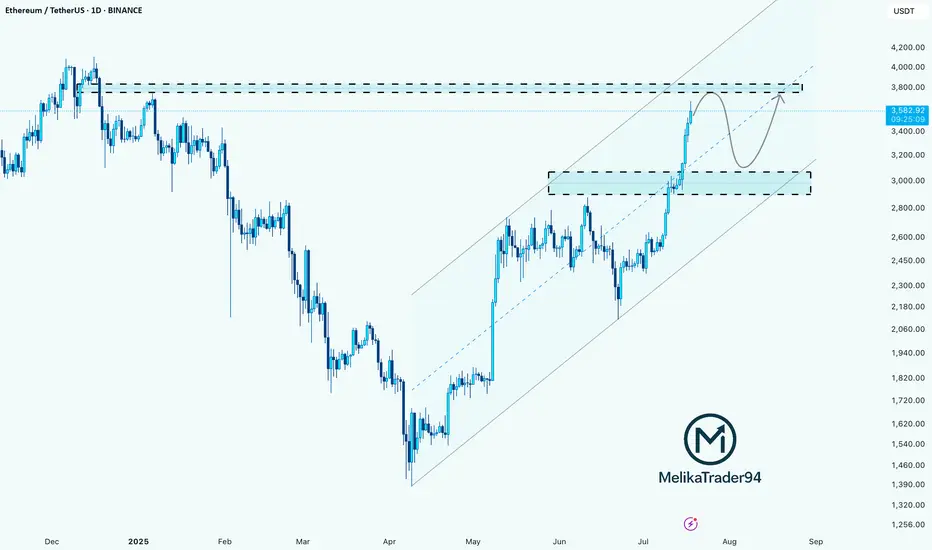
ETH Approaching Major Resistance – Expecting Pullback Hello guys!
Ethereum has been rallying strongly within a well-respected ascending channel, pushing past key levels and now approaching a major resistance zone around $3,900–$4,000.
According to the chart structure, it looks like price could soon react from this resistance, leading to a pullback into the $3,000–$3,200 demand zone, which aligns with the midline of the channel.
This would be a healthy correction before potentially continuing the bullish trend and attempting a clean breakout toward new highs.
ETH is still bullish, but it may need to retest support before continuation.
Watch for a bounce from the $3,000–$3,200 zone for a high-probability long opportunity.