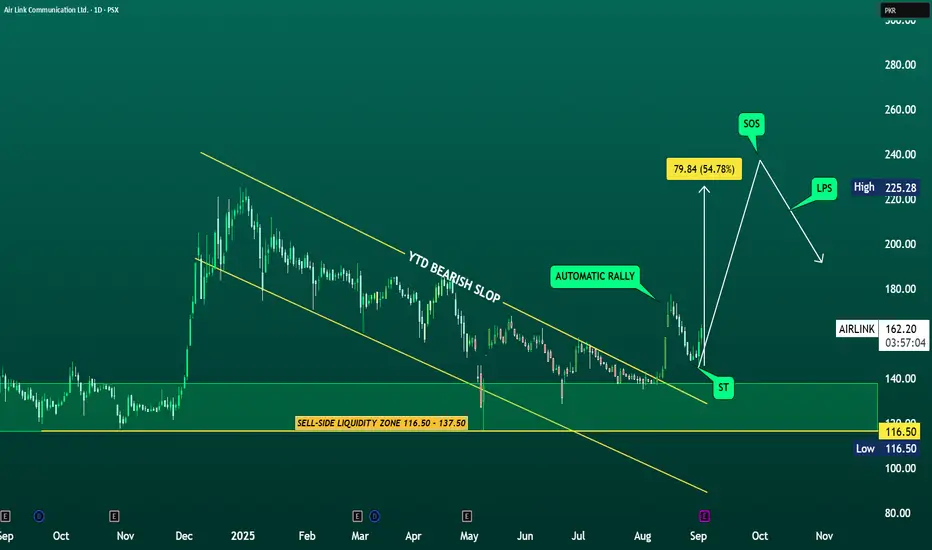
Airlink: Wyckoff Automatic Rally in Play!#Airlink has started to show the classic signs of a Wyckoff Automatic Rally (AR) after months of persistent decline. The stock found strong demand inside the sell-side liquidity zone of 116.5–137.5, which acted as a potential Selling Climax (SC) where weak hands exited and stronger players absorbed supply. From there, the sharp bounce towards 161+ marked the Automatic Rally, signaling that supply had been absorbed and demand was strong enough to push prices higher.
The Secondary Test (ST) has already been completed within the same liquidity zone, confirming demand absorption and strengthening the accumulation structure. With ST out of the way, the stock now eyes a potential Sign of Strength (SOS), which could emerge on a breakout above 180–185.
If successful, the next upside target lies around 225 (previous high), while 200 could act as a Last Point of Support (LPS) on a retest. On the downside, a break below 116.5 would invalidate the accumulation setup and reintroduce markdown risk. Overall, #Airlink appears positioned in the early accumulation-to-markup stage of Wyckoff with a strong upside bias if the trading range holds.
#Disclaimer: This analysis is for educational purposes only and not financial advice. Trading stocks involves risk; past performance does not guarantee future results. Please do your own research before investing.
Pakistan
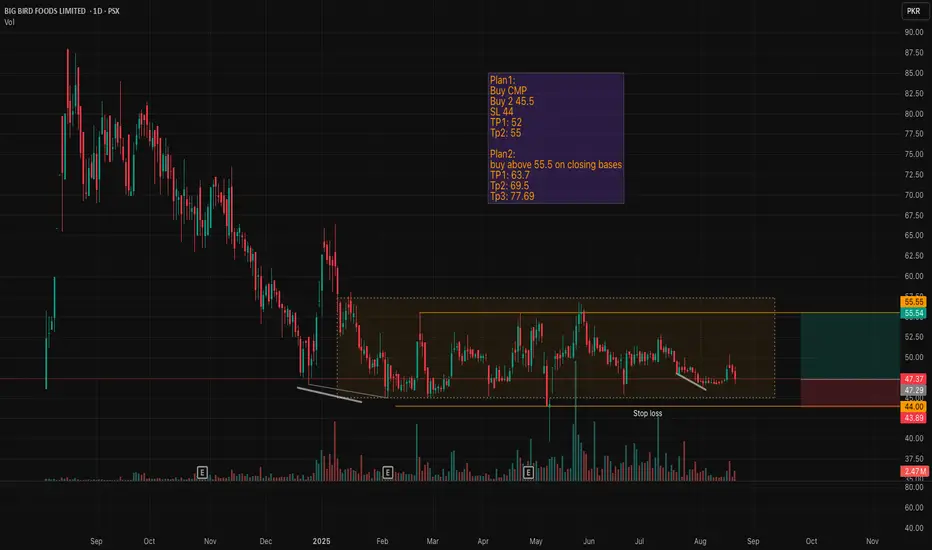
BBFL – Big Bird Foods Limited: Range Breakout SetupBBFL has been moving sideways for months, locked inside a consolidation box 🟧. Price is holding well above the key support zone and building energy for the next decisive move. A breakout above the range could open the door to strong upside momentum.
🔑 Key Levels:
CMP: 47.37
Support / Stop-loss: 44 🛡️
Range Resistance: 55.5 🚧
📌 Trading Plans:
Plan 1 (Aggressive):
Buy @CMP or on dips to 45.5
SL: 44 ❌
TP1: 52 🎯
TP2: 55 🎯
Plan 2 (Conservative):
Buy only above 55.5 on closing basis ✅
TP1: 63.7 🎯
TP2: 69.5 🎯
TP3: 77.7 🚀
⚡ BBFL is at a make-or-break zone. Holding above support keeps bulls in control, while a breakout above 55.5 could trigger the next rally.
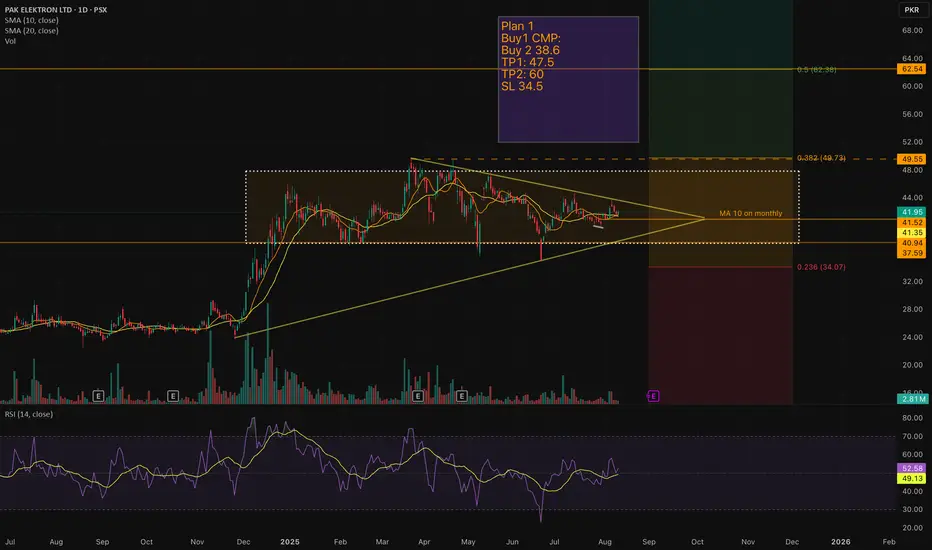
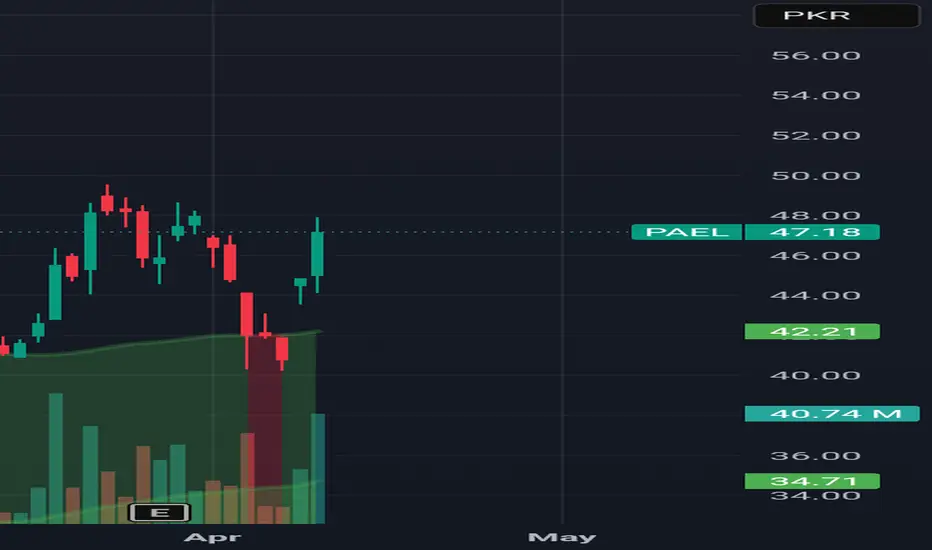
PAEL – Symmetrical Triangle Breakout Loading?PAK Elektron Ltd (PSX: PAEL) has been consolidating for months inside a symmetrical triangle, with price hugging the 10 & 20 SMA zone. The breakout could be just around the corner.
📊 Technical Outlook:
Pattern: Symmetrical triangle within a larger consolidation box.
Current CMP: 41.95
MA10 on monthly: Acting as dynamic resistance.
Volume: Noticeable spikes during upswings, showing accumulation.
RSI: Neutral zone at 52 – plenty of room for momentum in either direction.
📝 Trading Plan:
Buy 1: CMP (41.95)
Buy 2: 38.6 (on dip if retest happens)
TP1: 47.5 (near 0.382 Fib level)
TP2: 60 (major Fib retracement level 0.5)
SL: 34.5
⚡ Why Interesting?
Price has been coiling, reducing volatility – a breakout can trigger strong moves.
Weekly & Monthly structure shows alignment for a potential uptrend continuation.
Above 49.5, momentum could accelerate toward 62+.
🔍 Watch Levels:
42.50 breakout confirmation zone
38.50 retest support
49.5 major resistance
Disclaimer: This is not financial advice – just my personal trade setup based on technical analysis. Always do your own research before entering any trade.
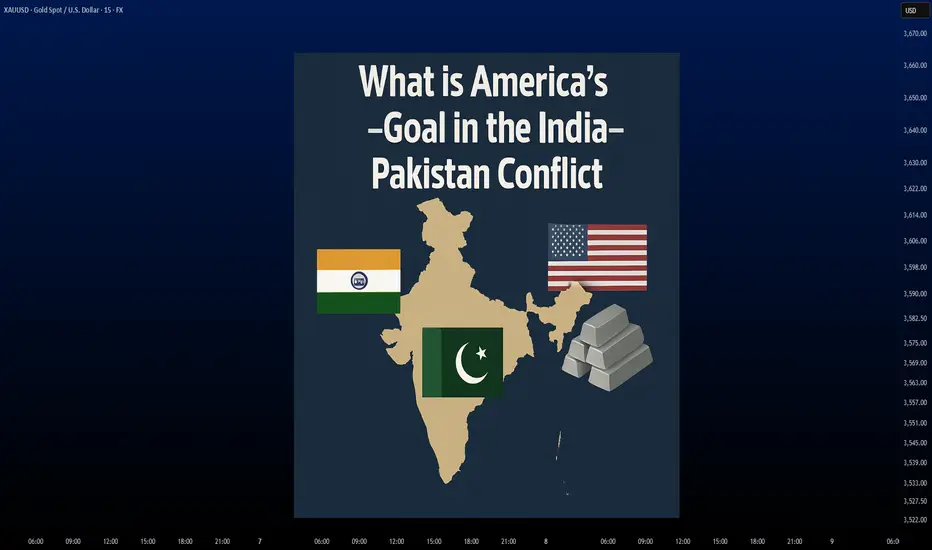
What’s America's Real Goal in a Possible India–Pakistan War?We are nearing the end of the petro-dollar era. The power balance of the new world order will be defined not by oil, but by the strategic resources essential for AI, electric vehicles, and cutting-edge technology.
Throughout the 20th century, the U.S. maintained its global dominance by controlling access to oil. From the Middle East to Latin America and Africa, wherever oil was found, the U.S. was there.
But today, the focus has shifted to rare earth elements, lithium, copper, and other strategic minerals.
Trump’s 2025 move to buy Greenland wasn’t a diplomatic joke—it was a signal. Behind-the-scenes deals in Ukraine for rare earth deposits tell the same story: whoever controls these "white gold" assets will lead the tech-driven world.
Now enters Pakistan, with mineral-rich lands spanning over 600,000 km², nearly three times the size of the UK. Experts estimate its underground reserves to be worth $8 trillion.
In Balochistan's Rekodik field alone, there are 12 million tons of copper and 20 million ounces of gold, with a copper purity of 0.53%, well above global standards. In the north, newly discovered lithium reserves could be a game-changer for the EV revolution.
This is no longer just about resources—this is about deciding the future balance of global power.
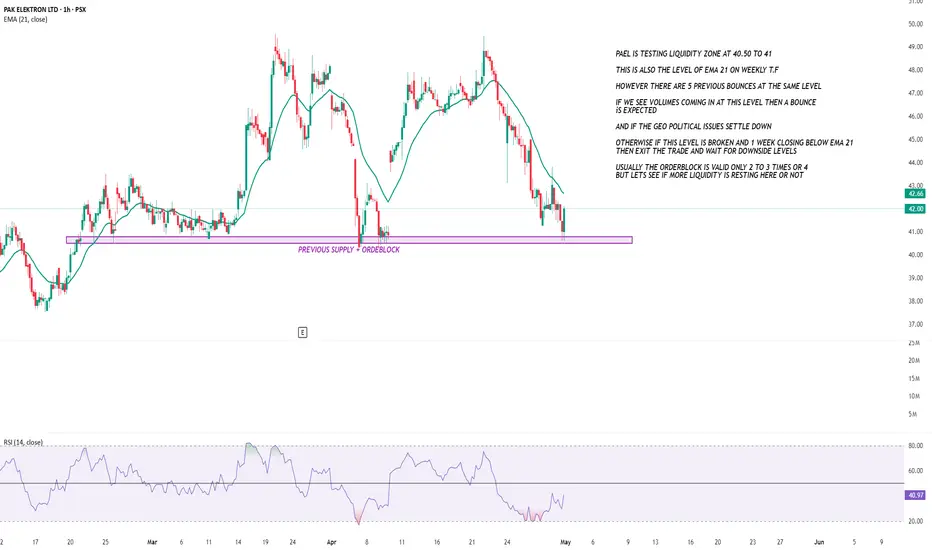
PAEL SETUP ONCE AGAINPAEL is currently at its orderblock zone where the liquidity is resting if volumes come in at this level then we can expect a bounce again if the orderblock fails and there is no liquidity in OB then wait for downside levels and if the weekly ema 21 is broken then i see 30 level coming but still we will look into some more levels for now just focus on this orderblock
the previous supply is completed here
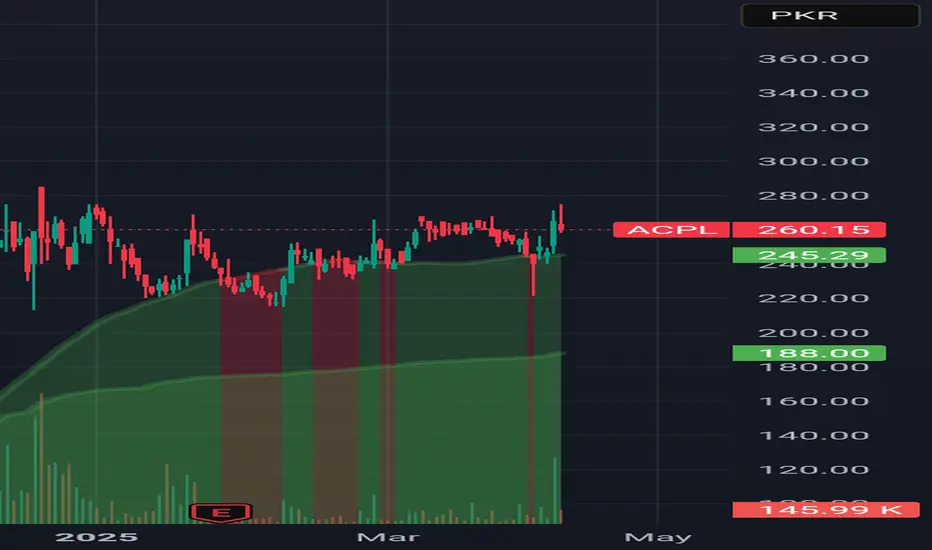
#ACPL is above green sky (strong bullish zone)#Acpl is now above green sky (Strong bullish zone). It is expected to cross 280 and 320 level.
Note: This is not a buy or sell call, trade at your own will. Use stop loss as per your strategy.
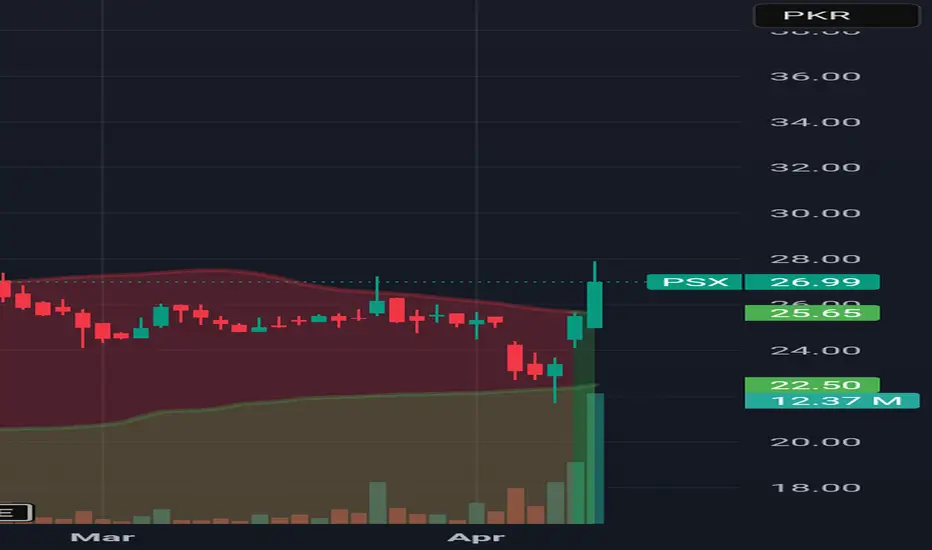
Psx (stock) is above green sky (strong bullish zone)Psx is now above green sky (Strong bullish zone). It is expected to cross 30 and 40 level.
Note: This is not a buy or sell call, trade at your own will. Use stop loss as per your strategy.
#Pael is above green sky (strong bullish zone)Hcar is now above green sky (Strong bullish zone). It is expected to cross 50 and 60 level.
Note: This is not a buy or sell call, trade at your own will. Use stop loss as per your strategy.
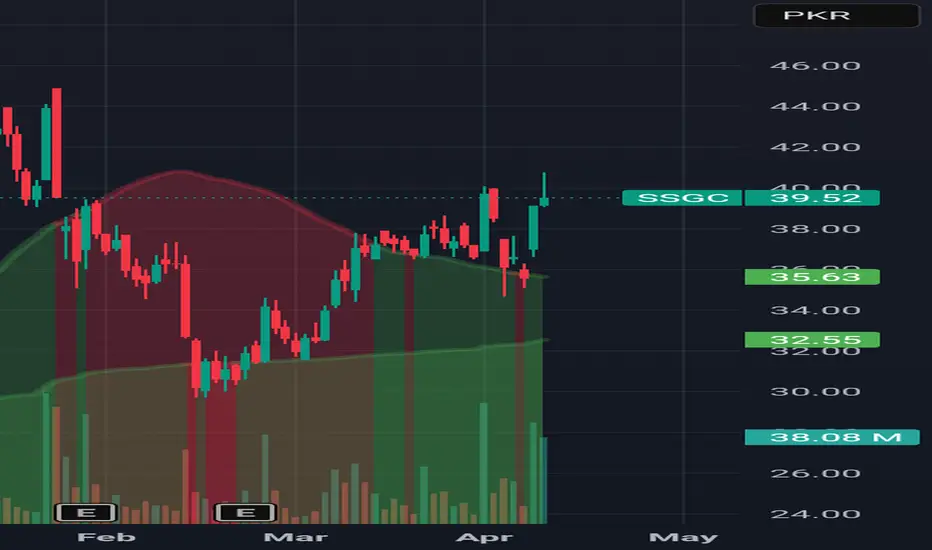
#Ssgc is above green sky (strong bullish zone)#Ssgc is now above green sky (Strong bullish zone). It is expected to cross 45 and 60 level.
Note: This is not a buy or sell call, trade at your own will. Use stop loss as per your strategy.
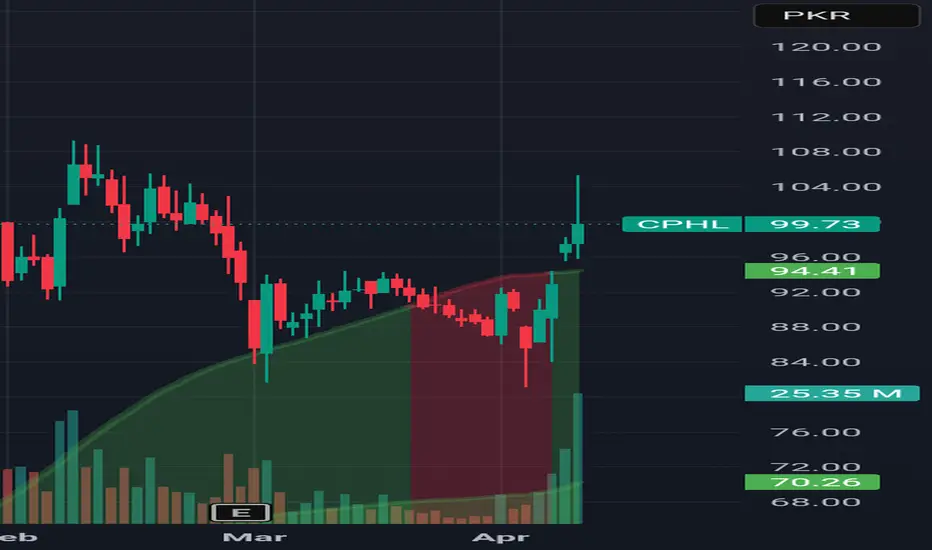
#CPHL is above green sky (strong bullish zone )#CPHL is now above green sky (Strong bullish zone). It is expected to cross 110 and 130 level.
Note: This is not a buy or sell call, trade at your own will. Use stop loss as per your strategy.
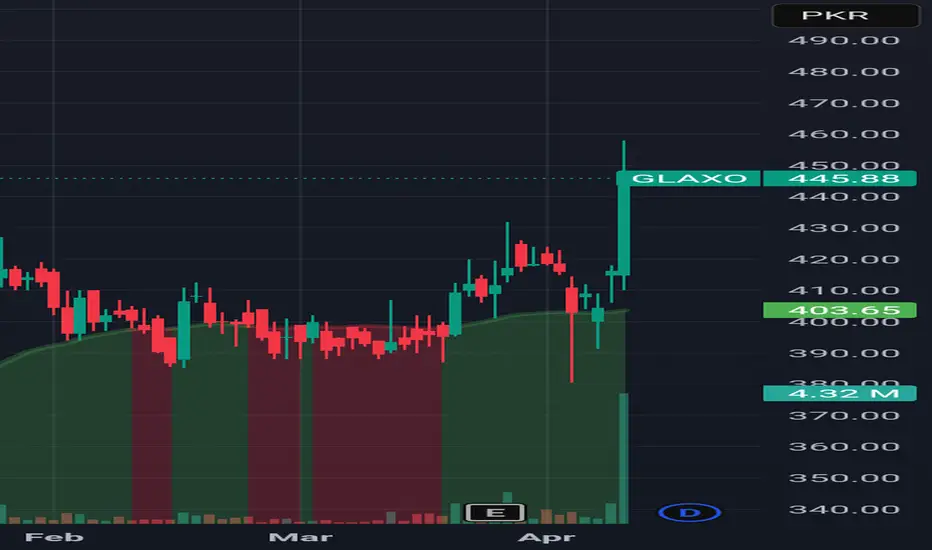
Glaxo is above green sky (strong bullish zone)Glaxo is now above green sky (Strong bullish zone). It is expected to cross 500 and 600 level.
Note: This is not a buy or sell call, trade at your own will. Use stop loss as per your strategy.
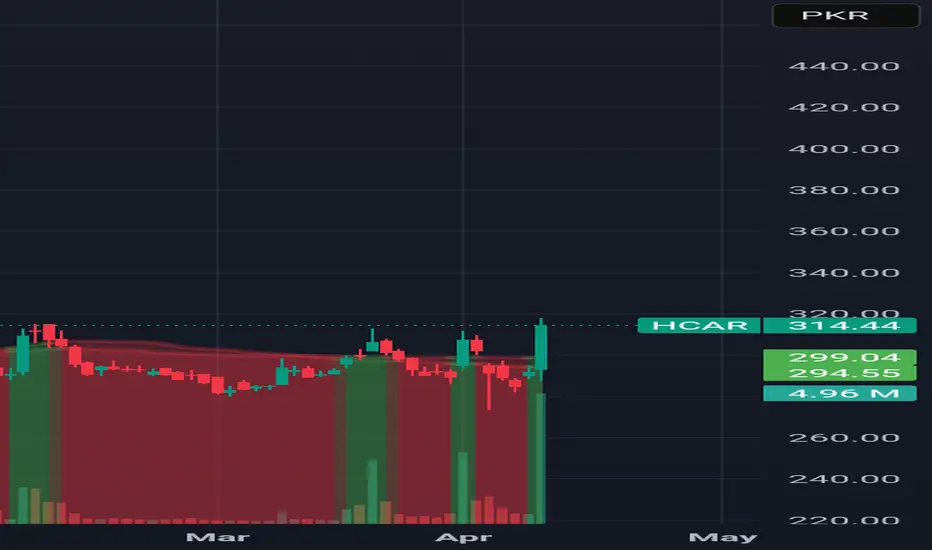
Hcar is above green clouds (Strong bullish zone)Hcar is now above green sky (Strong bullish zone). It is expected to cross 350 and 400 level.
Note: This is not a buy or sell call, trade at your own will. Use stop loss as per your strategy.
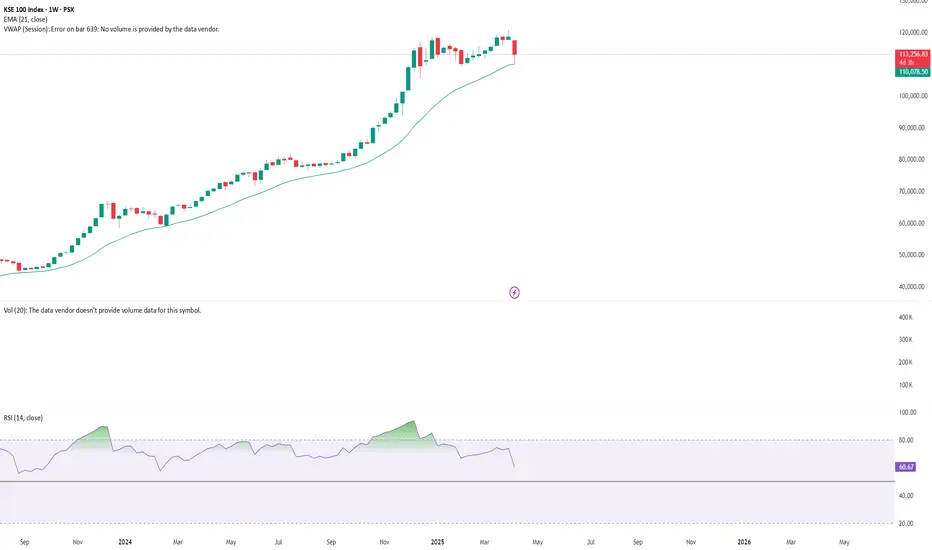
KSE 100 BULLISH OR BEARISH?KSE 100 is also bleeding as the global markets sell off. But the key indicator right now is to look at EMA 21 at weekly time frame on all big stocks and index. if we see a good bounce from ema 21 we might see volumes coming in big stocks. enjoy the show being played globally!
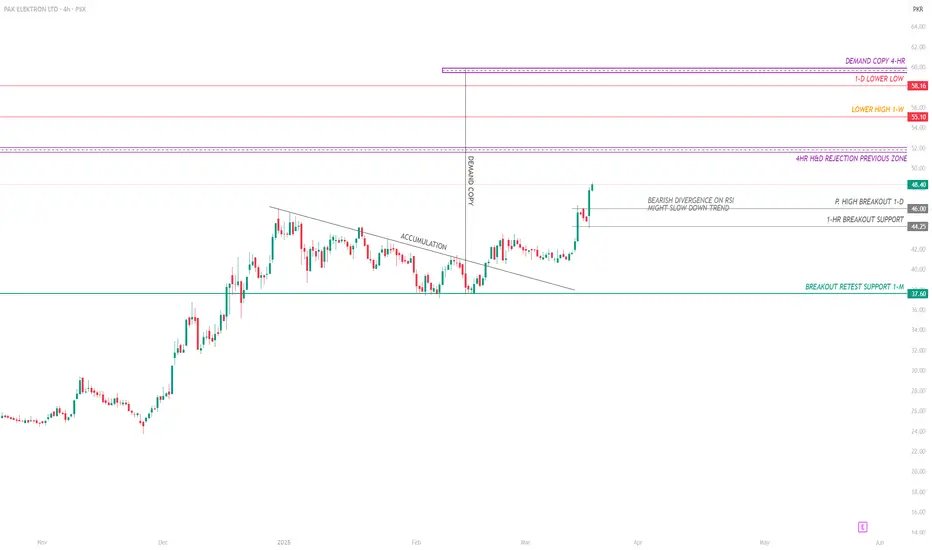
PAEL - THE BEST SETUPPAEL has always been my favorite stock as it plays very well on price action and technical.
Right now the trending accumulation has ended and its time for a move.
if we take the simple and basic previous demand copy. It gives the target of 60 which everyone is expecting. but there might be some trick played to take out the retails. so be careful around 55 and 59 level you might see the trend slowdown in short term due to divergence on RSI.
right now if you want to accumulate more wait for the intraday retest levels around 46 to 44.
I HAVE ALREADY ENTERED THIS SETUP AROUND 43.
THE TAKE PROFIT IS 55 AND THEN 58 TO 59 ACCORDINGLY.
MLCF WEEKLY TIME FRAME AND TRADE IDEAMLCF GAVE A BREAKOUT AT THE ACCUMULATION BOX. THE STOCK IS HEADING TO WEEKLY STRONG RESISTANCE AT 50.92
BUT EXPECTED TO BREAKOUT DUE TO THE SENTIMENT AND THE DESECENDING ACCUMULATION JUST BEFORE THE WEEKLY BREAKOUT LOOKS LIKE A CONFIRMATION. LOOKS LIKE THAT
THE BIG PLAYERS HAVE FILLED UP THIER BAGS AND READY FOR THE BREAKOUT
HOWEVER THIS MIGHT BE PLAYED NEXT WEEK OR IN THESE NEXT FEW DAYS
WATCH FOR PRICE ACTION ON H2 AND H4
BREAKOUT AT 50.92 will start a new quick rally however a retest might be possible at the breakout level at 50.92 to 5. The next target will be 58 to 59.
watch for order flows in orderbook. and look for the 5m timeframe above vwap session near breakout

23 FEB 2025, KSE - 100 A simple yet clear viewThe volumes are low as compared to last year. As the big money stopped flowing into stocks for a moment the retail traders and the aggressive players are also waiting for a clear signal in the market.
The KSE 100 is very confusing right now. The simplest and most clear view is that the market is sideways and consolidating as we saw last year in these months.
Whoever is trying to analyze the KSE 100 and thinking that he can figure it out or all the youtubers, they don't know anything about technical.
Right now none can predict anything on the index.
The best thing is to stop watching the index until it closes above mentioned levels and focus on stocks only right now.

PSX FFL TRADE IDEA LOOKING STRONG ON H2 AND H4FFL IS LOOKING STRONGON H2 AND H4. The stock retest its equal low where all of the big liquidity was resting at 14.50 Now the stock is heading to the next h2 resistance the breakout at H2 resistance with good volume will start a quick uptrend. Watch for volumes and orderbook.
The next target will be the previous lower low around 16.
Trading above EMA 21 at H2 AND H4.
VOLUME GAINER.
Buy before breakout if the volumes are rising watch on shorter time frame and see how the price reacts near the resistance. WATCH THE ORDERBOOK MUST and see what is being played there.

DGKC ACCUMULATION BOX TRADE IDEADGKC IS TRADING IN A ACCUMULATION BOX. HALF YR RESULT WILL BE ANNOUNCED TODAY. EXPECTING GOOD RESULTS WHICH WILL BREAK THE ACCUMULATION BOX.
THE REAL REISTANCE IS AT 108.20 WHICH IS THE WEEKLY PREVIOUS HIGHER LOW AFTER WHICH THE STOCK WENT DOWN to all time low.
HOWEVER THERE IS A DEVIATION FROM 109 TO 112.
AT THE BREAKOUT AT 112 WITH LARGE VOLUMES will start the uptrend
A retest might be possible at the top of accumualation box at 112. Watch on 5m and 15m The EMA 21 is currently acting as a support.
the next quick target will be 116 . If the stock gives a strong breakout above 116 then 122 looks like the next target.

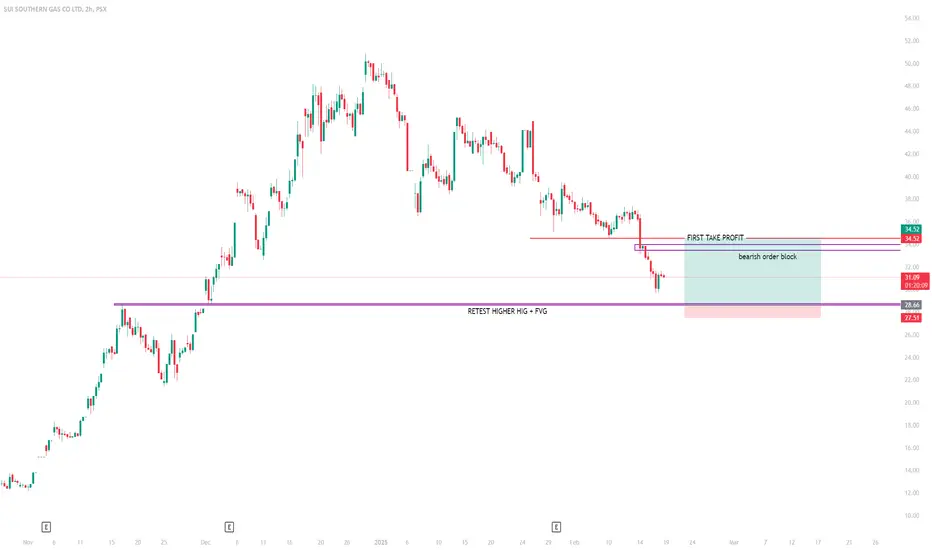
SSGC TRADE IDEA. RETEST + FVGSSGC is currently on a loosing streak after rallying up almost 80 percent after the breakout on daily chart at 28.75 The stock is now again coming back to retest the previous high at 28.75
There is a fair value gap also around 28.75. A large amount of liquidity is resting at 28.75 to 29.00. The stock will show a quick bounce from these levels.
But the stock will be very volatile near these level as mentioned above.
put limit orders also watch closely near 28.75 to 29.00
As the big players also might hunt for stop losses just below these levels so be careful and watch carefully but this is a big chance to buy as the stock will rally quickly around 10 to 15 percent after absorbing liquidity at these levels!
LETS SEE WHAT HAPPENS.
BFBIO is flying to 4 figures.BFBIO is going very high since it started This positive momentum may lead it to 365, 640, 910, 1180 and 1430 level.
Note: This is not a buy/sell call. Trade
at your own will. Use stop loss

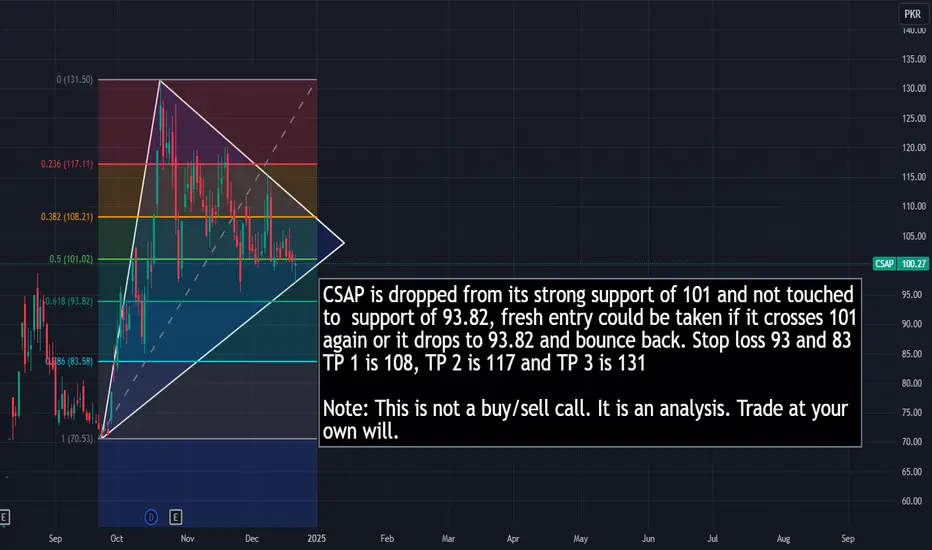
CSAP is heading to 131 againCSAP is dropped from its strong support of 101 and not touched to support of 93.82, fresh entry could be taken if it crosses 101 again or it drops to 93.82 and bounce back. Stop loss 93 and 83 TP 1 is 108, TP 2 is 117 and TP 3 is 131
Note: This is not a buy/sell call. It is an analysis. Trade at your
own will.
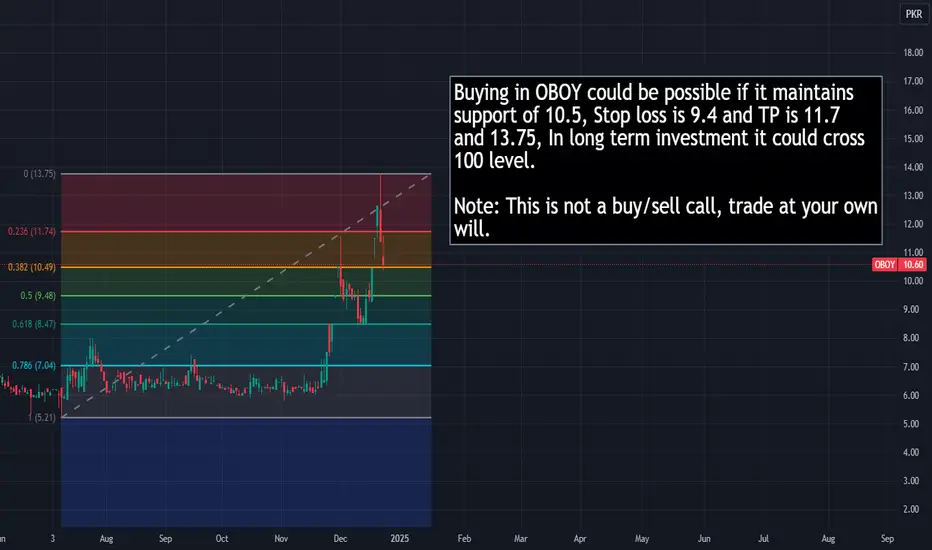
OBOY looks good to buyBuying in OBOY could be possible if it maintains support of 10.5, Stop loss is 9.4 and TP is 11.7 and 13.75, In long term investment it could cross 100 level.
Note: This is not a buy/sell call, trade at your own
will.
Sazew intra day and Swing trade levels.Sazew intra day and swing trade model
These are key levels 1273, 1191, 1141, 1101, 1061, 1004 and 930
When price crosses above from these levels take a trade and TP will be next level and TP 2 will be next to next level. Stop loss is below level. For example it is currently on 1081 so, we have to wait for next level of 1101 for buy entry, TP 1 will be
1141 and TP 2 is 1191 and stop loss is 1061.
Note: This is not a buy/sell call. Trade at your own will.
