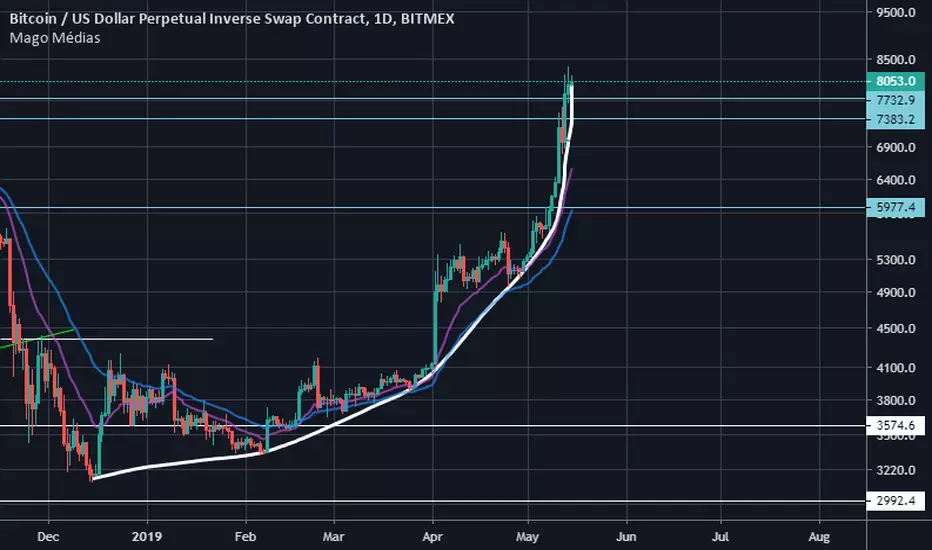
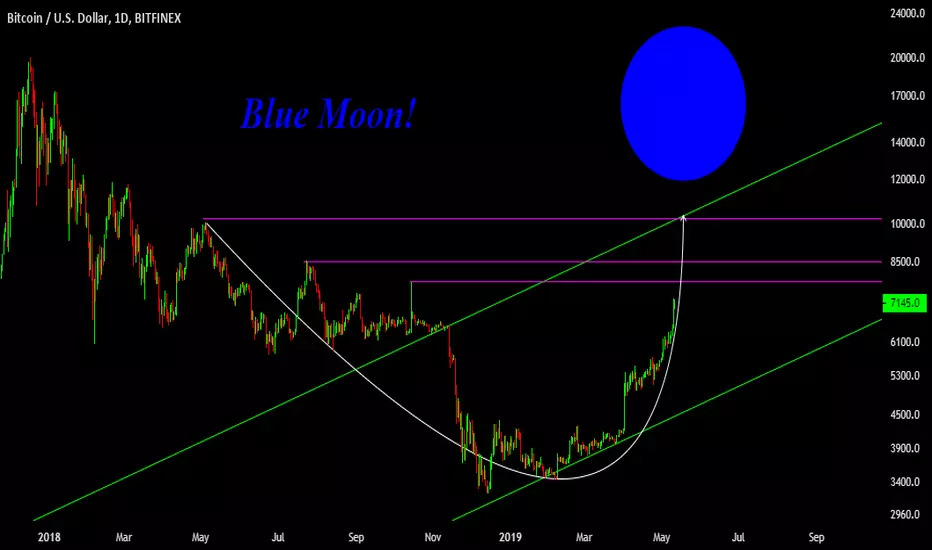
BTC-USD folows trendline to 10.000Uptrend trend-line is still valid (green dotted) and BTC once again formed bullish ascending triangle.
If the break of 8250-8500 resistance will be confirmed, we are heading straight to 10.000 USD.
Fasten your seat belts, sky is the limit.
Parabolic

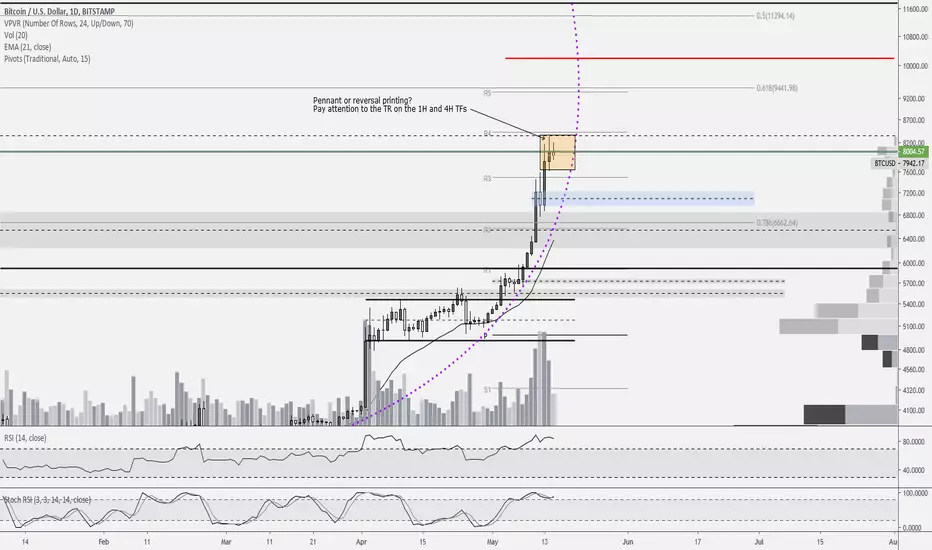
BTCUSD 1D chart (5/15/2019)Good morning traders. Price continues to range sideways and, as it does, I am seeing and ever-growing list of "It's going to make a new low now," "The bear market isn't over yet," and "The bull market will begin, but not yet" arguments. Most retail traders are still in disbelief at the price advance for the past 5 months. Price must absolutely go way back down again, they say. This is in spite of all the indicators stating otherwise, not the least of which is price action and volume.
For those looking to milk some profits out of a final move up, this sideways movement can be frustrating and stressful. For those looking to scalp, however, this has provided the perfect trading environment. We've had several Discord members taking advantage of the scalping environment and raking in quite a bit of profit in the process. I continue to hold my long position, however. If it is frustrating you that price has moved sideways for a few days, just understand that we are sitting at the 1M pivot so the resistance shouldn't be a surprise. Will price continue higher into a blow off top? That remains my expectation at this time. If so, just how high can it go? We spent much of yesterday evening discussing technical possibilities in Discord.
The ~$8750-$9300/daily R5 pivot level is likely the safe bet, however zooming out to the 4H chart gives a possible wave count that takes price to ~$10,150-$10,350. Then of course there are other technical targets such as the H4 R4 pivot at $11,020, the top of the 2018 TR at $11,780, the H4 R5 pivot at $12,165, and 1M R1 pivot at $12,912. The corrective market fib levels are 61.8% at $9441.98, 50% at $11,394.14, 38.2% at $13,346.30, and 23.6% at $15,761.68. I would suggest that traders keep the monthly pivots and corrective market fib levels marked as significant areas of interest on their charts as price continues its move up through those levels, whenever it does finally happen.
The reality is that anyone who happens to get close to the top on this possible final move up will be more lucky than anything else, myself included, due to the parabolic advance and cyclical accumulation that took place. So locking in any profit along the way is a smart move. The more emotional, less experienced traders will likely attempt to ride it up as high as possible and then be unable to convince themselves to exit when price reverses. Do not be that person. With volatility back in town, there will be a plethora of opportunities for much less risky trades in this market. As a trader, your job is to limit your risk, so you can start looking for upcoming opportunities in other cryptocurrencies. We have posted numerous alt trading opportunities in Discord recently for traders to watch as Bitcoin finishes up, and you should be keeping track of alts as well. We continue to expect alts to make good moves when Bitcoin enters its pullback.
Currently, we see price finding resistance, and consolidating, at the 2018 TR EQ. It is possible that this consolidation is printing a pennant, but I wouldn't be surprised to see the reversal form here as well due to the 2018 TR EQ. We can see the parabolic advance noted on this daily chart but no large upper wick. Must it have this wick? No, but this is currently what I'm looking for to mark the blow off top and is why I believe we may still have some upside left in this movement. That being said, I'm also watching the current TR on the 1H and 4H TFs for signs of excessive weakness, in which case I would likely exit my position in anticipation of the reversal. Ultimately, price falling through the purple arc would be the signal that the parabolic movement is over. The noted demand zones in blue and grey are the support levels, as well as the TR at the pivot. Stoch RSI is crossing bullishly but we have a lot of hours left in this daily candle to change that.
Every day, we have a choice to act positively or negatively, so if you get a chance, do something decent for someone today which could be as simple as sharing a nice word with them. You just might change their day, or even their life.
Remember, you can always click on the "share" button in the lower right hand of the screen, under the chart, and then click on "Make it mine" from the popup menu in order to get a live version of the chart that you can explore on your own.
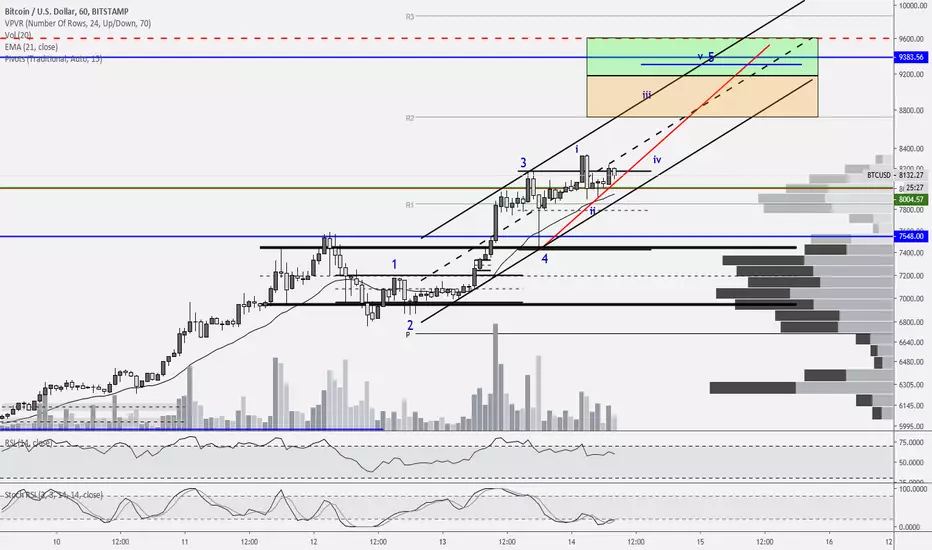
BTCUSD 1H chart (5/15/2019)Good morning traders. "Journalists" and "analysts" have littered social media lately with "explanations" of why price has reached the level it has, most often justifying it as a result of Fidelity, AmeriTrade, and Baakt entering the market. The reality is that price is exactly where I said it would be in January/February, long before all this news even hinted at coming out. As a matter of fact, at that time Baakt actually postponed its launch. As I have continued to state for the past year and a half, the news is already in the charts. Most traders just don't see the movement until it happens.
At this point, price is just grinding its way toward, what I believe will be, the blow off top. I remain long, holding for the $9000 level. If this final subwave count plays out as we generally expect the average wave set to do, then we should see price topping out around $9300. In terms of parabolic price action, Base 3 is around $4650. Since we generally expect price to double from Base 3, this would give us an expected target in the area of $9300 as well. If this final wave count prints an ending diagonal, then we should expect a shorter target as the waves will overlap each other. In that case, price is more likely to complete in the orange box between the R2 pivot and the green box ($8725-$9180). Please keep in mind, volume is low and the order books are thin as this is the final bit of the upward movement so price could always surge higher or stop just short of the targets. Attempting to trade this very last bit of movement most often causes traders to lose money so don't be afraid to take some profit and wait for the retracement.
As I've mentioned, I believe the initial retracement will be sharp and potentially bounce at the $7000-$7400 level, toward $8100, before falling further. This would complete the blow off top. So traders can attempt to short the drop but, as always, it's risky as you may not be able to log into your exchange due to server overload as other traders attempt to log in and short it as well. I have been looking for a bottom in the $6000s but have mentioned the possibility of heading a bit lower as well. Ultimately, I wouldn't expect price to drop below Base 3 between $4600 and $5600. My expectation would be for price to bounce in the $5300-$5600 range if it does get to that level and then consolidate in the $6000s before heading up once again. This drop and consolidation should likely take around 3-4 weeks during which time I expect that alts will have a bit of a party.
Every day, we have a choice to act positively or negatively, so if you get a chance, do something decent for someone today which could be as simple as sharing a nice word with them. You just might change their day, or even their life.
Remember, you can always click on the "share" button in the lower right hand of the screen, under the chart, and then click on "Make it mine" from the popup menu in order to get a live version of the chart that you can explore on your own.
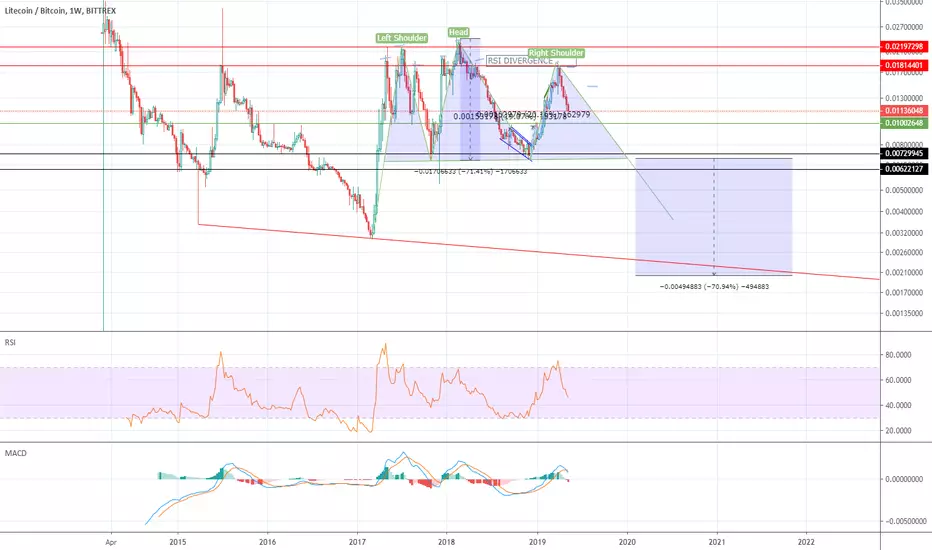
LTCBTC - The biggest H&S I have ever seenIf that happens LTC and probably most Altcoins will give away most of their value vs Bitcoin.
In that scenario, Bitcoin is going to move into that Hyperwave some experts are talking about.
I don't know, but to me that means, Bitcoin could one day be worth so much, we can not even think of that number..
Euphoria is back. Poor people waiting for 4200.
10k next.
BTCUSD 4H chart (5/13/2019)Good morning traders. If you haven't been in Discord with us then you missed my Bitcoin updates on Friday and Saturday as well as my live stream where I updated my thoughts for members and price followed along as I outlined that it would. It appears that we are now completing reaccumulation with eyes a few thousand dollars higher. In terms of the parabola price has been printing, this recent reaccumulation range should be Base 4. We can see RSI continuing to adhere to the support line created at Base 3 and showing likely bearish divergence upcoming as price nears the swing high but RSI is much lower than its own recent high. Stoch RSI is also just leaving oversold with a lot of room to run. I believe Base 3 was the large April reaccumulation period and is where we usually see price double from pretty quickly. As such, we should expect price to target the ~$9400 level. Because it would be a blow-off top completing the 3rd wave, we could see price end within a few hundred dollars in either direction of that number (the green box is the target area). My expectation is to see price drop back down to the $6000s to complete wave 4 before seeing wave 5 target the large 2018 descending wedge target around $14500-$15000. Be sure to watch this morning's video update if you'd like to see the analog to 2015.
People will mistakenly think that price needs to drop back down to $4000 (or lower): 1) because they are scared they missed the best entries (they did), and 2) they think the blow-off top is going to have price retracing most of this move up. I do not believe this is the case. The one thing that most of cryptotwitter and tradingview personalities don't seem to understand is accumulation and distribution. The former took place over the course of the past year. This means that retail traders don't have the means to curtail professional buying, which has been the driver of price throughout 2019 so far. Retail remains on the sidelines in disbelief as price continues its upward trek. The failure of price to continue down below $5000 should be the nail in the coffin that creates greater FOMO leading to the wave 5 target right in monthly supply.
That being said, the expected wave 3 blow-off top and subsequent wave 4 consolidation should create a large reaccumulation pattern. Again, most of CT and TV have no understanding of accumulation/distribution which means they have an even worse understanding of reaccumulation. Yes, the reaccumulation can be divided into a hyperbolic distribution phase at the top of wave 3 and an accumulation phase at wave 4, but make no mistake it is a complete reaccumulation phase on the larger TF. Why is this important? Because it puts cyclical price action into perspective. If you understand the larger TF, then there is little-to-know reason to believe that price will return to $4000 or lower.
Could I be wrong? Sure I could, but to trade devil's advocate against a strong bullish trend is most likely going to lose you money. Traders argued that they should trade the bearish trend during the correction but can't seem to get out of their own way now, and refuse to trade the bullish trend we've witnessed for five straight months now. Whether you believe I'm right or wrong, if you are trading without strict adherence to intelligent risk management you are going to lose everything you make and then some.
Every day, we have a choice to act positively or negatively, so if you get a chance, do something decent for someone today which could be as simple as sharing a nice word with them. You just might change their day, or even their life.
Remember, you can always click on the "share" button in the lower right hand of the screen, under the chart, and then click on "Make it mine" from the popup menu in order to get a live version of the chart that you can explore on your own.
The Long Journey for Bitcoin Has Begun, get ready folks! BULLRUNBitcoin is just a series of parabolic moves after parabolic moves, quite simple really. Expect big price action going forward! Buy the dip and etc. Easy money folks! Don't miss out.
I expect to dip down and form a large cup and handle pattern before major lift off of the bottom parabolic rising channel.
The dip could range anywhere from 3500 to 6000. My bet is on 4200 at the lowest and 5750 at the highest.
After the dip just hodl and make your first sell off at 20k. (Just incase we don't past it).
After 20k, hodl till 50k, then 100k (Not likely as it's outside the channel, but you can always hope).
Goodluck!

$BTC sickly manipulatedYou might be a Bitcoin believer or not but you can't deny the fact that these days $BTC bull run was mostly (if not completely) manipulated.
Let's face it. Interest on bitcoin (especially within the media) was gone. New fuel (new "investors" joining) were less and less. Overall prices were going down slowly with huge amounts of long "bets" posted at irrational price levels (19k$ for example).
The only possibility for those people that invested by the mantra of "buying the dip" at every single drop of price since Dec 2017 was to have a sort of bull run kicked off in order to be able to liquidate some if not all of their irrational positions acquired during the bear market of cryptocurrencies.
The last few days we have seen a parabolic advance curve forming on the common BTC/USD cross. Volumes picked up and the price jumped from 5k to 7k and more.
Now what? well, this market NEEDS a pullback. RSI shows overbought signs in almost all time spans. Be careful....a drop is coming and it's going to be a huge one in my opinion.
***AS usual, not an investment advice, merely my opinion for informational and educational purposes only***

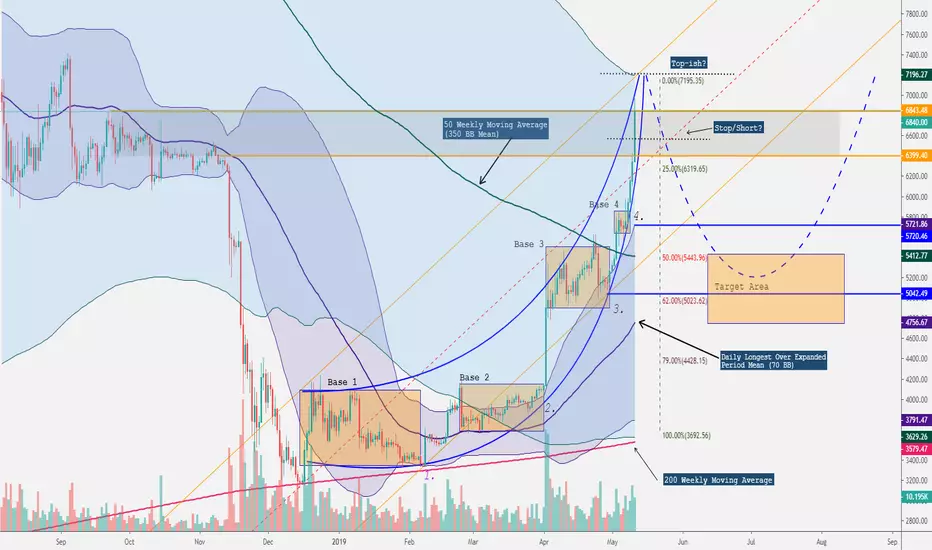
BTCUSD - Sheer Parabolic Madness. End Near?Personally, I've never participated in a parabolic move like this. As a student of Volatility Theory, my desire here is to analyze this move in shotgun marriage style with what limited information obtained about parabolic curves.
Admittedly, a few previous posts were not taken seriously by myself. In an effort to ameliorate and elaborate the analysis, I'd like to bring in a few notable points from Volatility Theory that leans on the usage Bollinger Bands and Distribution sets for a more tempered assessment of this absurd experience and moment in time.
Just the points though. If you'd like to learn about Volatility Theory, I'll post a link below. Great group of folks there and on SharkCharts.live. Special thanks for all the ideas floating around from the insightful minds there - especially DadShark, ACATwithcharts, and the many members.
Quick Legend :
BB = Bollinger Bands
StdDev = Standard Deviation
LOXP = Longest OverExpanded Period
Notable Points :
The origins of this parabolic move can be traced back to December (though it was unrevealed at that point for obvious reasons)
Price Action moved inside the 50 Weekly Distribution Set (350 BB on the Daily)
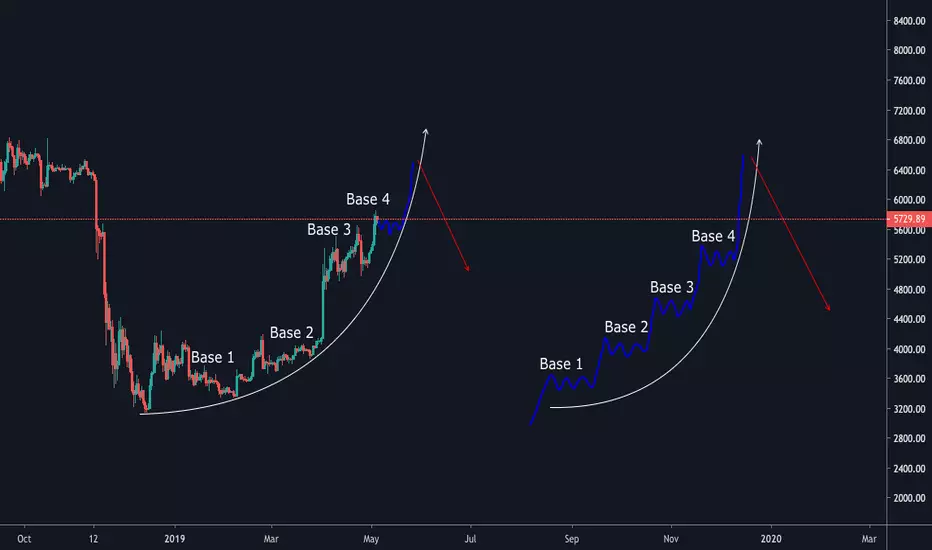
The present LOXP on the Daily is 70 and it's clearly trending above that after this 4th base
Moves like these seem to have 4 bases of contact on the arc/curve which appear satisfied in this analysis
What information I have found through simple search suggests that this post 4th move could be the last neck of this leg.
The top of this move is not yet known, so the parallel channel here is a projection
The top of the parallel channel has been generously assigned to the 1.25 StdDev Upper Band of the 50 Weekly Moving Average
The angle of the curve seems to direct itself quite nicely to the Upper Band of the 50 Weekly Bands @ 1.25 StdDev
There is a heavy order block in the same area that would constitute a top, though likely only mildly important with this euphoric move
A break of the channel 'mean' could be a good indication that this move is coming to an end
Projected and evidence based retrace from moves like these are anywhere from 62% - 79%, and have heard 50% retrace is a bit lower of a probability yet not out of the question.
The Daily LOXP Mean (70 @ 1.25 StdDev) is going to be traveling up to meet price, which may place it in the 50 - 62% area before all is said and done.
The 50 Weekly Moving Average is also starting to settle right around that 50% retrace value
Price generally trades to the mean (which it has already done) and laterally as defined by the same distribution set once it breaks inside, as it has here - (a break inside is a crossing of the 1.25 StdDev of the 50 Weekly BB or any distribution set for that matter).
Is it unlikely that we break the 50 Weekly 1.25 Upper Band? I think, no. It's entirely possible. I think for this trend to continue on a healthy path, a correction inside this 50 Weekly Band is probable and necessary.
This smaller distribution set has turned into a much larger distribution set, which is equivalent to turning off the road. The road does not go this way, as the upper slope of probability is downwards, not upwards (Mark Whistlers analogy, "Why do retail traders attempt to turn off the road with trading") - meaning, we're slightly against the grain here.
Again, I'm merely a student of the charts. If you know something about parabolic moves, please share. This idea is as wild as this price action but it has been quite an experience.
Good luck traders, may you find yourself on the profitable side of it!
www.futuresmag.com
www.guppytraders.com
steemit.com
Reading: Mark Whistler - Volatility Illuminated
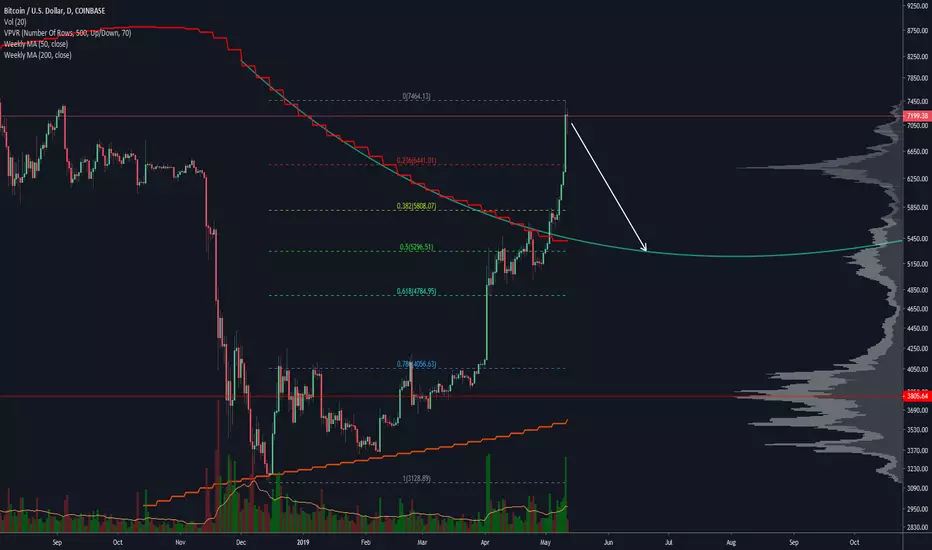
Retrace to 5500-5300 on BTCWe have been in overbought territory on the daily for quite some time, now we are overbought on weekly and the move became so parabolic I don't see it being sustained for much longer. Bitfinex is trading at a discount, bitmex funding returned to 0.01%, so this may be the end of current rally. Be advised though, shorting parabolic moves is very dangerous and volatility is high, so if you are not experienced, don't. Better buy the dip when we correct.
In red you can see the 50 weekly moving average, I extrapolated it's path so we can guess where a retest can happen if it is to come. It coincides with a 0.5 fibonacci retracement of the whole move from lows.
Correction aside this was a very bullish move, which tells us that the bearmarket is definitely over, so plan accordingly. We may not see the levels we wanted a retrace to.
PS: If you short here, I'd take 10-20% off at 6400, another 50% at 5800 and the rest at 5300 if it comes.
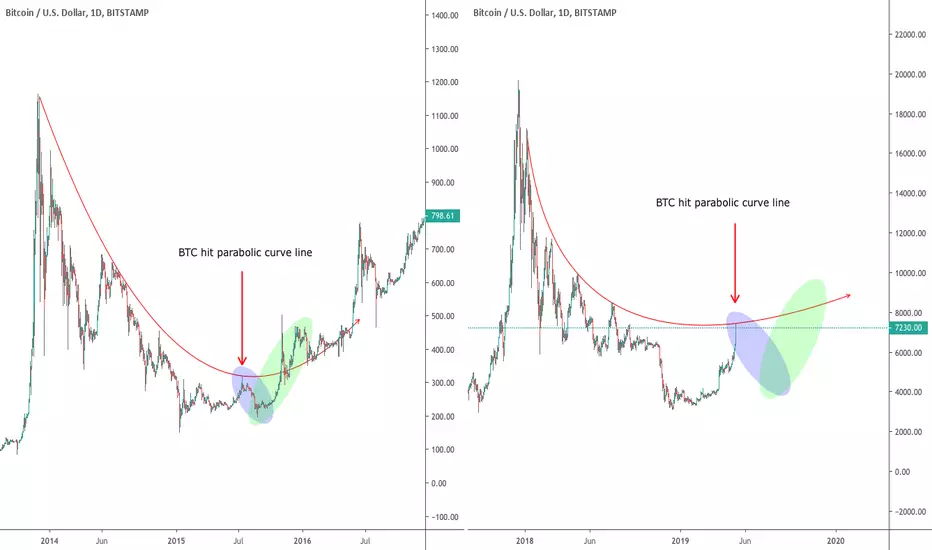
BTCUSD - Fail TA Parabolic HumorHere is some more fail TA that I found on the internet - basic search told me this would happen.
Careful folks, it's crypto..

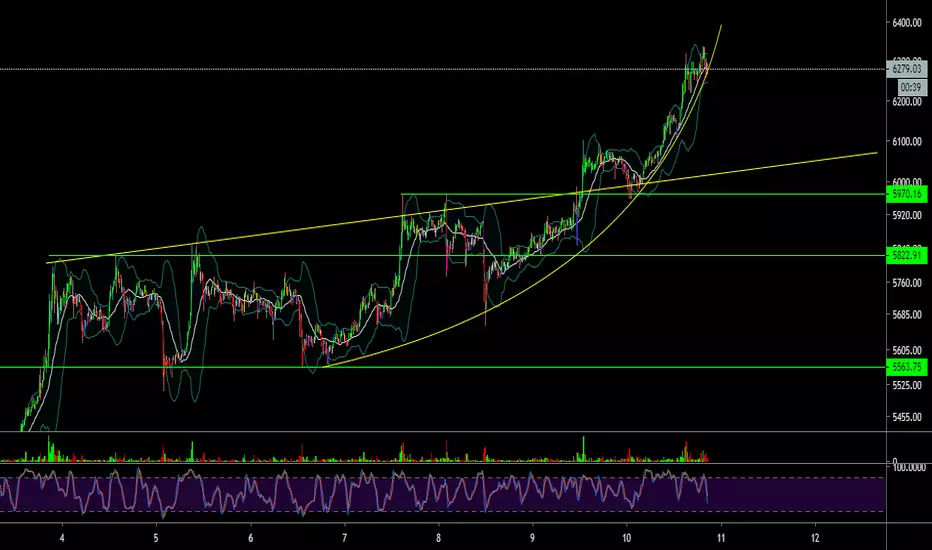
Low Time Frame Parabolic CurveIt will be interesting to see how this one plays out! A break of the curve then a median bband cross on 15min could result in a correction back to green line support
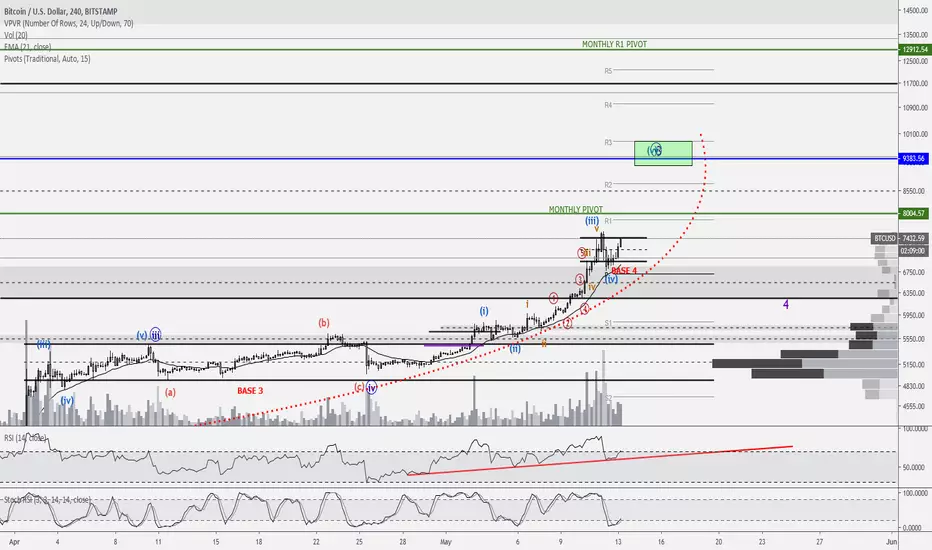
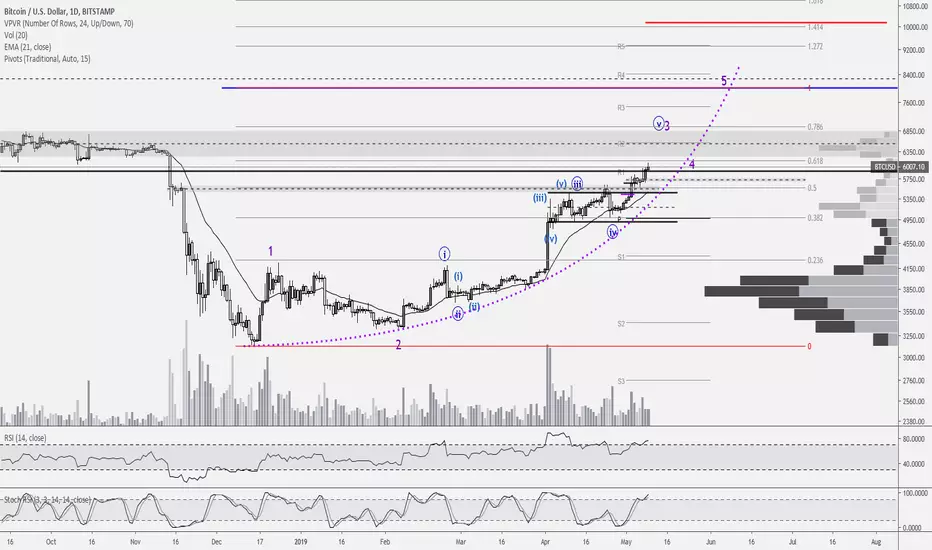
BTCUSD 1D chart (5/9/2019)Good morning traders. Price continues to move as expected, notching a new 2019 high at $6099 on Bitstamp last night. I am zooming out to the 1D chart today to give my thoughts. I don't really have much to add to what I've been saying for the past 4 months, but I would like to reiterate what I'm thinking.
Not too long ago I discussed this parabolic "pop" as a growing possibility (dotted purple curve). I have added in wave counts to let you know what I'm looking at from this larger TF. As you can see, I do believe we are in the fifth subwave of wave 3. However, where it ends remains a question. My belief, at this time, is that we will see it end between $6800 and the daily R3 pivot at $7475. Which level depends on how hard this next push is (should be subwave 3 of subwave 5 of wave 3). As always, I'll outline my thoughts with fibs, etc. during this morning's video update.
Everybody else thought that price would get rejected hard at $6000 yet we see price consolidating on top of it, much like what we saw at $5600. This suggests another good push up which aligns with my thoughts. A parabolic move like we are seeing should result in a blow-off top at the end of wave 5. My current wave 5 target (blue line) is based on the wave 3 target shown and happens to be the weekly pivot. However, if wave 3 targets the R3 pivot instead, then the wave 5 target becomes the red line around $10,000. Retail traders continue to remain in disbelief at this year's rally and are ignoring the accumulation that occurred as well as the FOMO that will continue to flood in as price rises above $6000, making these targets more and more likely. However, this does not guarantee that we will reach them. At this point, there are many variables which makes it hard to pinpoint a really likely scenario. So, risk management remains the name of the game, folks.
A breakdown from the recent high would likely see price retracing toward the $4350-$5000 level. That is the 61.8%-78.6% extension area. We would have to see how price moves at the beginning of that breakdown to figure out which is the most likely retracement target. My initial soft target for wave 3 remains the $6300-$6500 level, with an increasing likelihood that we will see it tap that $6800 level. But I will be watching price action and volume because the more this plays out as it has been, the more likely those higher targets of ~$6800 and ~$7400 are becoming. Looking at the pivots and price action, we would normally expect price to blow off around the R5 pivot as it is, which only gives more credence toward those higher wave 5 targets. If wave 5 targets $8000, then we would expect a retracement toward $4900-$5600 which is the sideways movement during April. If wave 5 targets $10,000 then we would expect a retracement toward $5800-$6600. In either case, the expected larger wave 2 retracement would find support at key levels before beginning the larger wave 3.
Every day, we have a choice to act positively or negatively, so if you get a chance, do something decent for someone today which could be as simple as sharing a nice word with them. You just might change their day, or even their life.
Remember, you can always click on the "share" button in the lower right hand of the screen, under the chart, and then click on "Make it mine" from the popup menu in order to get a live version of the chart that you can explore on your own.
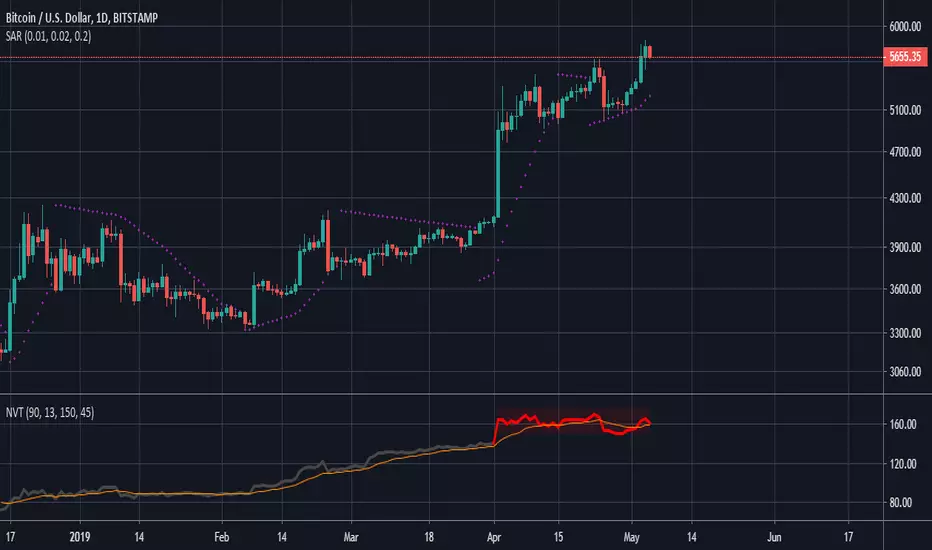
NVT signal and Parabolic SARIs the NVT signal saying we are over bought, I think it is. If the Daily/Weekly P.SAR reverses will we see the price turn south and create a profitable shorting opportunity?
NANO IS ON BULL RUN - STILL LOOKS GOOD FOR 15% +NANO is following our parabolic curve - overall looks very good

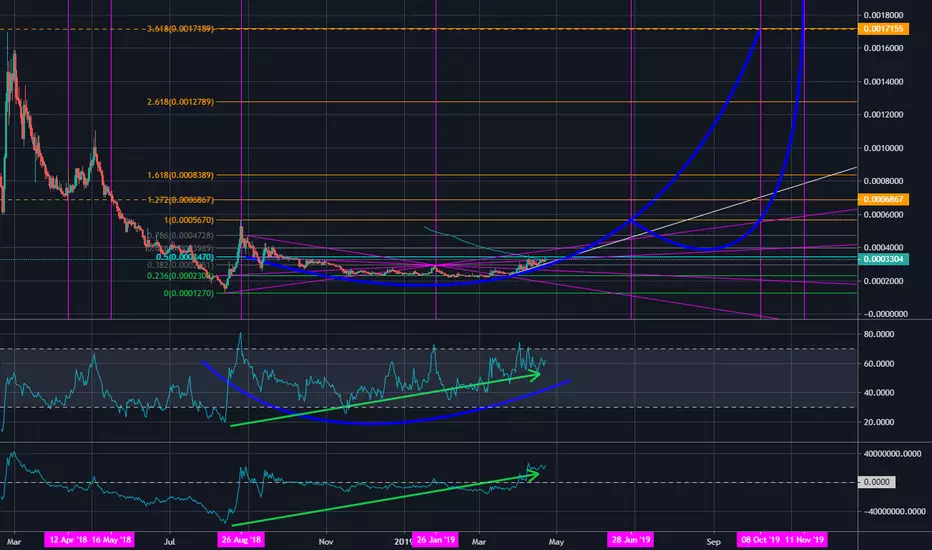
Is $NANO The Next $BNB / $BAT / $RVN?$NANO/BTC looks like it has been forming the perfect base for an imminent parabolic surge . Notice how pressure has been building while nearing the 0.5 Fib during the last 3 weeks. Both price strength and volume seem to confirm. What's more, when pressure started to build at the beginning of this month, OBV broke the zero line into positive area and is now already at the same level as the August 2018 high, while price has yet to follow.
First target is the 100% Fib level at the August 2018 top. The blue curve line reaches that level by the end of June 2019. At that point a correction might occur, forming a handle for the cup. That said, I expect price to stay above the blue curve line and even deviate away from it once this cork pops. In that case we'll probably break the August 2018 top and hit the 1.272 or even 1.618 Fib level before a major correction occurs.
If NANO can confirm its strength and trend during the next couple of weeks, its future surely looks bright towards this year's Q4!
This information is not trading advice, but for educational purposes only.
BTC current resistance and future parabolic runAs you can see in this chart, BTC has some confluences in resistance with the green parabolic curve and the red down trend line. I'm convinced that if we do fall from here, and IF we have already bottom, the next drop will be the best buying opportunity before the next run up. However, I am currently sitting in a BIG SHORT from 5240 and will ladder more if price has one more small push up because the next fall will be a corrective wave and not another wave for lower low. I don't think BTC will hit the 6000 range though from this continuation without a correction. Moreover, we can see that the purple line is still effective since the 2015 bear market and it is currently preventing BTC from going higher at this price.
Just my thought process.
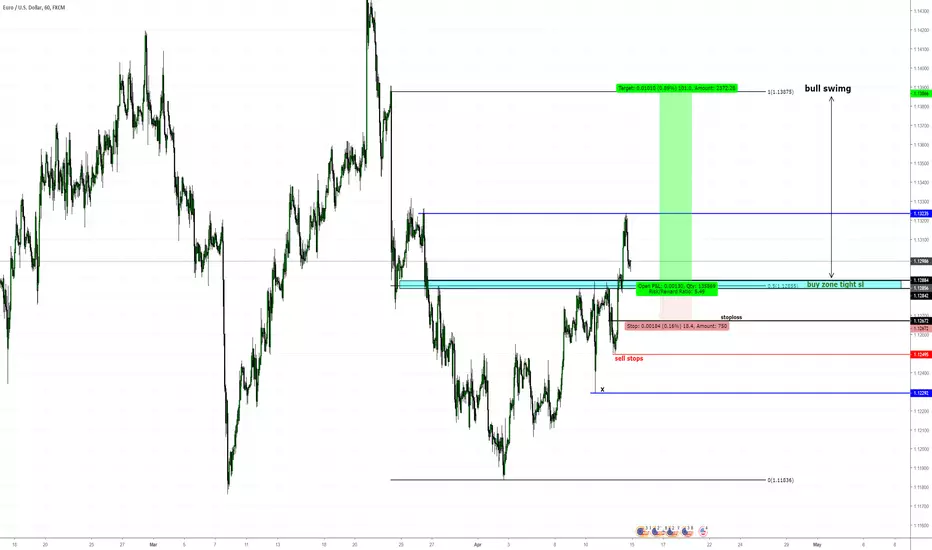
EURO/USD update 2 for this weekHello all ^^
we touched the first liquidity zone and a cool pullback into a very nice lvl for buy euro with tight stoploss!
if we dont break that structure dealing range we can hit the next target around 1.138 :)
in case we break that structure " Closing below and agressive price action to the downside " we cut the long and start selling stops where my zones are at targeting blue line first objective.
i remain short term bullish after hit my first tp zone , but we must wait for what the market wanna do next and swimg the wave
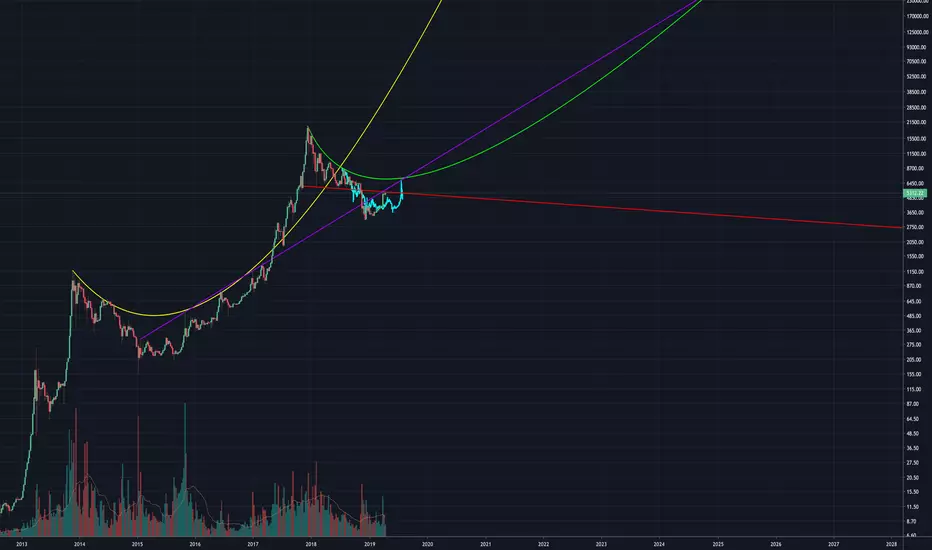
On Track for $BTC to $260k *The GREAT Accumulation has Begun*Here we see $BTC in its previous run-up gliding along the PURPLE trend line once it has hit its floor.
$BTC has hit its FLOOR, in other words $BTC has BOTTOMED, in other words, $BTC isn't going lower than $3178 ever again
Back to the analysis, it touches the PINK parabolic trend line breaching it for a moment and then going back to accumulation mode once again.
We see this occur 3 times over the course of a year, and on the 3rd time BOOM goes that dynamite!
Now here we are, in 2019, fiat on ramps have improved, market sentiment is vastly different than the MT. GOX era and institutional is primed and ready.
We have completed the first accumulation push of the year, we will have two more if market psychology remains the same(which i believe it will). The market cycles also seem to be following the same patterns but in a much more drawn out fashion.
In conclusion, the end of this year is going to be euphoric, especially if you have been accumulating through out the entirety of it.
Think, Plan, and Enjoy the future!
Cheers!

$SPY - Daily Chart Extreme Overbought & Parabolic Snapback Setup$SPY - our $283 level of resistance finally broke over with the market busting over and gapping up this week. Spy currently sitting at $288.26 at time of post. Highs of market are at $293.85. 7th green day in a row, constant gap ups making it hard to get day trades with market breadth sucked out before market opens. In individual names, I have been take about 30% less trades than normal. Longs my hold time is about 1/2 of what it was a few months ago. Always have to adapt and find the trend with market conditions.
$SPY - expecting a pullback sooner than later with stochastics now at 90.17. Market is due for a breather and pullback to at least 9ema, otherwise other notable level is $283 area again (for tap off support).
Have a great weekend coming up!
