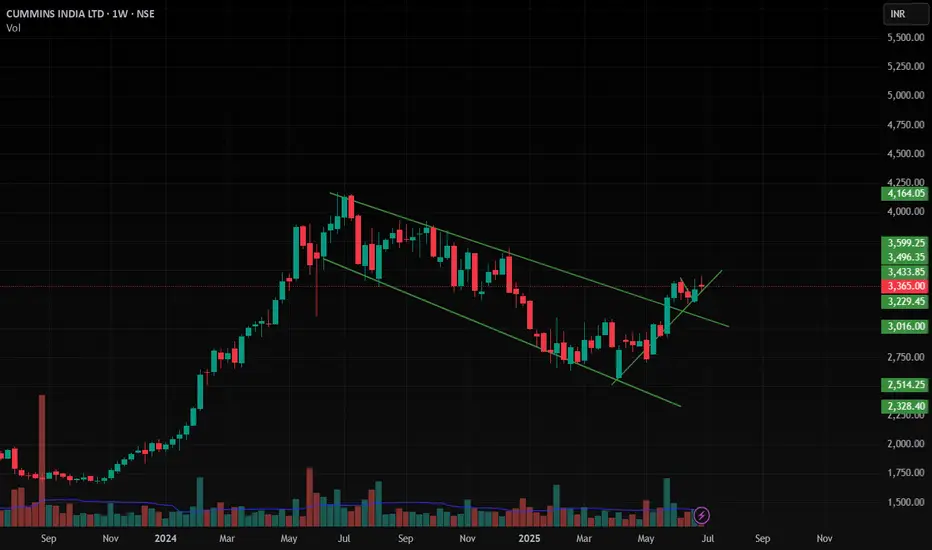
Cumminsind , 1W, Bullishit has Formed a very Good Pattern and Given a Breakout with Good Volume and now it is Trending to Up side ,
Follow proper position sizing and Risk Management
Follow for More Swing Ideas Like this
Parallel Channel
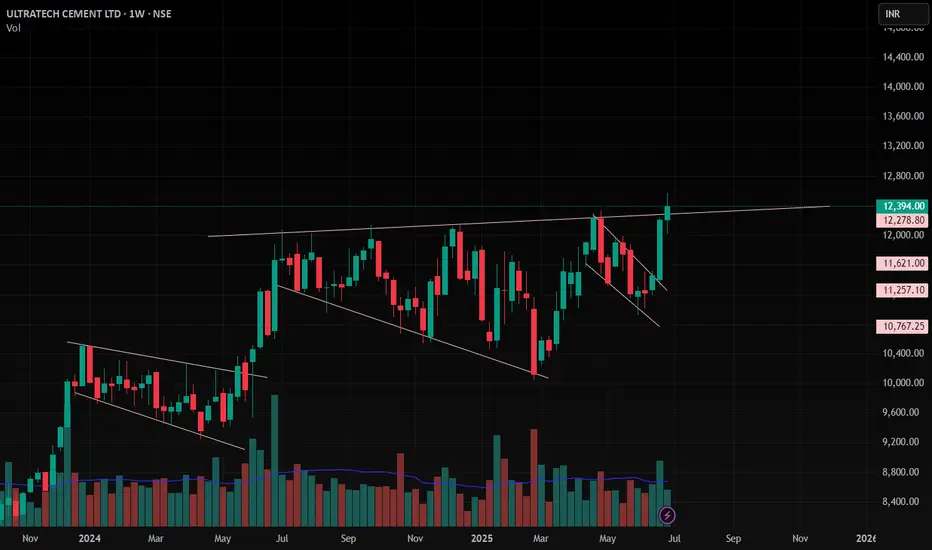
Ultracemco , 1W , Bullish As Ultracemco is Formed pattern and giving Breakout Now , Watch Carefully after Weekly Confirmation and Take Trade and follow proper Position Sizing and Risk according to your account size
follow for More Swing Ideas like this
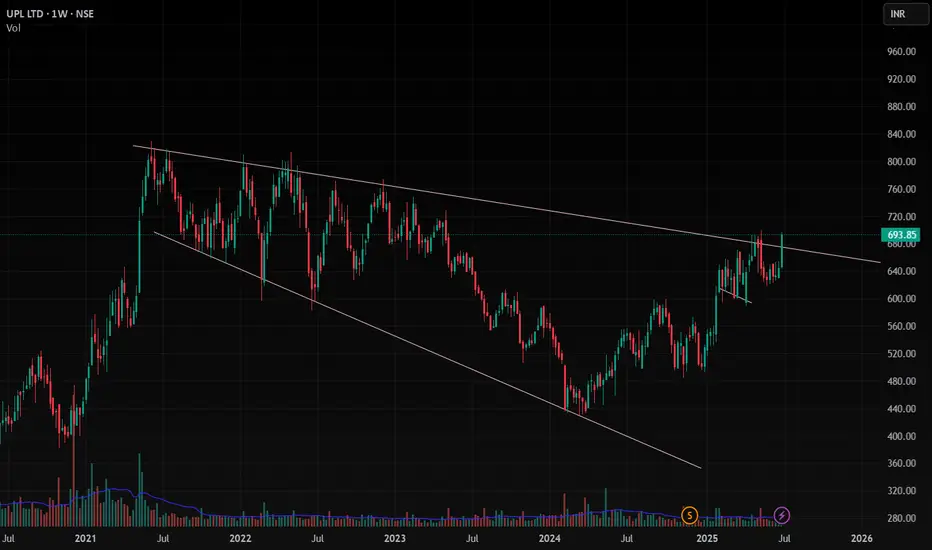
UPL , 1W , Weekly Bullish As the UPL pattern is looking very Good and Giving Breakout and Enter only after the Close of Weekly time frame .
follow your risk Management , proper Position Sizing
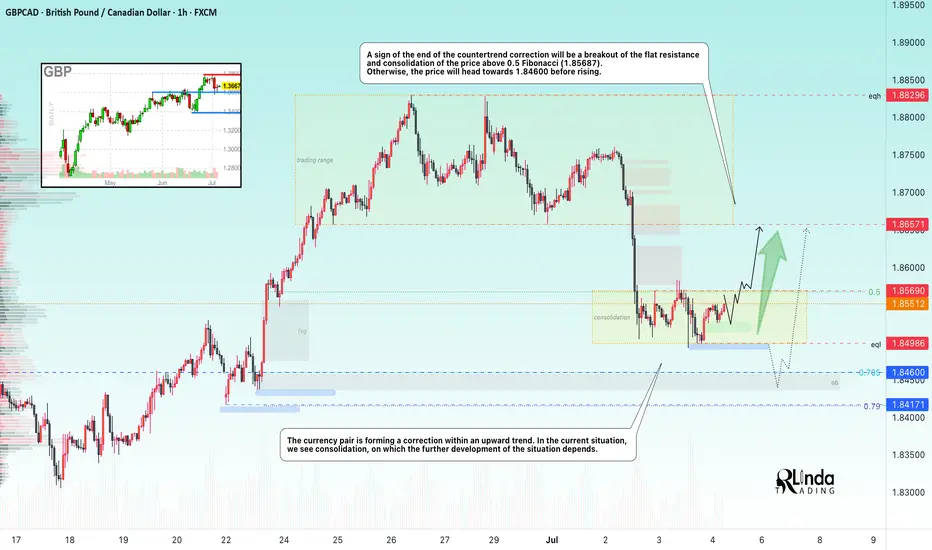
GBPCAD → Retest the area of interest before growthFX:GBPCAD is closing the imbalance area as part of a countertrend correction and consolidating below the 0.5 Fibonacci level. What's next, growth or decline?
The global trend is upward, and the situation is classic: the market needs energy and liquidity to continue growing.
Locally, we see that as part of a countertrend correction, the market is closing the imbalance area, but at the same time forming consolidation below 0.5 Fibonacci, still leaving the zone of interest and order block below 1.84600 untouched.
Technically, there is a fairly high probability of continued growth, provided that the price ends its consolidation with a breakout of the 1.85690 resistance and consolidates above 0.5 Fibonacci.
Resistance levels: 1.85690, 1.8657
Support levels: 1.84986, 1.846, 1.8417
However, as an additional and, in my opinion, the most important scenario, I still consider a complete closure of the fvg and a retest of the 0.7-0.79 zone, within which the order block is located. A false breakdown of the zone of interest and the capture of liquidity could attract additional interest, which would trigger growth.
Best regards, R. Linda!
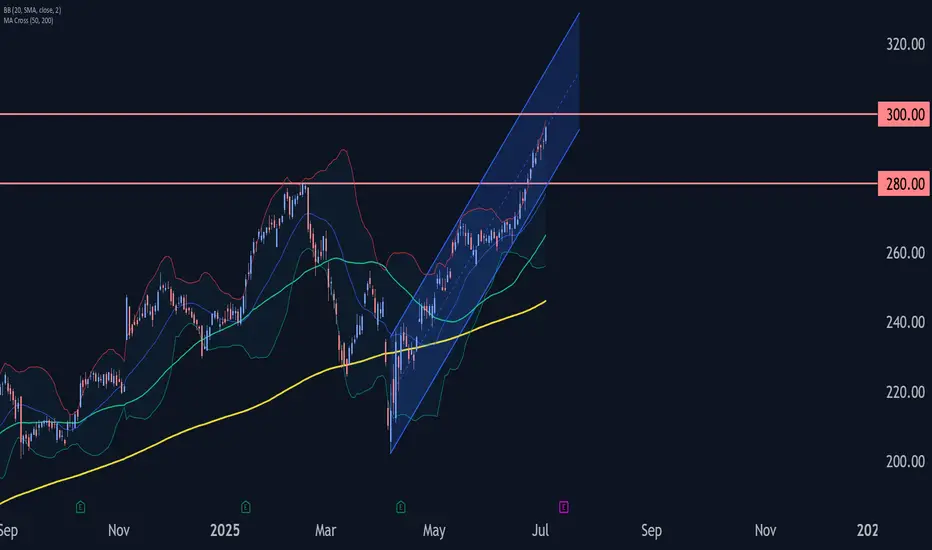
JPMorgan Chase Wave Analysis – 3 July 2025- JPMorgan broke key resistance level 280.00
- Likely to rise to resistance level 300.00
JPMorgan recently broke above the key resistance level 280.00 (which stopped the earlier sharp upward impulse wave (5) in February).
The breakout of the resistance level 280.00 accelerated the active impulse wave 3 of the medium-term impulse wave (5) from May.
Given the clear daily uptrend, JPMorgan can be expected to rise to the next round resistance level 300.00 (target price for the completion of the active impulse wave 3).
EURJPY Wave Analysis – 3 July 2025- EURJPY broke resistance level of 169.55
- Likely to rise to resistance level 72.00
EURJPY currency pair recently broke above the key resistance level 169.55 (which reversed the price multiple times at the end of June, as can be seen from the daily EURJPY chart below).
The breakout of the resistance level 169.55 accelerated the active short-term impulse wave 3 of the intermediate impulse wave (C) from February.
Given the clear daily uptrend, EURJPY currency pair can be expected to rise further to the next resistance level 172.00, target price for the completion of the active impulse wave (C) lying at the intersection of the 2 up channels from June and March.

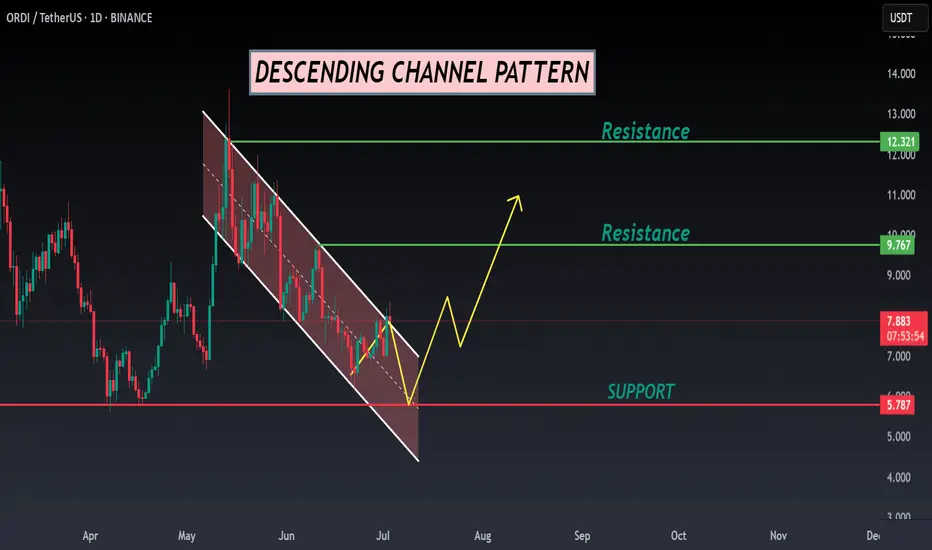
ORDI ANALYSIS📊 #ORDI Analysis
✅There is a formation of Descending Channel Pattern in daily time frame.
After a breakout of the pattern we would see a bullish momentum and can Target for $9.5 in few weeks🧐
👀Current Price: $7.890
🎯 Target Price : $9.500
⚡️What to do ?
👀Keep an eye on #ORDI price action and volume. We can trade according to the chart and make some profits⚡️⚡️
#ORDI #Cryptocurrency #Breakout #TechnicalAnalysis #DYOR
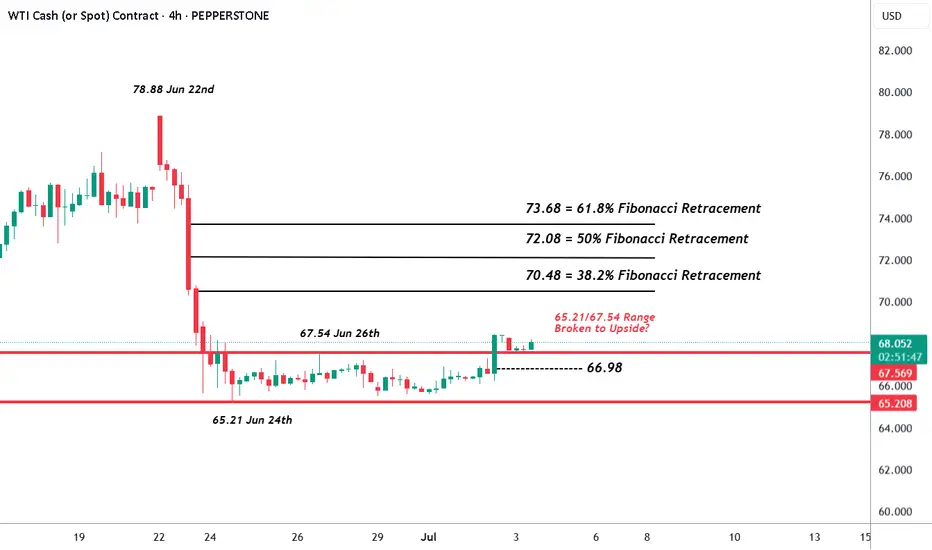
Oil (WTI) – Preparing for Potential Fresh VolatilityThe price of Oil (WTI) fell dramatically last week, from a high of 78.88 on Monday June 23rd to a low of 65.21 on Tuesday June 24th, as a ceasefire was first agreed and then held between Israel and Iran. This shifted the focus for traders back to US trade talks and looming tariffs, the direction of US economic growth and the potential for another OPEC+ production increase. Although, it must be said that nervousness about the sustainability of the ceasefire is still drawing the focus of traders this week and may continue to do so.
In terms of trade, Oil prices jumped higher yesterday as a trade deal between the US and Vietnam was announced, but the question remains, could this rally be short lived?
President Trump stated on Tuesday that he doesn’t expect to delay his July 9th tariff deadline, which could see higher import penalties reimposed on key trading partners, such as Japan and the EU. While it seems that traders may still be unsure whether he really means this, any potential impact on Oil prices could increase the closer we move to the deadline.
Today’s data releases could provide some key insights into the health of the US economy, with Non-farm payrolls released at 1330 BST and the US ISM Services PMI due at 1500 BST. Traders expect jobs growth to continue to moderate, so any bigger downside surprises could increase Oil price volatility, and the direction of service activity (bars, restaurants etc), the main driver of US growth for many months, may also be crucial for sentiment. Traders may be watching for whether there has been any major deterioration in this services PMI reading, back towards, or below 50, which is the dividing line between economic contraction and expansion.
Then, Sunday’s (July 6th) OPEC+ meeting, where the group is expected to agree to an August supply increase for a fourth month in a row, moves into focus. Depending on this OPEC+ decision and any tariff or geo-political developments over the weekend, Oil prices could potentially open up at very different levels on Monday morning.
Technical Update: Breaking Higher From Range?
Following the aggressive sell-off in the price of Oil from the 78.88 June 22nd high into the 65.21 June 24th low, a period of stability materialised as traders assessed the developing geo-political backdrop.
This saw price activity held by support offered by the 65.21 price low and resistance by the 67.54 June 26th high. However, as the 4 hourly chart above shows, the latest activity has now seen prices move out of this range, with a closing break above the previous 67.54 high.
While a break higher from such a sideways range in price is not a guarantee of continued upside, traders may now be viewing this type of activity as reflecting potential for a more extended phase of price strength.
Next Possible Resistance Levels.
If further price strength is to emerge, it might now suggest possibilities to test the 70.48 level, which is equal to the 38.2% Fibonacci retracement of the June 22nd to June 24th decline.
Closing breaks above this resistance may then lead to further attempts at price strength towards 72.08, which is the higher 50% retracement level.
Next Possible Support Levels
While some traders might view a move back into the old sideways price range, which would be represented by closes back under the 67.54 recent high, as marking the possibility of increasing downside pressure again, it might in fact be breaks under the 66.98 level, which is equal to half latest strength, that indicates the potential of further price declines.
Such downside closing breaks may well suggest potential to retest the 65.21 June 24th low trade, possibly further if this in turn gives way.
The material provided here has not been prepared accordance with legal requirements designed to promote the independence of investment research and as such is considered to be a marketing communication. Whilst it is not subject to any prohibition on dealing ahead of the dissemination of investment research, we will not seek to take any advantage before providing it to our clients.
Pepperstone doesn’t represent that the material provided here is accurate, current or complete, and therefore shouldn’t be relied upon as such. The information, whether from a third party or not, isn’t to be considered as a recommendation; or an offer to buy or sell; or the solicitation of an offer to buy or sell any security, financial product or instrument; or to participate in any particular trading strategy. It does not take into account readers’ financial situation or investment objectives. We advise any readers of this content to seek their own advice. Without the approval of Pepperstone, reproduction or redistribution of this information isn’t permitted.
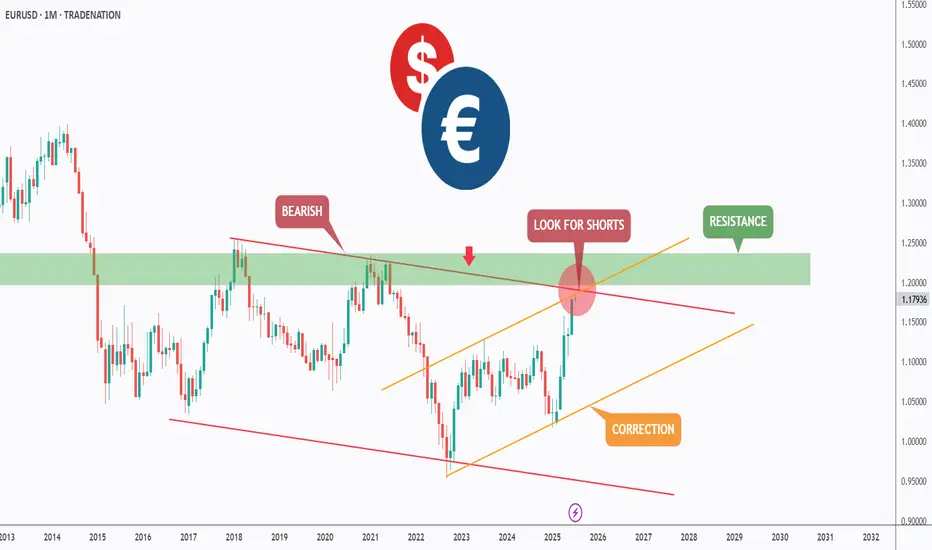
EURUSD - Macro Trend Shift Soon?Hello TradingView Family / Fellow Traders. This is Richard, also known as theSignalyst.
📈From a macro perspective, EURUSD has been bearish trading within the falling red channel.
Medium-term, EURUSD has been in a correction phase trading within the rising channel in orange.
Moreover, the green zone is a massive monthly resistance.
🏹 Thus, the highlighted red circle is a strong area to look for sell setups as it is the intersection of the upper red and orange trendlines and resistance.
📚 As per my trading style:
As #EURUSD is around the red circle zone, I will be looking for bearish reversal setups (like a double top pattern, trendline break , and so on...)
📚 Always follow your trading plan regarding entry, risk management, and trade management.
Good luck!
All Strategies Are Good; If Managed Properly!
~Rich
Disclosure: I am part of Trade Nation's Influencer program and receive a monthly fee for using their TradingView charts in my analysis.
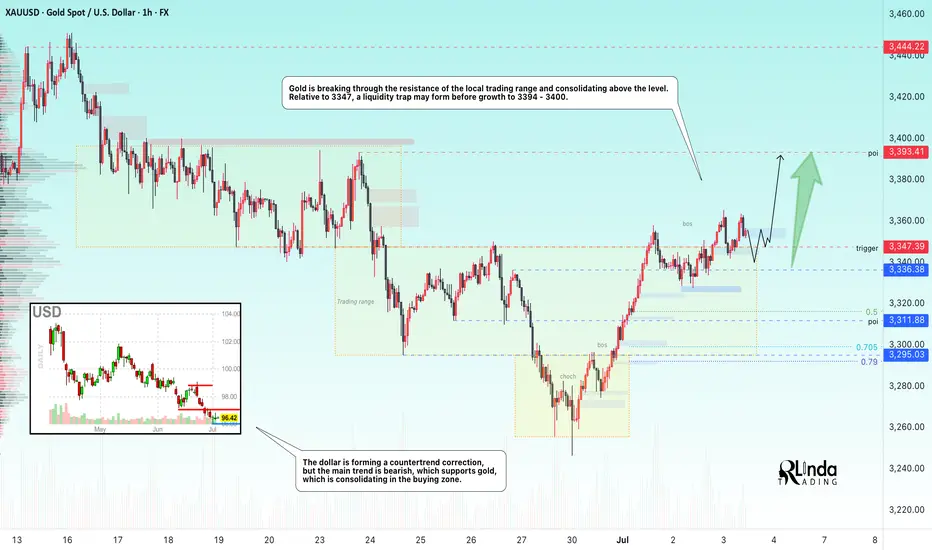
GOLD → Attempt to consolidate above 3350 for growth to 3400FX:XAUUSD , after retesting resistance at 3347, is breaking through the key level, while bulls are trying to hold their ground above support. There is potential for growth to 3400.
Gold retreated from its weekly high of $3366 ahead of key US employment data (NFP), which could set a new direction for the movement. But technically, this looks like a correction to consolidate above the level before continuing to rise. After three days of growth, the price faced selling amid a recovery in the dollar and profit-taking. Weak employment data (especially below 100,000) could reinforce expectations of a Fed rate cut as early as July and support gold. Conversely, a strong report will strengthen the dollar and put pressure on the metal. The market is bracing for high volatility
Resistance levels: 3363, 3393, 3400
Support levels: 3347, 3336, 3311
The price has entered a new range of 3345-3400. Consolidation is forming above the support level before a possible rise. I do not rule out another retest of 3345-3336 (liquidity zone) before realization and a rally to 3400.
Best regards, R. Linda!
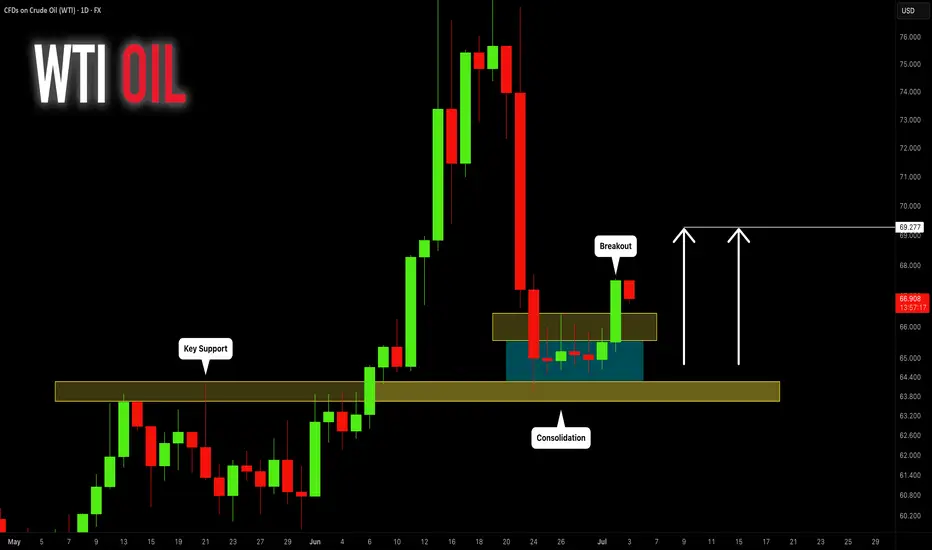
CRUDE OIL (WTI): Consolidation is Over
Crude Oil was consolidating for 6 trading days in a row
after a test of a key daily support.
The yesterday's Crude Oil Inventories data made the market bullish
and the price successfully violated a minor resistance of a sideways movement.
We can expect that the market will grow more.
Next resistance - 69.27
❤️Please, support my work with like, thank you!❤️
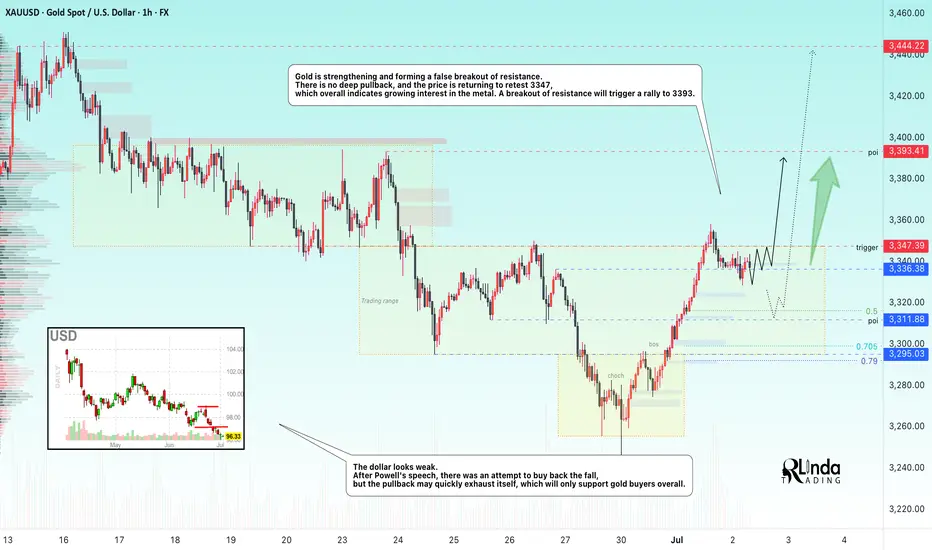
GOLD → Retesting resistance may lead to a breakout.FX:XAUUSD breaks the downward resistance line on the senior timeframe and tests the upper limit of the trading range amid the falling dollar and Powell's speech. The metal may continue its upward movement.
The dollar's rise was short-lived after Fed Chairman Jerome Powell hinted at an imminent interest rate cut, but not in July... The probability of a rate cut in July fell to 22%, and in September to 72%.
Markets are awaiting fresh employment data (ADP and Nonfarm Payrolls), which could influence the prospects for rate cuts. Weak reports could revive interest in gold, but for now, the asset remains under pressure due to the short-term strengthening of the dollar and uncertainty surrounding Fed policy.
Technically, if the pre-breakout structure remains intact and gold continues to attack resistance within the local range of 3347-3330 (3335), the chances of further growth will be high...
Resistance levels: 3347, 3358
Support levels: 3336, 3316, 3311
The global trend is upward, and locally, the price is also returning to growth. If the bulls can maintain the current trend, break through the resistance at 3347, and hold their ground above this level, then the next target will be 3390-3400. I do not rule out a correction to 3325, 3316 (liquidity hunt) before the growth continues.
Best regards, R. Linda!
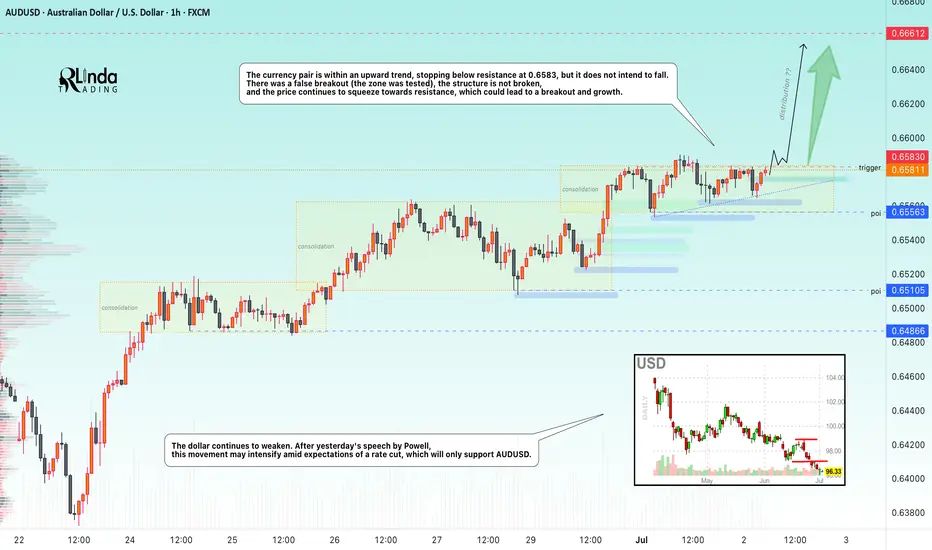
AUDUSD → Pre-breakout consolidation for trend continuationFX:AUDUSD may continue its upward trend. After another local distribution, the currency pair is consolidating and may repeat the cycle
The dollar index continues to fall, the global trend is clear, and the price is testing multi-year lows. After yesterday's speech by Powell, the decline may intensify amid expectations of a rate cut, which will only support AUDUSD.
AUDUSD is moving within an uptrend, stopping below resistance at 0.6583, but is not going to fall.
There was a false breakout (the zone was tested), the structure is not broken, and the price continues to squeeze towards resistance, which could lead to a breakout and growth
Resistance levels: 0.6583
Support levels: 0.6566, 0.6556
There is potential accumulation in the market, and the market is choosing growth against the backdrop of a falling dollar as its direction. Accordingly, the currency pair is one step away from a possible realization phase. Thus, if the price breaks 0.6583 and consolidates above this zone, it may continue to grow in the short and medium term.
Best regards, R. Linda!
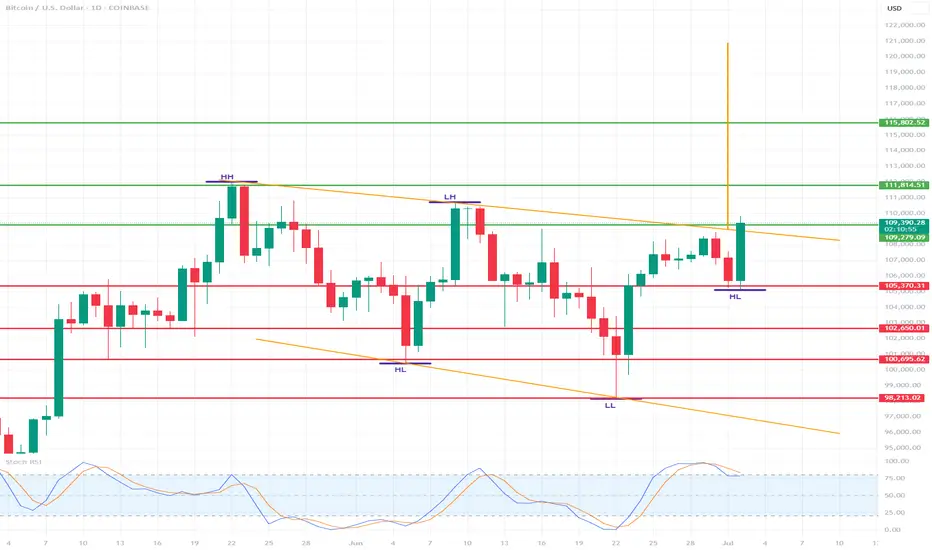
BTC with potential for $115,000/$120,000🔍 Market structure (Price Action)
📈 Trend:
The market previously formed higher highs (HH) and higher lows (HL) – a classic uptrend.
Then there was a correction and a lower high (LH) and lower low (LL) appeared – a potential change in the trend to a downtrend.
The last two lows are again HL (Higher Lows) – suggesting an attempt to return to the uptrend.
🔄 Key support and resistance levels
✅ Resistance (green horizontal lines):
117.469 – local resistance and potential breakout target from the current range.
115.802 – confirmed resistance from previous consolidations.
111.814 – strong local resistance (LH – Lower High formed there).
109.341 – current resistance, the price is currently testing it.
🛑 Support (red horizontal lines):
105.370 – local support, price reacted at this level in recent days.
102.650 – important support, level of previous HL.
100.095 – consolidation level before breaking out upwards.
98.213 – last LL – very important level in the context of defending the structure.
🧭 Structure of peaks and troughs
HH: Higher High – confirmed the previous uptrend.
LH: Lower High – first warning about changing the structure to down.
LL: Lower Low – confirmed a potential change to downside.
HL (x2): two more higher lows – suggest a possible return to growth.
📊 Stochastic RSI (at the bottom of the chart)
The oscillator is currently in the overbought zone (>80), approaching a downward crossover.
It suggests a possible short-term halt in growth or correction.
But in strong trends it may "stick" to the upper range.
📌 Potential scenarios:
🟢 Bullish:
If the price breaks above 109.341, it may test 111.814 and then 115.802.
Continuation of the HL → HH formation will confirm a trend reversal and further growth.
🔴 Bearish:
If the price does not stay above 109k and breaks below 105.370, there is a risk of a test of 102.650 and lower.
A break of 100.095 and especially 98.213 will negate the growth structure.
🧠 Conclusions:
The market is at a key decision point - HL formation vs. resistance zone.
Buyers' strength will be confirmed only after breaking 111-112k.
Stochastic RSI warns of potential pullback or consolidation.
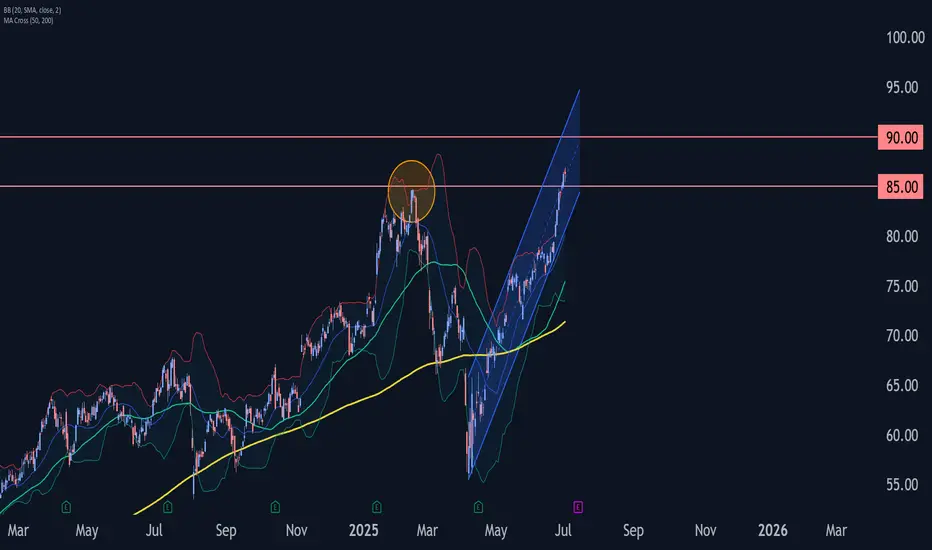
Citigroup Wave Analysis – 2 July 2025
- Citigroup broke key resistance level 85.00
- Likely to rise to resistance level 90.00
Citigroup recently broke above the key resistance level 85.00 (former multi-month high from February, which stopped the previous wave (A), as can be seen below).
The breakout of the resistance level 85.00 accelerated the active minor impulse wave 5 of the intermediate impulse wave (C) from April.
Citigroup can be expected to rise further to the next resistance level 90.00 (intersecting with the daily up channel from April).
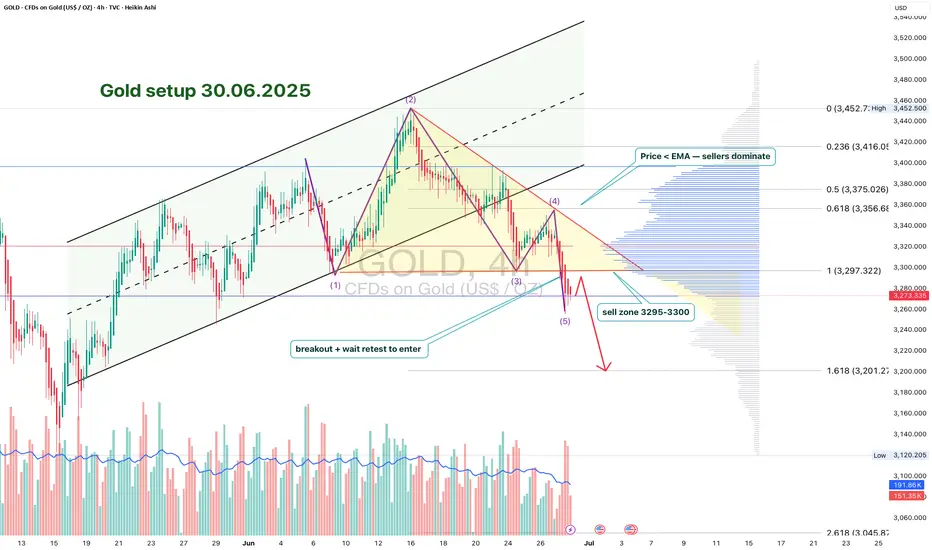
GOLD 4H: structure broken - phase reversal beginsTwo key directional signals were recorded on the gold chart: first, a breakdown of the ascending channel, followed by a confident downward exit from the triangle with a clear fixation under the $3297 boundary. Both figures worked independently, but consistently - and strengthened the impulse towards selling.
The price has already gone beyond the lower boundary of the triangle ($3297), confirming the bearish scenario. Candlesticks closing under the level and local consolidation from below is a characteristic formation before the momentum continues.
Technical parameters:
- Channel breakout: completed
- Triangle breakout: $3297 level
- Retest from below: expected as confirmation
- EMAs reversed downwards, structure broken
- Volumes strengthened at the moment of breakout
Tactical plan:
- Sell after retest of $3297
- Targets on the move: $3248 and $3201
- Stop: above $3305 (above the area of false outs).
The current structure indicates the end of the accumulation phase and the beginning of the downward momentum. As long as the price holds below $3297 - shorts are the priority.
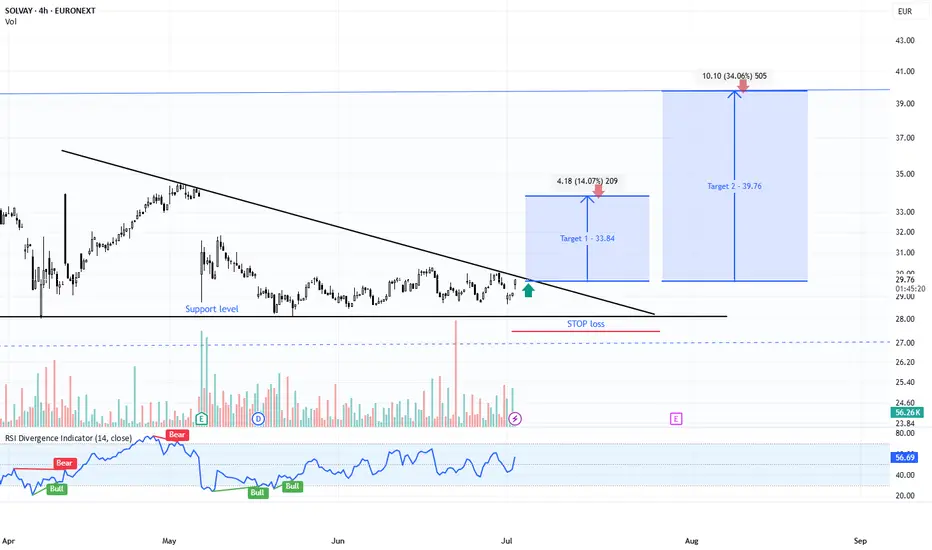
SOLB | Descending Triangle Breakout – Targeting +34% MoveTicker: EURONEXT:SOLB (Solvay SA – Euronext Brussels)
📆 Timeframe: 4H (4-hour)
📉 Price: €31.58
📈 Pattern: Descending triangle breakout from horizontal support
📊 Breakout Probability : ~73% upward breakout (short-term triangle)
🔍 Technical Setup:
SOLB has successfully broken above a descending resistance line, bouncing off a solid horizontal support level near €28.00. This forms a bullish descending triangle breakout – a structure that historically resolves upward in short- to mid-term timeframes.
✅ Confirmed breakout from descending triangle
🟢 RSI pushing above 56 = bullish short-term momentum
📉 Defined support below = favorable risk/reward
🧠 Trade Plan:
📥 Entry Zone: €31.40–€31.70 (post-breakout confirmation)
⛔ Stop-Loss: Below €27.90 (under support base and triangle invalidation)
🎯 Upside Targets & ROIC (from €31.58):
Target Price Return
🎯 Target 1 €33.84 +7.15%
🎯 Target 2 €39.76 +25.9%
📊 Pattern Probability – Based on Bulkowski:
📐 Pattern: Descending Triangle (short-term breakout)
🔺 Upward breakout probability: ~73%
💹 Measured move confirms Target 2 if volume remains elevated
⚠️ Technical Signals to Watch:
🔎 Strong green candle breaking the triangle → initial confirmation
✅ RSI breakout with no bearish divergence = supports continuation
📈 Volume spike = buyer interest returning
💬 Solvay’s breakout is a classic textbook move off strong horizontal support.
This is a high-probability swing setup with tight risk and excellent upside potential.
#SOLB #BreakoutSetup #DescendingTriangle #TechnicalPattern #SwingTrade #TargetTraders
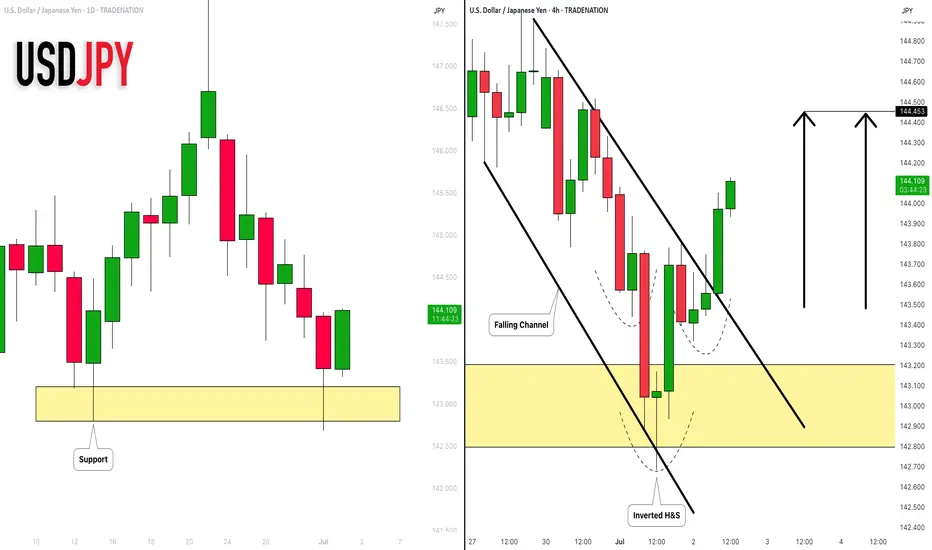
USDJPY: Strong Bullish Price Action 🇺🇸🇯🇵
I see 2 strong bullish confirmation on USDJPY after a test of a key daily
support cluster.
The price violated a trend line of a falling channel and a neckline of
an inverted head & shoulders pattern with one single strong bullish candle.
The pair may rise more and reach 144.45 level soon.
❤️Please, support my work with like, thank you!❤️
I am part of Trade Nation's Influencer program and receive a monthly fee for using their TradingView charts in my analysis.
DXY Long-Term Technical Outlook: Channel Structure, Pullbacks & ## **DXY (Dollar Index) Technical Analysis – 2W Chart**
### **1. Uptrend Since 2008**
The Dollar Index (DXY) has been in a **long-term uptrend** since the 2008 bottom (around 70.70). The chart shows a clear pattern of **higher highs and higher lows**, establishing a bullish market structure over the past 15+ years.
---
### **2. Ascending Channel**
The price has been moving consistently within a well-defined **ascending channel**. Several reactions from the channel boundaries are visible:
- **Support (lower trendline):** 2008, 2011, 2018, 2021, 2024
- **Resistance (upper trendline):** 2009, 2017, 2022
This suggests that the market is respecting the technical boundaries of the channel remarkably well.
---
### **3. Historical Pullbacks Within the Channel (13.5% – 15%)**
The chart highlights major **pullbacks** from local tops, all falling within the **-12.6% to -16.9%** range, showing high consistency:
| Year | Drop | % Decline |
|-------------|----------|----------------|
| 2009 | -14.76 | -16.47% |
| 2010 | -14.97 | -16.90% |
| 2017 | -15.17 | -14.61% |
| 2020 | -13.65 | -13.25% |
| 2022 | -14.90 | -12.98% |
| 2024/2025 | -13.90 | -12.61% |
This implies that **a retracement of 13–15%** from a local high is a historically "normal" correction within the ongoing uptrend.
---
### **4. EMA Analysis – 24, 120, 240** (2Y,5Y,10Y)
The chart includes three Exponential Moving Averages (EMAs), reflecting short-, medium-, and long-term trends:
- **EMA 24 (white line):** Reacts to short-term price action. Price is currently breaking below it, suggesting weakness in short-term momentum.
- **EMA 120 (red line):** Reflects the mid-term trend. Price is **right at the edge**, often acting as a **support level** in bullish markets.
- **EMA 240 (blue line):** Represents the long-term outlook. **Price has never stayed below this level for long** over the past 15 years, making this EMA a **critical support** for the long-term trend.
---
### **Conclusion & Potential Scenarios**
📉 **Bearish Scenario:**
If DXY breaks below the **EMA 240** and the **lower channel boundary**, it could indicate a **reversal of the long-term uptrend**, which hasn’t happened since 2008.
📈 **Bullish Scenario:**
If DXY holds above the **EMA 120** or bounces from the **EMA 240** and the **channel support**, we could expect a rally toward the **Fibonacci levels** (0.5 at 102.04 or 0.382 at 105.04), or even a retest of the highs around **114.78**.

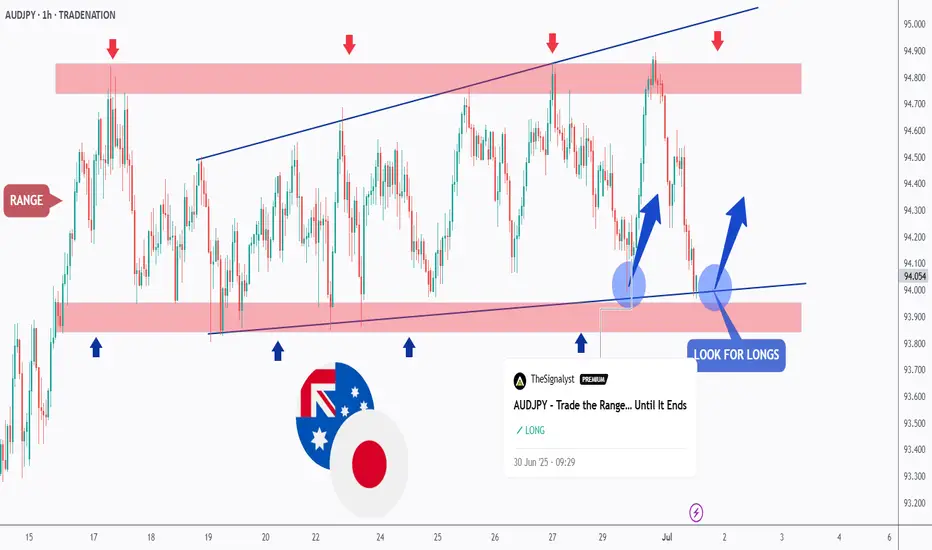
AUDJPY - let's do it again!Hello TradingView Family / Fellow Traders. This is Richard, also known as theSignalyst.
As per our last AUDJPY analysis (attached on the chart), it rejected the first blue circle zone and surged in a parabolic manner.
📈AUDJPY is currently retesting the intersection of the blue trendline and red support.
📚 As per my trading style:
As #AUDJPY is around the latest blue circle zone, I will be looking for bullish reversal setups (like a double bottom pattern, trendline break , and so on...)
📚 Always follow your trading plan regarding entry, risk management, and trade management.
Good luck!
All Strategies Are Good; If Managed Properly!
~Rich
Disclosure: I am part of Trade Nation's Influencer program and receive a monthly fee for using their TradingView charts in my analysis.
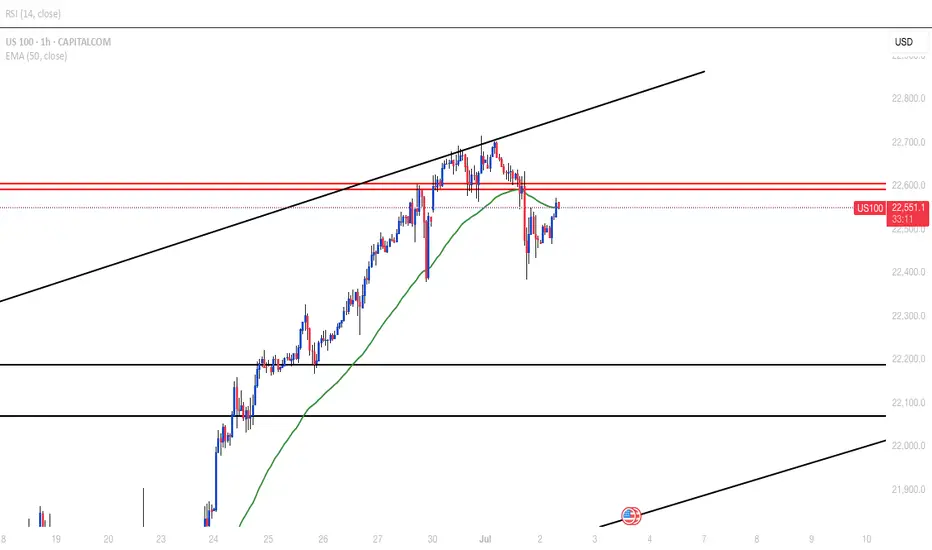
US100Price broke daily resistance last week and now looks like a retracement is on the way. H4 gave a double top at the rising channel resistance. Pulling back to retest the neckline. target is 22,200.
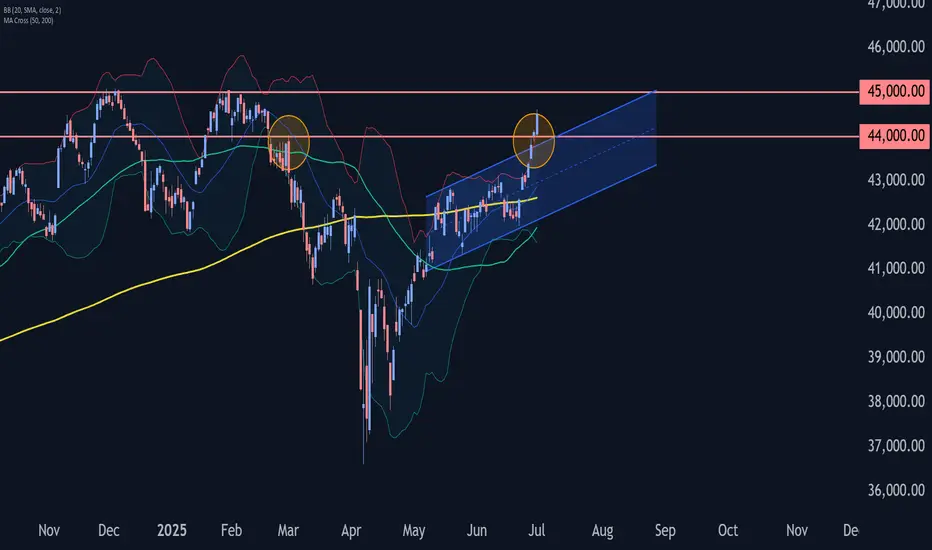
Dow Jones Wave Analysis – 1 July 2025
- Dow Jones broke the resistance zone
- Likely to rise to resistance level 45000.00
Dow Jones index recently broke the resistance zone located at the intersection of the resistance level 44000.00 (former top of wave iv from March) and the resistance trendline of the daily up channel from May.
The breakout of this resistance zone accelerated the active impulse wave (3) – which is part of the multi-month upward ABC correction 2 from April.
Dow Jones index can be expected to rise to the next resistance level 45000.00 (target price for the completion of the active impulse wave (C)).
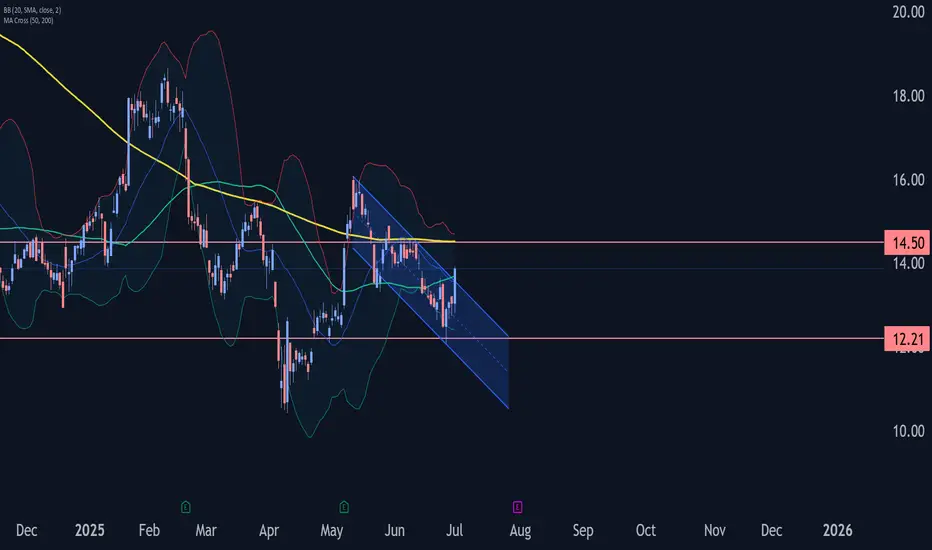
Trip Wave Analysis – 1 July 2025- Trip broke daily down channel
- Likely to rise to resistance level 14.50
Trip recently broke the resistance trendline of the daily down channel from the start of May (inside which the price has been falling in the last few weeks).
The breakout of this down channel accelerated the active short-term corrective wave (ii) – which is part of the downward impulse wave C from last month.
Trip can be expected to rise to the next resistance level 14.50 (which reversed the previous waves ii and (2) at the start of June).