Bitcoin dominance deeper viewBased on the volume trend and the chart pattern, it can potentially be down to %58.
Parallel Channel

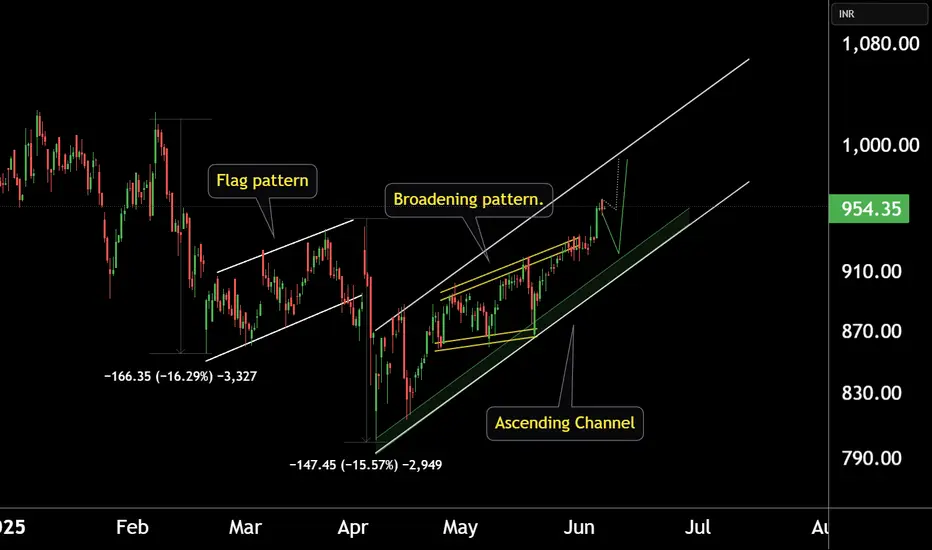
ZYDUS LIFESCIENCES AT BEST SUPPORT !!This is the 4 hour Chart of ZYDUSLIFE.
Zydus Lifesciences at good support zone near ₹920–₹930 range.
Zyduslife is moving in a Higher High and Higher Low (HH-HL) formation.
Stock has formed a broadening pattern within the channel.
If this level is sustain, we may see higher prices in ZYDUSLIFE.
THANK YOU !!
Reversal?Five waves may have been completed. BTC is bouncing off support while holding the 100k. Let's go!

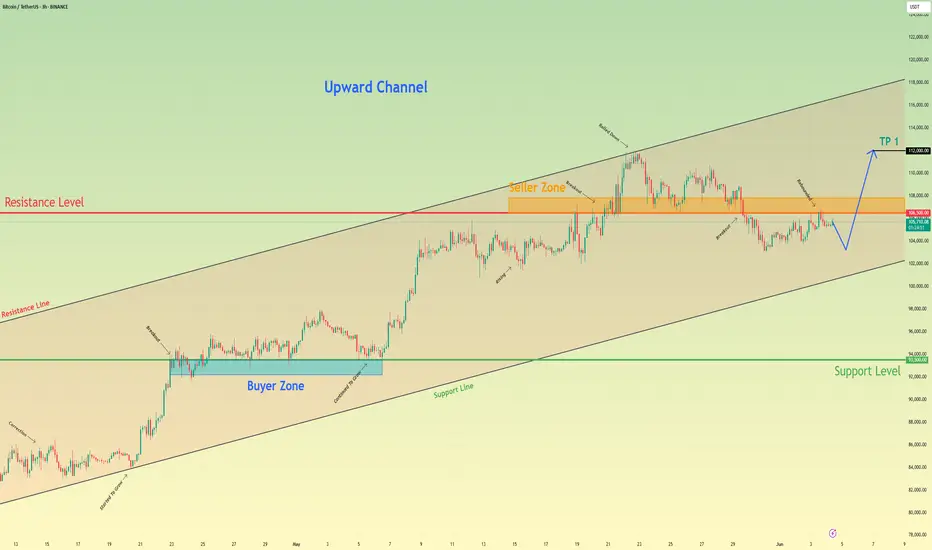
Bitcoin may break resistance level and continue to move upHello traders, I want share with you my opinion about Bitcoin. If we look at the chart, we can see how the price entered an upward channel and declined to the support line. Then it started to grow and soon reached the 93500 support level, after which it broke this level and then some time traded near. After this, the price rebounded and continued to move up inside an upward channel, where it later reached a resistance level, which coincided with the seller zone. When BTC reached this level, it broke it too and even rose to the resistance line of the channel, but soon it turned around and dropped to the seller zone. In this area, the price long time traded and later tried to grow, but failed and continued to decline. Soon, BTC broke the 106500 level and fell below the resistance level. But recently, price turned around and grew to this level again, and now trades very close. In my opinion, Bitcoin can decline a little and then break the resistance level one more time. After this movement, I expect that the price will continue to move up inside the upward channel, so I set my TP at 112000 points. Please share this idea with your friends and click Boost 🚀
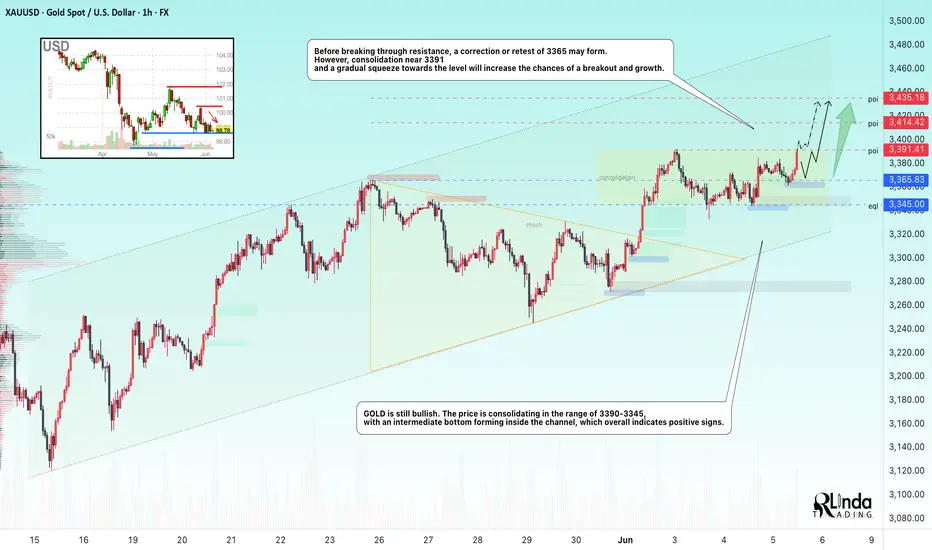
GOLD → Retesting resistance may lead to a breakoutFX:XAUUSD is still bullish. The price is consolidating in the range of 3390-3345, with an intermediate bottom forming inside the channel, which overall indicates positive signs.
On Thursday, gold is consolidating ahead of $3390. Consolidation after growth, within a bullish trend, is a good sign. But, on the one hand, the price is supported by growing tensions between Russia and Ukraine. On the other hand, optimism about US trade negotiations with Canada, the EU, and China is strengthening the dollar and holding back demand for gold.
Additional pressure on the dollar is coming from weak US macro statistics, especially ADP data and the decline in the ISM Services PMI, which have reinforced expectations of Fed policy easing. Traders are waiting for further signals from the regulator.
Resistance levels: 3391.4, 3414, 3435
Support levels: 3365, 3345
Technically, gold is rising and forming a retest of consolidation resistance. If the 3391 level is broken, the price may head towards 3435. Before breaking through resistance, a correction or retest of 3365 may form. However, consolidation near 3391 and a gradual squeeze towards the level will increase the chances of a breakout and growth.
Best regards, R. Linda!
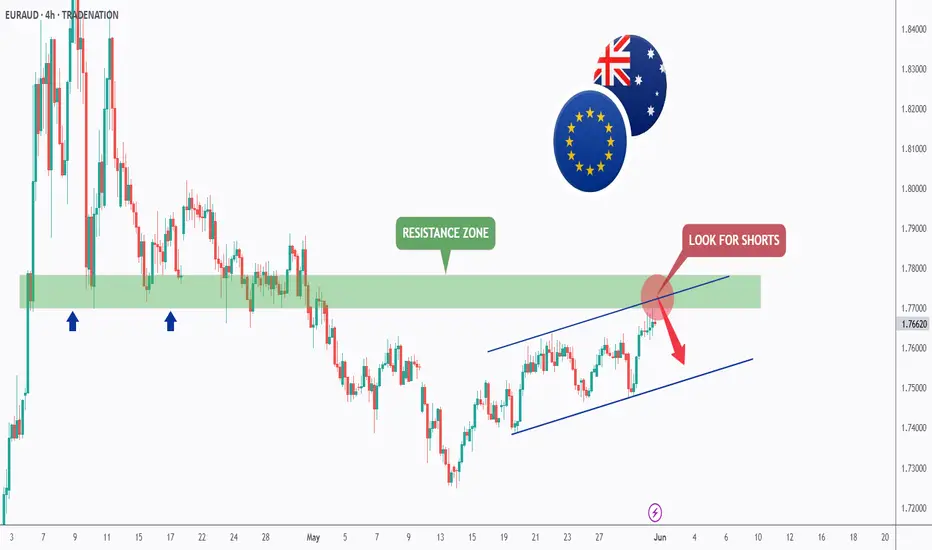
EURAUD - Bullish... but not for long!Hello TradingView Family / Fellow Traders. This is Richard, also known as theSignalyst.
📈EURAUD has been overall bullish trading within the rising channel marked in blue. However, it is currently retesting the upper bound of the channel.
Moreover, the green zone is a strong structure and resistance.
🏹 Thus, the highlighted red circle is a strong area to look for sell setups as it is the intersection of the upper blue trendline and resistance.
📚 As per my trading style:
As #EURAUD is around the red circle zone, I will be looking for bearish reversal setups (like a double top pattern, trendline break , and so on...)
📚 Always follow your trading plan regarding entry, risk management, and trade management.
Good luck!
All Strategies Are Good; If Managed Properly!
~Rich
Disclosure: I am part of Trade Nation's Influencer program and receive a monthly fee for using their TradingView charts in my analysis.
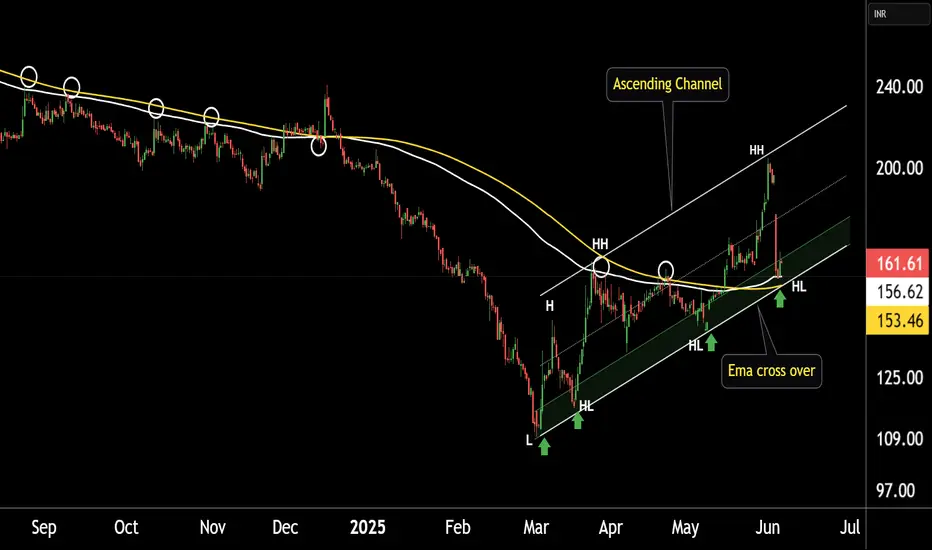
SPARC This is the 4 hour chart of SPARC.
SPARC is currently trading near the support boundary of an ascending channel at 150-155 range.
SPARC has given a positive EMA crossover at price 152-156 range
If this level sustain, we may see higher price in the SPARC.
Thank You !!
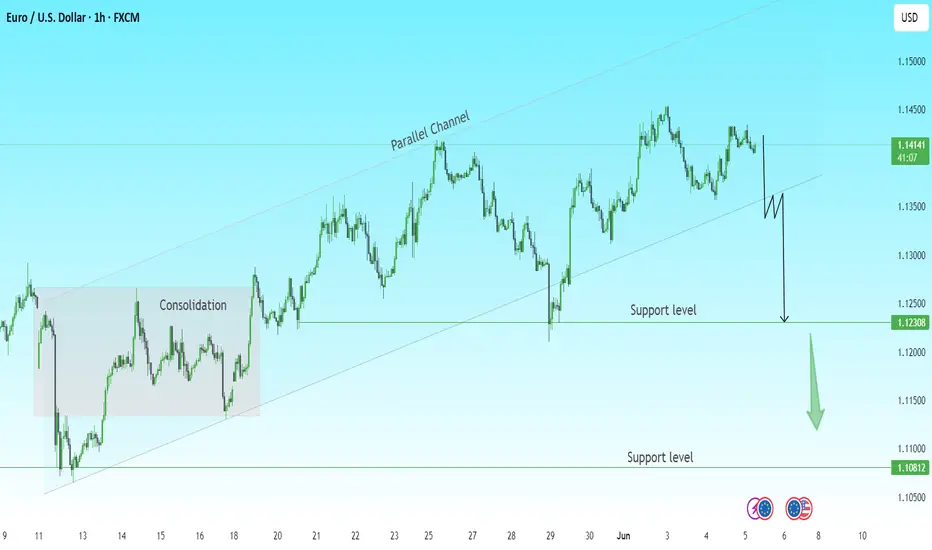
EURUSD Analysis | Potential Breakdown AheadHello Traders
The pair has been respecting a rising parallel channel after breaking out from a consolidation zone earlier this month.
🔹 Current Price: 1.1409
🔹 Trend: Uptrend within a rising channel
🔹 Key Observation: Price is testing the upper range but showing signs of weakness.
🔍 Technical Breakdown:
Price recently failed to make a new high, showing signs of exhaustion.
A break below the channel support could trigger a sharp move downward.
Two strong support levels are in focus:
1.12308 (short-term target)
1.10812 (major target)
📉 Bearish Scenario:
If we get a confirmed break below the channel, I’ll be looking for short opportunities with the first target at 1.1230, and if momentum continues, down to 1.1080.
⚠ Watch for rejection candles or a strong bearish close below the channel support to confirm the move.
💬 What’s your bias on EUR/USD? Are you trading this potential setup?
#EURUSD #Forex #TechnicalAnalysis #PriceAction #TradingView #ChartAnalysis
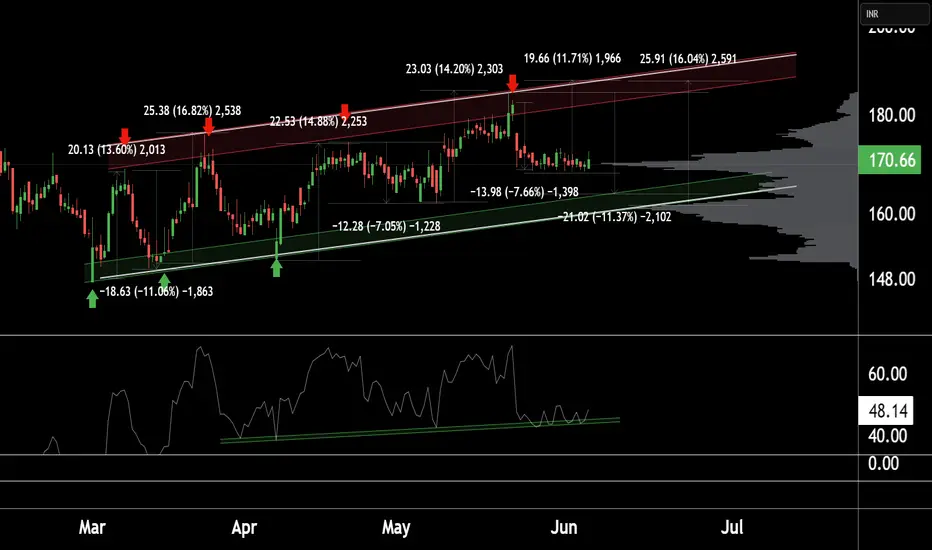
TV Today Network is currently near its key support zone.This is the 4 hour chart of TV TODAY.
Stock is trading in an ascending channel.
Post a corrective phase of 8–11%, the stock typically rebounds with a return of 11–14%, aligning with the upper and lower boundaries of the ascending channel.
VRVP is indicating two significant price levels—₹170 and ₹160—where notable volume accumulation has occurred, suggesting potential support or resistance zones at these levels.
If this level is sustain, then we may se higher prices in the Tv Today.
AAPL Ascending Price ChannelAAPL has been in ascending price channel since August 2020. At the start of April we saw a retest of support where it temporarily broke through, tested the 200 ema, bounced, then broke back above the previous support line. Since then it has retested support 3 separate times which is a strong indication that AAPL will continue to remain in this price channel for the foreseeable future.

AAPL Bounce at 200 EMA- Remains in ascending channelAAPL has been in ascending price channel since August 2020. At the end of April we saw a retest of support where it temporarily broke through, tested the 200 ema, bounced, then broke back above the previous support line. I believe AAPL will remain in this channel and price will continue to rise with an eventual retest of resistance.

EURJPY higher bearish expectations from here
OANDA:EURJPY analysis before this one, is be closed, i am note will share new analysis on EJ soon.
ASCENDING CHANNEL visible, price in zone currently, after ISM events today, we are not see break of res zone 164.250, which for me having positive imact on bearish expectations here.
Trend line is breaekd and soon exxpecting to see and break of ASCEDING CHANNEL and higher bearish fall continuation.
SUP zone: 164.250
RES zone: 161.750, 160.900

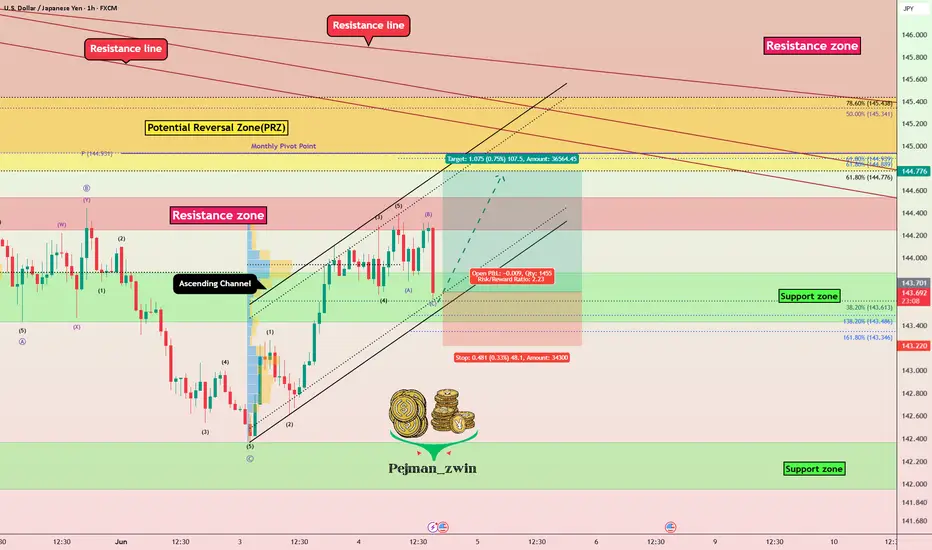
USDJPY Tests Channel Support After ADP Shock — Rebound Ahead?In the last hour's candle after the ADP Non-Farm Employment Change Index was released, USDJPY ( FX:USDJPY ) started to fall, but considering the position of this pair, I think we can have a good Risk-To-Reward even if the Stop Loss (SL) is touched.
USDJPY is trading near the lower line of the ascending channel and the Support zone(143.870 JPY-143.430 JPY) .
From an Elliott Wave perspective , USDJPY appears to be completing a corrective pattern .
I expect USDJPY to rise at least to the Potential Reversal Zone(PRZ) .
Note: Stop Loss = 143.220 JPY
Please respect each other's ideas and express them politely if you agree or disagree.
U.S. Dollar/Japanese Yen Analyze (USDJPY), 1-hour time frame.
Be sure to follow the updated ideas.
Do not forget to put a Stop loss for your positions (For every position you want to open).
Please follow your strategy and updates; this is just my Idea, and I will gladly see your ideas in this post.
Please do not forget the ✅' like '✅ button 🙏😊 & Share it with your friends; thanks, and Trade safe.
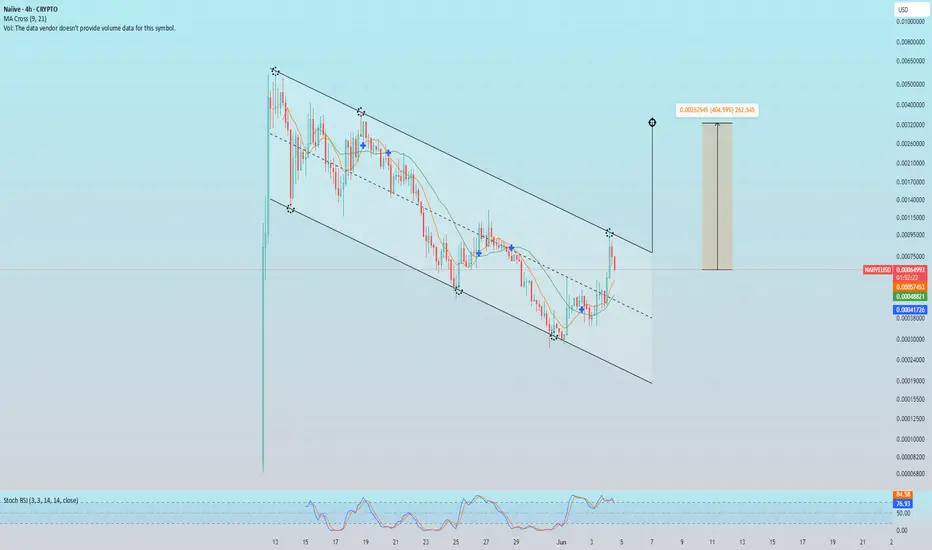
NAIIVE. Pullback before the next leg up.CTO Token in an up trend now and it seems community pretty strong and bullish. Binance Smart Chain is experiencing a surge in liquidity. Regarding TA, the price may Pullback to the moving average before trend continuation.
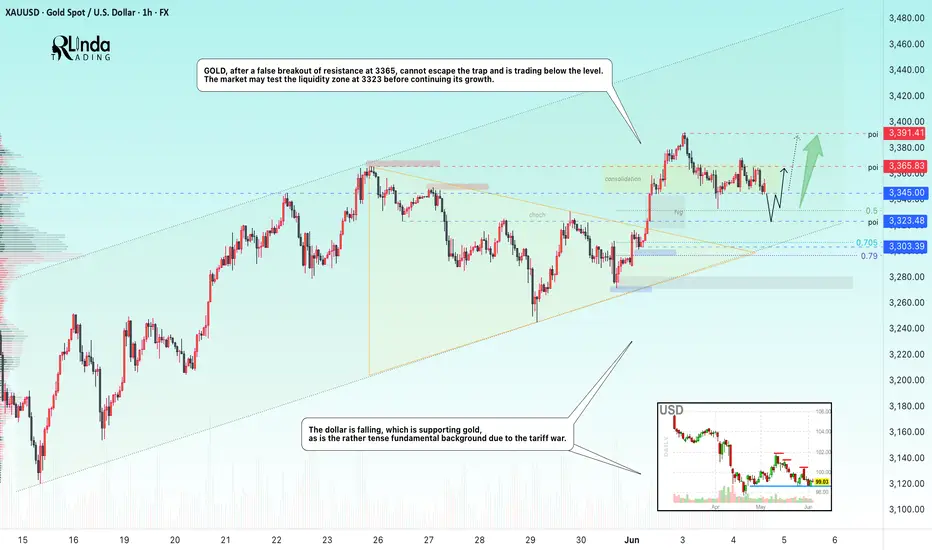
GOLD → Consolidation before a strong move...FX:XAUUSD is consolidating after a false breakout of resistance at 3365, awaiting economic data. The metal remains attractive to investors amid the economic crisis.
Gold is supported by the weakening dollar amid increased trade risks. Today, US tariffs on steel and aluminum come into force, and Trump's ultimatum to trading partners expires. Investors are also awaiting news of a possible meeting between Trump and Xi Jinping amid new accusations against China. The focus is on key employment data (ADP) and the ISM services index, which could influence the dollar and expectations for the Fed's actions.
Technically, the market may test the 3323 liquidity zone before continuing its growth.
Resistance levels: 3365, 3391
Support levels: 3345, 3323, 3303
Overall, both the global and local trends are bullish, with the price forming a local correction after a false breakout of resistance. If the bulls hold their ground above 3323-3345 after retesting support, growth may continue in the short to medium term.
Best regards, R. Linda!
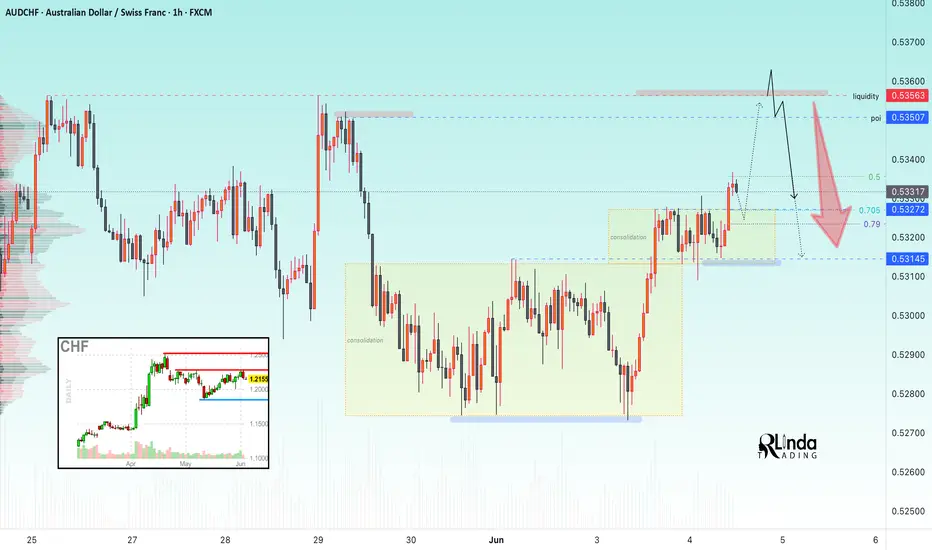
AUDCHF → Hunting for liquidity. Fall from resistanceFX:AUDCHF is emerging from local consolidation and entering a distribution phase. Potentially, against the backdrop of a downtrend, the market may be interested in the liquidity zone at 0.5356
Globally, we have a strong downtrend and a countertrend correction that is facing pressure in the 0.545 zone. The decline is resuming, but at some point the market formed an EQH liquidity pool at 0.5356, which is most likely acting as a magnet pulling the price towards it...
Based on the technical situation, we can conclude that if the price continues to form a distribution towards the target, the market is quite capable of stopping the price and returning to the downtrend phase.
Resistance levels: 0.535, 0.5356
Support levels: 0.5327, 0.5314
Thus, a breakout of the resistance level of 0.5356 without the possibility of continuing growth and a return of the price below the resistance level with subsequent price consolidation in the sales zone (below 0.5356) may trigger a resumption of the downward trend.
Best regards, R. Lind
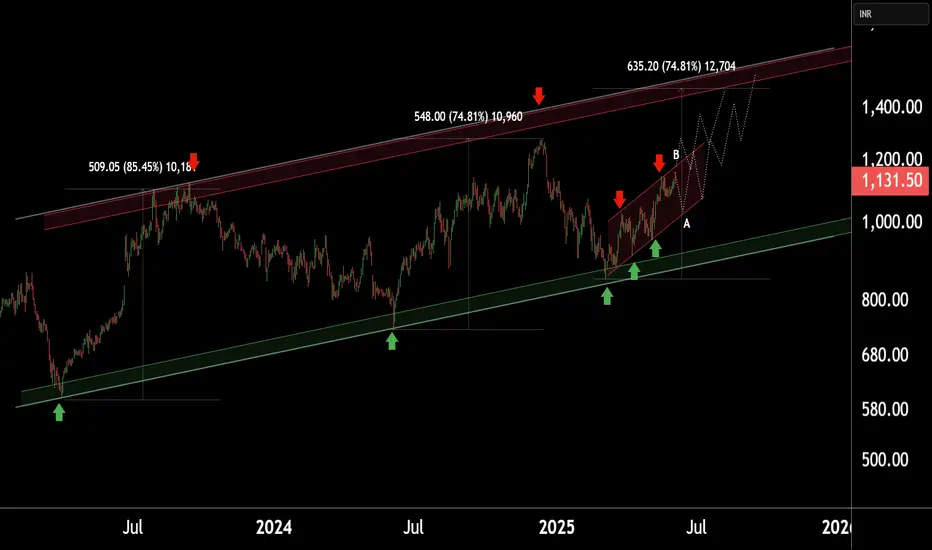
PIRAMAL ENTERPRISES LTDThis is the Weekly Chart of PEL !!
PEl is moving in an Ascending Channel pattern on the weekly chart.
PEL is following a HH–HL structure in the channel in Daily chart support at 1040-1050 range, confirming a bullish trend continuation.
Based on historical price behavior, the stock has
previously delivered a 74% return from its swing low, reaching the 1500–1520 range.
Thank You!!
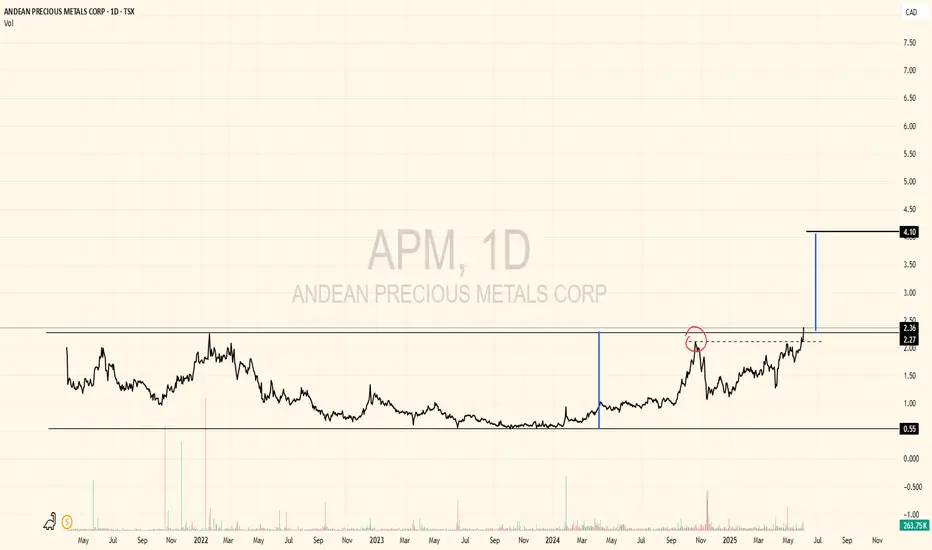
Measured-move target $4?After a massive base like this, and the macro lining up positively for this name, I think an initial $4 target as a result of the huge inverted head and shoulders is very likely.
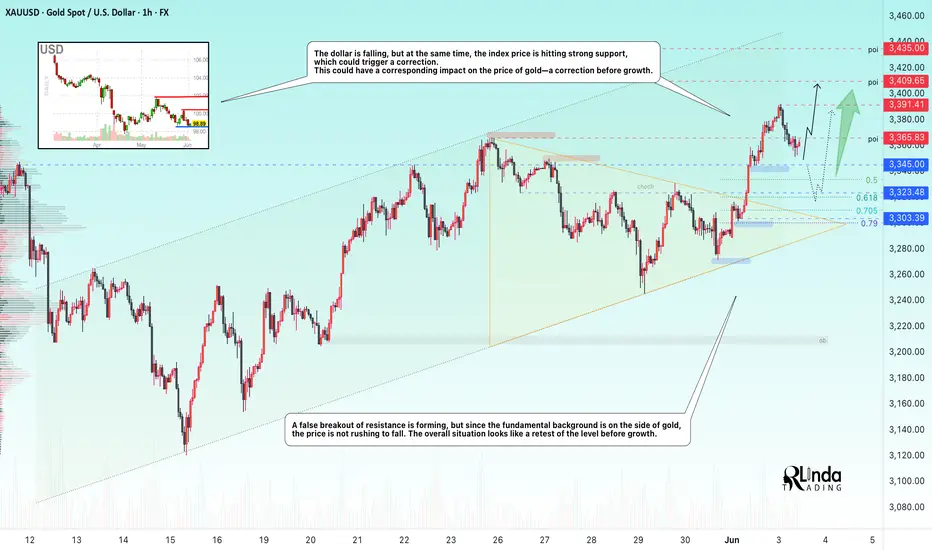
GOLD → Correction to liquidity before growthFX:XAUUSD is in the realization phase after exiting the “symmetrical triangle” consolidation. The price is supported by the trend and a complex fundamental background.
Gold is retreating from its peak, remaining below risk support. The price of gold is falling moderately from $3,392, awaiting data on JOLTS job openings in the US.
Gold is supported by trade and geopolitical risks: Trump doubled tariffs on metals, increasing pressure on the dollar. The conflict with China has escalated due to allegations of violations of agreements.
Focus on US employment: Strong data could support the dollar and limit gold's gains, but the technical picture remains bullish.
Resistance levels: 3365, 3391, 3409
Support levels: 3345, 3323
Against the backdrop of a rising dollar, gold may test deeper liquidity zones, such as 3345 and 3330. However, if trading forms between 3365 and 3345, followed by a retest of resistance and consolidation above 3365, this could trigger an early rise to 3391-3409.
Best regards, R. Linda!
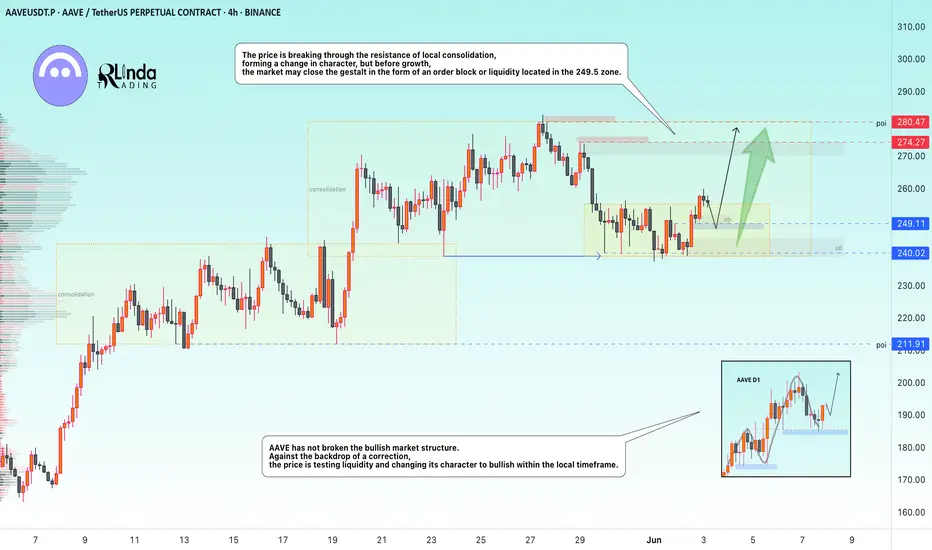
AAVEUSDT → A false breakdown provokes a change of characterBINANCE:AAVEUSDT.P maintains a bullish market structure. The coin is consolidating, with bulls trying to hold their ground above the key support line.
Against the backdrop of a correction, the price is testing liquidity, with a false breakdown of support provoking a change in character to bullish within the local timeframe. Bulls are trying to maintain the bullish structure.
The price is breaking through the resistance of local consolidation, forming a change in character, but before growth, the market may close the gestalt in the form of an order block or liquidity located in the 249.5 zone.
Support levels: 249.11, 240.0
Resistance levels: 274.27, 280.47
Technically, the coin looks quite good and promising overall. If the bulls hold their ground in the 249-250 zone, then in the short to medium term, we could see good movement with the possibility of new highs...
Best regards, R. Linda!
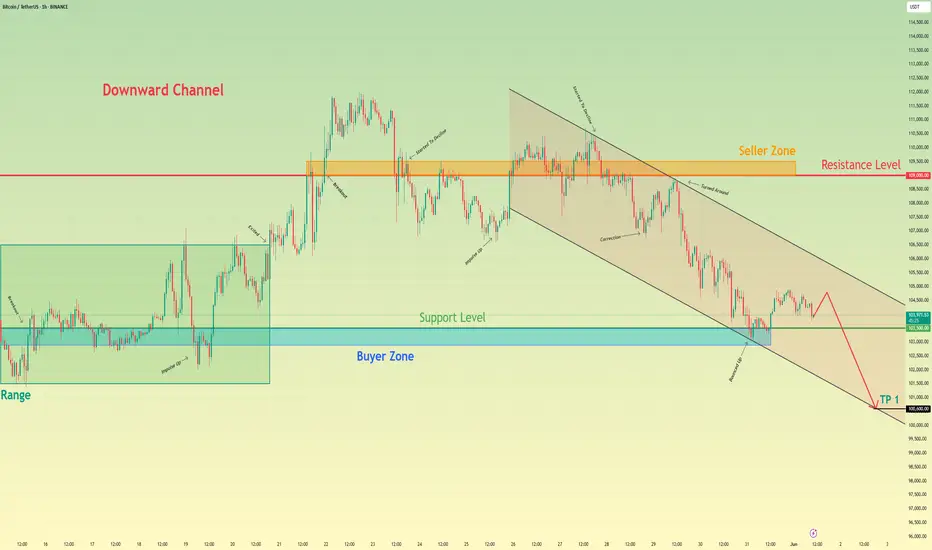
Bitcoin may break support level and continue to fall in channelHello traders, I want share with you my opinion about Bitcoin. Previously, price was moving inside a horizontal range, consolidating between resistance and the buyer zone near 103500 - 102900. The market lacked clear direction, and price repeatedly rebounded within this structure, failing to build strong momentum either way. Eventually, BTC exited the range and began forming a downward channel. This shift introduced a clear bearish bias, with each high being lower than the previous one. Price action started respecting the descending resistance and support lines, confirming the structure. Sellers consistently stepped in from the seller zone near 109000 - 109500, pushing the price downward with each retest. Currently, BTC is hovering around the support level at 103500 points, showing short-term weakness. The latest reaction from this area didn’t generate significant bullish follow-through. In my view, BTC is likely to break through this support and continue falling inside the channel. That’s why I’ve placed my TP at 100600 points, which matches the support line of the channel and offers a logical downside target. Please share this idea with your friends and click Boost 🚀
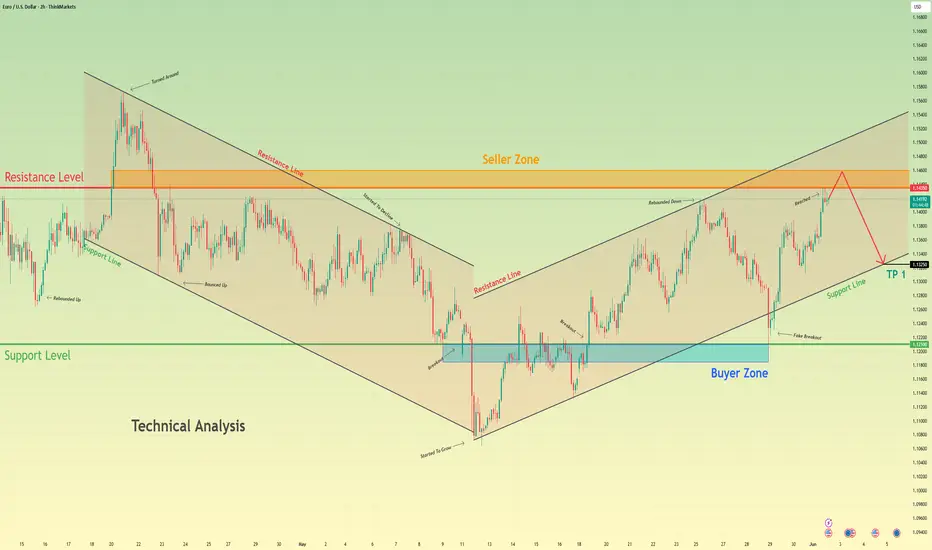
Euro will rise to seller zone and then drop to support lineHello traders, I want share with you my opinion about Euro. At first, price was moving inside a downward channel, forming lower highs and lower lows. Each rejection from the resistance line pushed the price lower, and the structure remained bearish until the price reached the buyer zone near 1.1210 - 1.1185 points. A strong rebound from this area triggered a breakout from the channel, signaling a shift in market dynamics. After this breakout, the trend reversed and price started forming an upward channel, with clean impulses and structured corrections. Bulls began stepping in from higher support levels, and the market started respecting the new rising support and resistance lines. Now the price is approaching the seller zone at 1.1435 - 1.1460 points and has already shown signs of rejection from that area. Given this setup, I believe EURUSD may start to decline and fall back toward the support line of the upward channel. That’s why I’ve placed my TP at 1.1325 points, which aligns with the channel's support structure. Please share this idea with your friends and click Boost 🚀
Disclaimer: As part of ThinkMarkets’ Influencer Program, I am sponsored to share and publish their charts in my analysis.
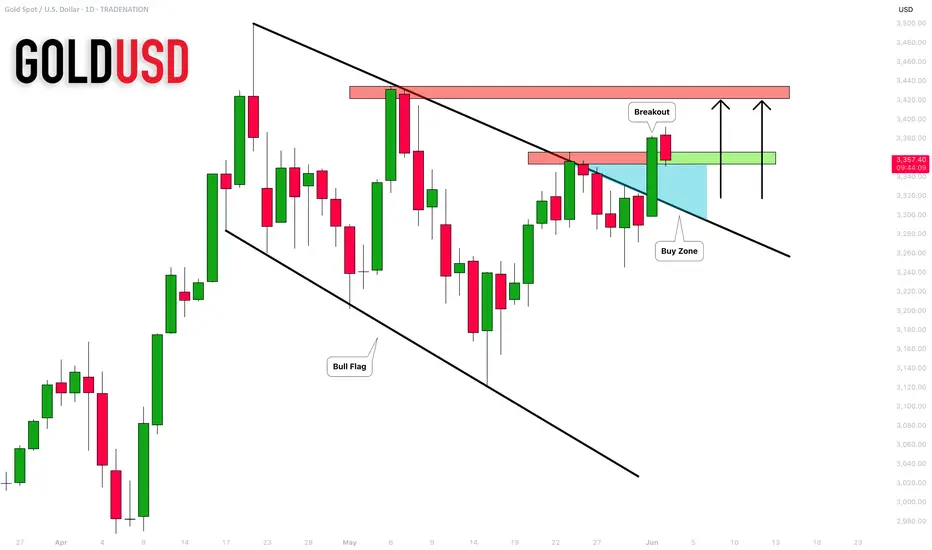
GOLD (XAUUSD): Bullish Continuation Confirmed
As we discussed yesterday, Gold managed to break and close above
a resistance line of a bullish flag pattern on a daily.
It opens a potential for more growth.
Our next resistance is 3429.
For buying, consider the expanding demand zone based
on a broken horizontal resistance and a trend line.
❤️Please, support my work with like, thank you!❤️
I am part of Trade Nation's Influencer program and receive a monthly fee for using their TradingView charts in my analysis.