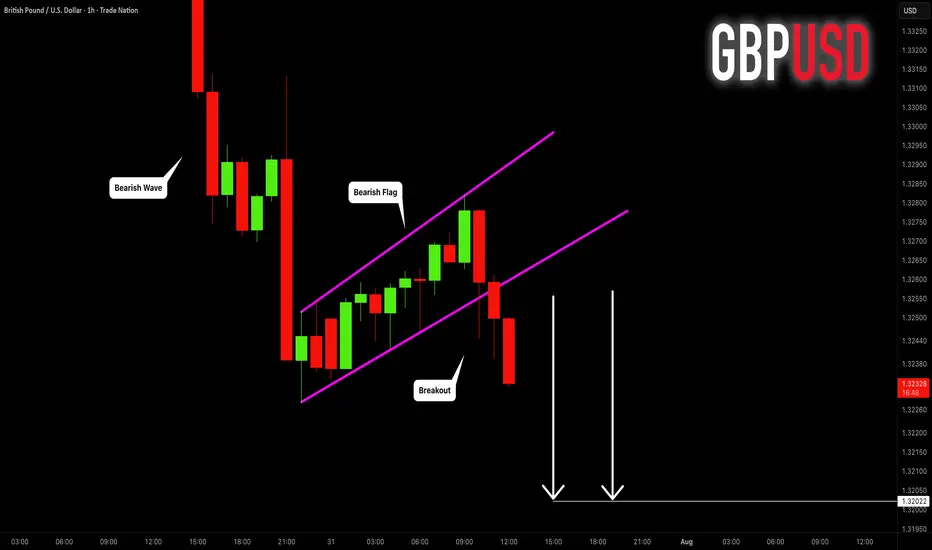
GBPUSD: Strong Trend-Following Pattern 🇬🇧🇺🇸
GBPUSD is going to drop lower.
The market has completed a correctional movement within
a bearish flag.
Its support violation provides a strong bearish confirmation.
I expect a drop to 1.3202 level.
❤️Please, support my work with like, thank you!❤️
I am part of Trade Nation's Influencer program and receive a monthly fee for using their TradingView charts in my analysis.
Parallel Channel
Potential Long Scalp Trade for BTCBitcoinUSD is testing support at $116,400. Depending on this 1HR close, we could have a long trade scalp opportunity for it to reach PoC @ $118,000 to test resistance there. Stop loss would be set below wick @ $115,700. Open Interest for shorts and longs has gone up at this candle. If support holds, shorts will be underwater and liquidation will push prices up.

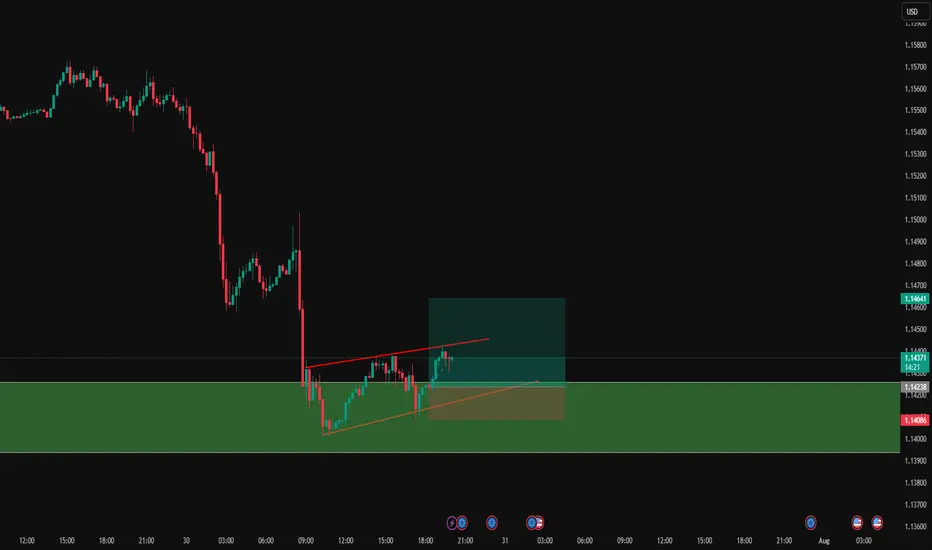
EURUSD Bullish ReversalI am currently in a bullish trade on EURUSD. We are on a weekly support after we have made a far heavy drop, I am expecting this pattern formation to be what triggers a bounce on this support level. I am targeting the most recent level.
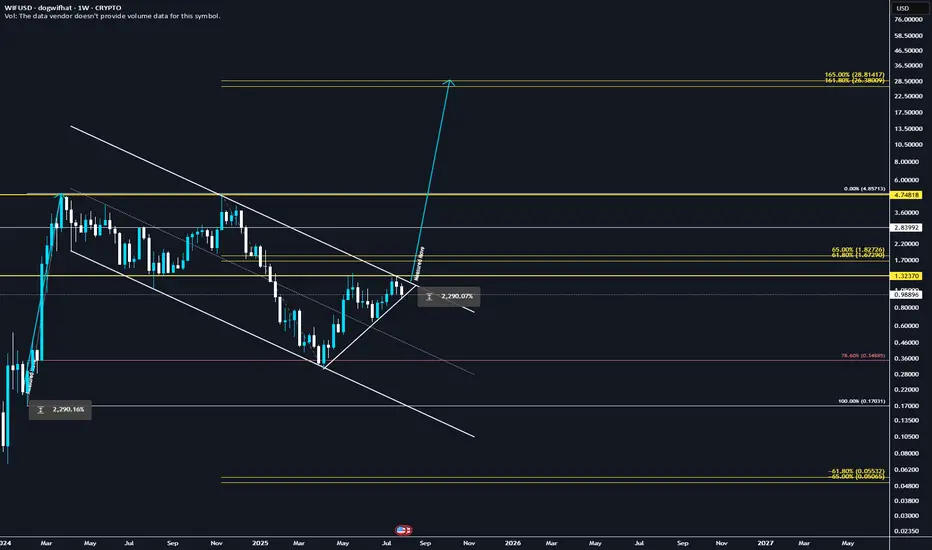
They're lying! WIF will explode to 28.8$ ✅ Golden Pocket Extension: $28.80 aligns with the 1.618–1.65 fib extension (golden pocket zone) from the last major impulse.
✅ Measured Move: Breakout from the prior downward consolidation projects to ~$28.80 when using the height of the range added to the breakout point.
✅ Confluence = High Probability: Both fib extension and measured move target the same zone, increasing confidence.
✅ Momentum + Meme Rotation: If broader meme coin rotation continues, WIF has narrative + volatility fuel.
BITCOIN → Correction within a downward channel. 112K or 125K?BINANCE:BTCUSDT is consolidating. However, a local downward trading range is forming relative to the current setup. What is the probability of a correction continuing to 112K or growth to 125K?
Daily structure: a local correctional channel within a global bullish trend. We have cascading resistance at 119.2, 119.6, 120, and 120.8. It will be quite difficult to break through this zone on the first attempt, but MM can use it to form traps and collect liquidity.
At the bottom, everything is simpler — a breakdown of the local bullish structure, the formation of an intermediate minimum, below which there is a void down to 112K.
Yesterday, relative to 115-116K, mm staged a massacre (trap) on both sides of the market.
Liquidity collection, return to the range, and growth. The reaction to the false breakdown of support is quite strong. Since the opening of the session, Bitcoin has been heading towards resistance, but there may not be enough potential to break through the upper resistance conglomerate, so I expect to see a pullback or decline to 116-115-114.
Resistance levels: 119.2, 120.1, 120.85
Support levels: 116.37, 115.67, 112
Technically and fundamentally, I do not see any drivers that could support the market (I am talking about Bitcoin, since the driver for altcoins is the decline in Bitcoin's dominance). It is possible that this may appear later. In the current situation, I am considering a false breakout and correction, as the market has not yet finished consolidating or correcting, and the current downward trading range may be extended.
PS: As the price moves towards resistance, it is necessary to monitor the reaction. The market itself will show what it is preparing for...
Best regards, R. Linda!

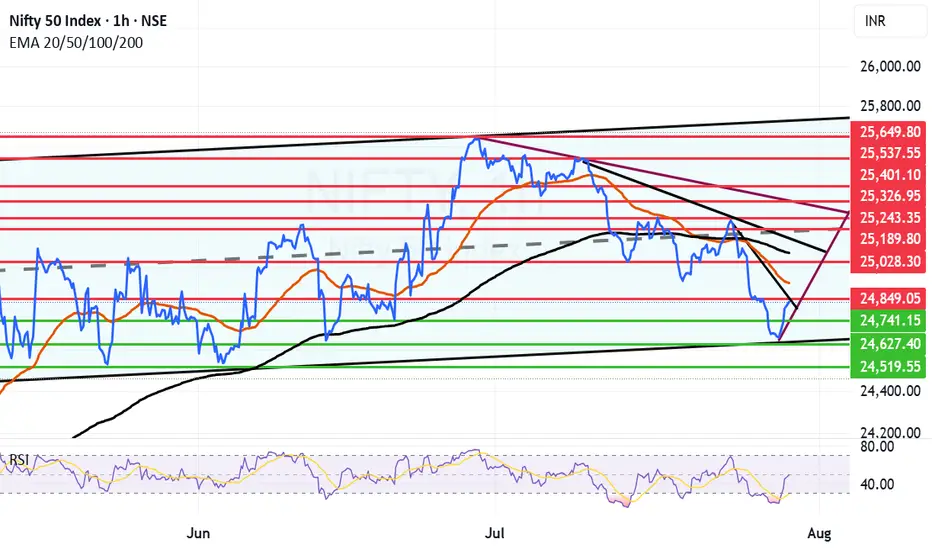
Good turnaround by market as expected from the channel bottom.We had given a message that the market was nearing the bottom and there can be a turnaround sooner than later and market turned around today. This bounce can be currently seen as a technical bounce but it can become a full fledged fightback by bulls if it crosses key resistance levels of Mother line, Father line and Mid-channel resistance. These are the 3 key resistances in front of us currently. All eyes on the important trade deal announcements and with US and China which are on going any news on that from can disrupt the market proceedings in either way. Support and resistance levels for Nifty are as under:
Key Nifty Resistances: 24849 (Trend line resistance), 24922 (Motherline Resistance of hourly chart), 25028, 25070 (Father line resistance), 25189 (Mid-channel resistance), 25243 (Very important resistance for Bulls to conquer). Above 25243 Bulls can gain control of Nifty.
Key Support levels: 25741, 25627 (Channel bottom Support), 24519.
Disclaimer: The above information is provided for educational purpose, analysis and paper trading only. Please don't treat this as a buy or sell recommendation for the stock or index. The Techno-Funda analysis is based on data that is more than 3 months old. Supports and Resistances are determined by historic past peaks and Valley in the chart. Many other indicators and patterns like EMA, RSI, MACD, Volumes, Fibonacci, parallel channel etc. use historic data which is 3 months or older cyclical points. There is no guarantee they will work in future as markets are highly volatile and swings in prices are also due to macro and micro factors based on actions taken by the company as well as region and global events. Equity investment is subject to risks. I or my clients or family members might have positions in the stocks that we mention in our educational posts. We will not be responsible for any Profit or loss that may occur due to any financial decision taken based on any data provided in this message. Do consult your investment advisor before taking any financial decisions. Stop losses should be an important part of any investment in equity.
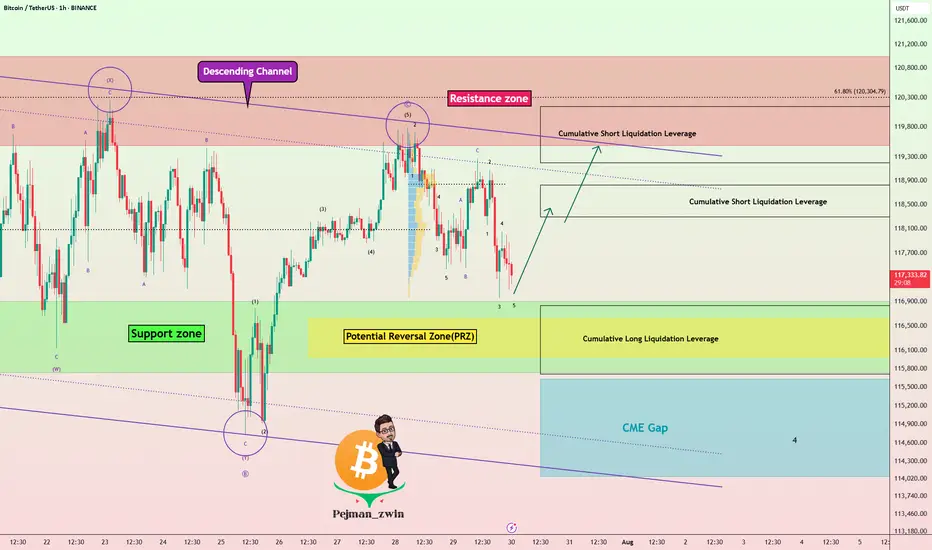
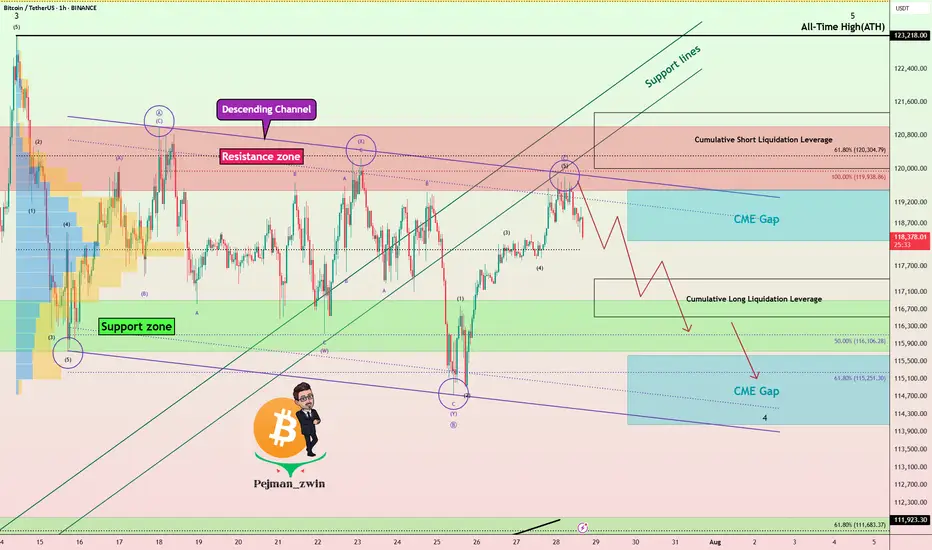
White House Crypto Report Incoming: Will BTC Pump from Support? One of the important news for Bitcoin ( BINANCE:BTCUSDT ) that was released today was that " White House confirms first Bitcoin and crypto report will be released TOMORROW ". Bitcoin is likely to rise with the release of the White House report .
What do you think? At least a temporary pump may be in store for Bitcoin.
Bitcoin fell to the Support zone($116,900-$115,730) and filled the New CME Gap( $119,500-$118,295) as I expected in the previous idea .
Bitcoin is currently moving near the Support zone($116,900-$115,730) , Cumulative Long Liquidation Leverage($116,828-$115,710) and Potential Reversal Zone(PRZ) .
I expect Bitcoin to rise from the Support zone($116,900-$115,730) to at least $118,680(First Taregt) .
Second target: Upper line of the descending channel
Note: Stop Loss: $114,680 = Worst Stop Loss(SL)
CME Gap: $115,060-$114,947
Cumulative Short Liquidation Leverage: $118,827-$118,298
Cumulative Short Liquidation Leverage: $120,144-$119,200
Please respect each other's ideas and express them politely if you agree or disagree.
Bitcoin Analyze (BTCUSDT), 1-hour time frame.
Be sure to follow the updated ideas.
Do not forget to put a Stop loss for your positions (For every position you want to open).
Please follow your strategy and updates; this is just my Idea, and I will gladly see your ideas in this post.
Please do not forget the ✅' like '✅ button 🙏😊 & Share it with your friends; thanks, and Trade safe.
GOLD → False breakdown 3310. Consolidation ahead of news...FX:XAUUSD is forming a false breakdown of support at 3310, thereby confirming the boundaries of the trading range. The dollar is testing strong resistance within the global downtrend. And in the near future, we can expect more economic news...
Gold is trading below the key resistance level of $3345, remaining in a narrow range ahead of the Fed's decision and US GDP data for Q2. Weak data could reinforce expectations of a rate cut and support gold, while strong data would strengthen the dollar. The Fed is likely to keep rates at 4.25–4.5%, with markets pricing in a 64% chance of a 25 bps cut in September. Investors are waiting for signals from Jerome Powell, with a possible split within the Fed: some members may support calls for easing, which would be a driver for gold.
Technically, the situation on D1 is quite interesting. Gold is still below the previously broken trend resistance, but there is no continuation of the momentum. Buyers are reacting to support at 3310, but the market is stagnating due to uncertainty ahead of the news...
Resistance levels: 3345, 3375
Support levels: 3320, 3310, 3287
Thus, from a technical analysis perspective, I expect a retest of 3345, followed by a pullback to support at 3320, from which gold could move higher (if the bulls take the initiative), but if 3320 breaks and 3310 comes under pressure, gold could test 3287. Again, the emphasis is on trend support (the upward line) in the 3335-33450 zone. If the price can consolidate in this zone, we will have confirmation that the price has returned to the boundaries of the upward trend.
Best regards, R. Linda!

Gold Next Move Possible Hello Traders, Today I’m back with another idea.
As you know gold has changed the trend from bullish to the bearish.
The gold has fallen from the area 3438 to 3351. Now the current price is 3358.
I’m looking for the sell zone, In my view gold will drop till 3310.
I’m monitoring the sell zone 3364-3371, when the market touches the zone, I will add sell and my target will be 3310. Keep in bear my first target is 3351, second target is 3337 and the last target is 3310.
In the case if price breaks the 3377 area then we will have to wait until confirmation for another setup.
Stay Tune for every update.
Kindly share your ideas and leave positive comments. Thanks Everybody.

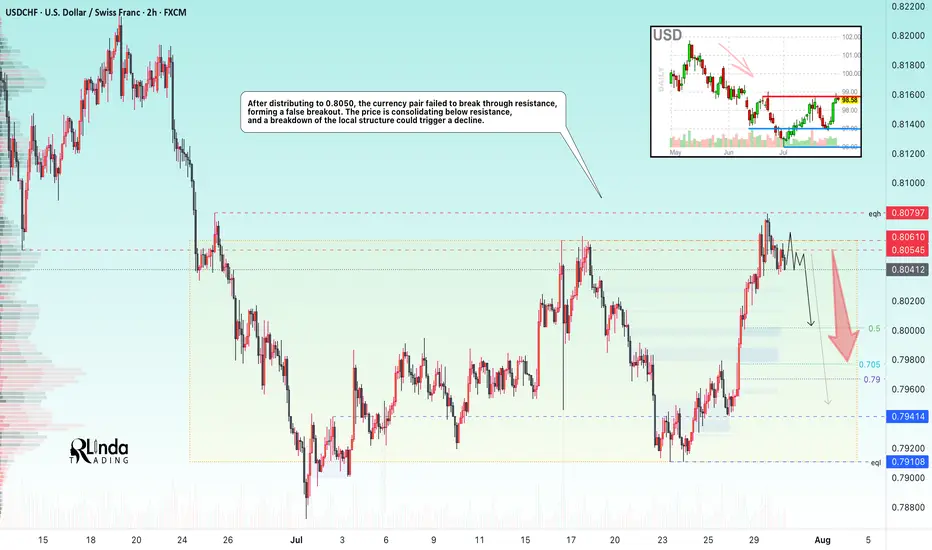
USDCHF → The resistance retest ended with a false breakoutFX:USDCHF tested resistance at 0.805 - 0.806 and formed a false breakout without the possibility of continuing growth. The global trend is downward...
Against the backdrop of the dollar's growth (reaction to news), the currency pair also moved to distribution to 0.8050. The price failed to break through resistance, forming a false breakout. USDCHF is consolidating below resistance, and a breakdown of the local structure could trigger a decline.
The dollar index is also facing fairly strong resistance and may continue its downward trend, which will also affect the decline in the USDCHF price.
Resistance levels: 0.805, 0.806, 0.81
Support levels: 0.800, 0.794, 0.791
If, within the current consolidation, the price begins to fall and break the local structure, then we can expect the decline to continue towards the specified targets!
Best regards, R. Linda!
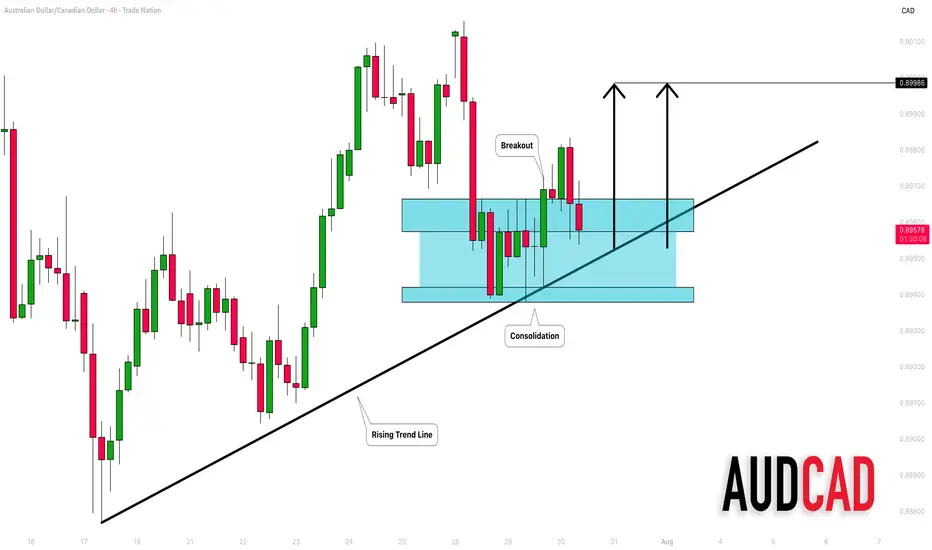
AUDCAD: Bullish Move From Trend Line 🇦🇺🇨🇦
AUDCAD may bounce from a solid rising trend line on a 4H.
The price started to consolidate on that after its test.
A breakout of a minor horizontal resistance is a strong bullish confirmation.
Goal - 0.8999
❤️Please, support my work with like, thank you!❤️
I am part of Trade Nation's Influencer program and receive a monthly fee for using their TradingView charts in my analysis.
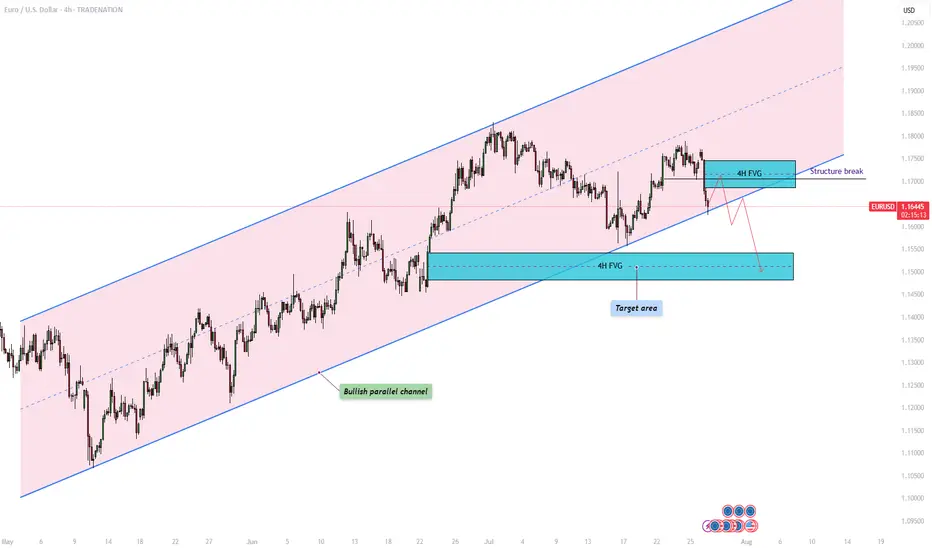
EURUSD – Will the bullish parallel channel hold?The EUR/USD currency pair is currently trading within a clearly defined bullish parallel channel, as shown on the 4-hour chart. This channel has provided consistent directional structure over recent weeks, with price respecting both its upper resistance and lower support boundaries. At present, the pair is approaching the lower end of this channel, raising the critical question: will it bounce off support and continue the bullish trajectory, or will it decisively break down, opening the door to lower price targets?
Bullish parallel channel
On the 4-hour timeframe, the EUR/USD has been consistently moving within a bullish parallel channel, characterized by higher highs and higher lows. This price structure suggests sustained upward momentum, with the top of the channel acting as dynamic resistance and the bottom as reliable support. Today, price action is testing the lower boundary of the channel once again. A successful hold at this level could confirm continued bullish structure and open the door for a potential rebound.
Bullish scenario
In the bullish scenario, the EUR/USD holds its ground at the support region around 1.164, where the lower boundary of the channel intersects with price. For upward continuation, it must overcome the short-term resistance posed by the 4-hour Fair Value Gap (FVG) between 1.169 and 1.174. A reclaim and close above this zone could signal a shift in short-term momentum and lead to a move back toward the upper boundary of the channel. However, the path upward is not without resistance , price must navigate through potential supply zones and maintain higher lows to preserve the bullish structure.
Bearish scenario
On the other hand, a break and close below the channel support could indicate a change in market sentiment and invalidate the bullish pattern. In this bearish case, we would expect a structure break confirmation followed by a possible retest of the broken trendline and the 4-hour FVG. If this retest fails to reclaim the trendline, bearish continuation becomes more likely. The next significant area of interest lies around the 1.150 level, where a bullish 4-hour FVG exists. This zone could act as a potential short-term support and serve as a target for the downside move before any meaningful bounce occurs.
Final thoughts
The EUR/USD pair is currently at a technical crossroads. Traders should watch closely for price behavior around the lower channel boundary to determine whether bullish momentum will resume or whether a bearish breakout will set the tone for deeper retracement. Confirmation, either through a bounce or a breakdown with a retest, will be key in validating the next directional move.
-------------------------
Disclosure: I am part of Trade Nation's Influencer program and receive a monthly fee for using their TradingView charts in my analysis.
Thanks for your support. If you enjoyed this analysis, make sure to follow me so you don't miss the next one. And if you found it helpful, feel free to drop a like 👍 and leave a comment 💬, I’d love to hear your thoughts!
Oil surges on Russia sanction threats but long-term risks remainOil prices have climbed around 6% this week, driven by two key developments: a trade deal between the EU and the US, and Donald Trump’s warning that the US may impose sanctions on Russian oil buyers within 10 days unless progress is made toward ending the Russia-Ukraine war.
Russia accounts for about 10.5% of global oil production. Major buyers like China and India, which take 47% and 38% of Russia’s crude exports respectively, are still negotiating their trade deals with the US. That gives Washington leverage to pressure them into cutting back without fully banning imports, which would risk triggering a much sharper price surge.
If China, India, the EU, and Turkey shift away from Russian oil, demand would rise elsewhere, supporting prices. Still, while the short-term technical picture remains bullish above 67.28, prices face resistance between 75.43 and 77.80. This range marks the upper bound of a multi-year downward channel.
OPEC+ also meets this weekend. The group has been increasing production to align with Trump’s promise to lower oil prices, a move that weighs on the long-term outlook. Add to that the impact of new tariffs—15% on EU and Japan exports, 10% on UK goods, and likely more to come for China and India—and global GDP growth could slow, further capping oil’s upside.
Unless prices break convincingly above 77.80, the broader trend remains bearish.
This content is not directed to residents of the EU or UK. Any opinions, news, research, analyses, prices or other information contained on this website is provided as general market commentary and does not constitute investment advice. ThinkMarkets will not accept liability for any loss or damage including, without limitation, to any loss of profit which may arise directly or indirectly from use of or reliance on such information.

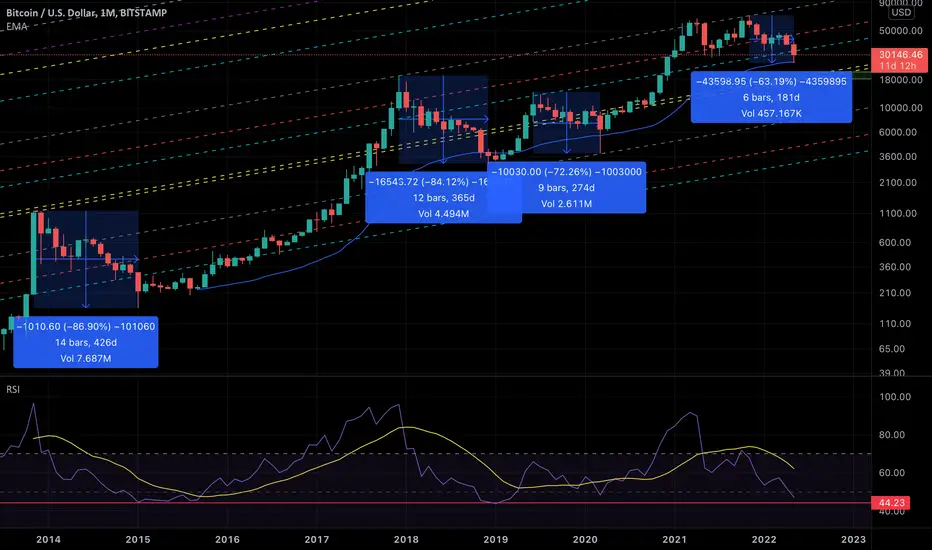
Where exactly is the most probable bottom of BTC for this cycle?This is the analysis based on the following data points
1. Monthly historical price action
2. Monthly Fibonacci Channel
3. Monthly Fibonacci Extension
4. EMA50 (Monthly)
5. RSI
We have been analyzing long term BTC price movements accurately since December 2021. Now that BTC is in sideway again, we are going to analyze the possible next moves. To be honest, current market is the hardest to analyze for us. There are mixed signals on the chart. We will try to provide as much information and perspectives as we can.
We will start with the Fibonacci extension which we have drawn based on monthly swing high/low. And zoomed in as a daily chart. Below you can see that the price bounced back exactly at 0.618 line of the fib extension. If you look at the Monthly chart above, it just touched monthly 50EMA line that day too. Coincidence? If we hit that golden pocket again and restart the bull run again, I won’t be surprised.
However, there is still a chance that we will go down further.
Let’s look at the monthly chart above for that assumption.
If we look at 2014/2015, 2017/2018, and 2019/2020 price actions, we are very near our maximum pain level. We are already in 6 months with -63% from the top. It also aligned with what we have suggested in our RSI based analysis here .
If we combine that two data points with the fib channel, we conclude that the area of fib channel golden pocket should be the bottom for this cycle. It will be -73% from the top. RSI monthly will also hit the bottom line.
One thing to note is that if we are going to break below that golden pocket, we will be looking at one of the worst bear market in the history.
Good luck.
Bitcoin Rejected Near $120K – Bears Wake Up!First of all, I have to say that Bitcoin’s movements over the last 12 days have been a bit difficult to trade , generally, the hardest market to make a profit in is the range market with a swing movement .
Bitcoin( BINANCE:BTCUSDT ) is currently trading near the Resistance zone($121,000-$119,500) , Cumulative Short Liquidation Leverage($121,336-$120,000) , and the upper line of the descending channel .
Since Bitcoin has lost support lines , we can consider this increase in Bitcoin over the last two days as a pullback to the support lines(broken) . Do you agree with me!?
In terms of Elliott Wave theory , it appears that Bitcoin is still completing the main wave B. The main wave B is a Regular Flat(ABC/3-3-5) . The structure of the microwave B of the main wave B was a Double Three Correction(WXY) .
Additionally, the SPX 500 index ( SP:SPX ), which Bitcoin is correlated with , is poised for a correction in my opinion, which could also impact Bitcoin .
Also, unlike previous Mondays, MicroStrategy has NOT purchased Bitcoin , and the company currently holds 607,770 BTC .
Old Bitcoin wallets also seem to be waking up to the fact that they can create movements in the crypto market . " In recent days, 471,867.8 BTC worth $56.39 million have been transferred from old wallets from 2012 to 2017 . ".
I expect Bitcoin to decline to at least the Support zone($116,900-$115,730) and fill the CME Gaps in the coming hours .
New CME Gap: $119,500-$118,295
CME Gap: $115,060-$114,947
Cumulative Long Liquidation Leverage: $117,401-$116,615
Please respect each other's ideas and express them politely if you agree or disagree.
Bitcoin Analyze (BTCUSDT), 1-hour time frame.
Be sure to follow the updated ideas.
Do not forget to put a Stop loss for your positions (For every position you want to open).
Please follow your strategy and updates; this is just my Idea, and I will gladly see your ideas in this post.
Please do not forget the ✅' like '✅ button 🙏😊 & Share it with your friends; thanks, and Trade safe.
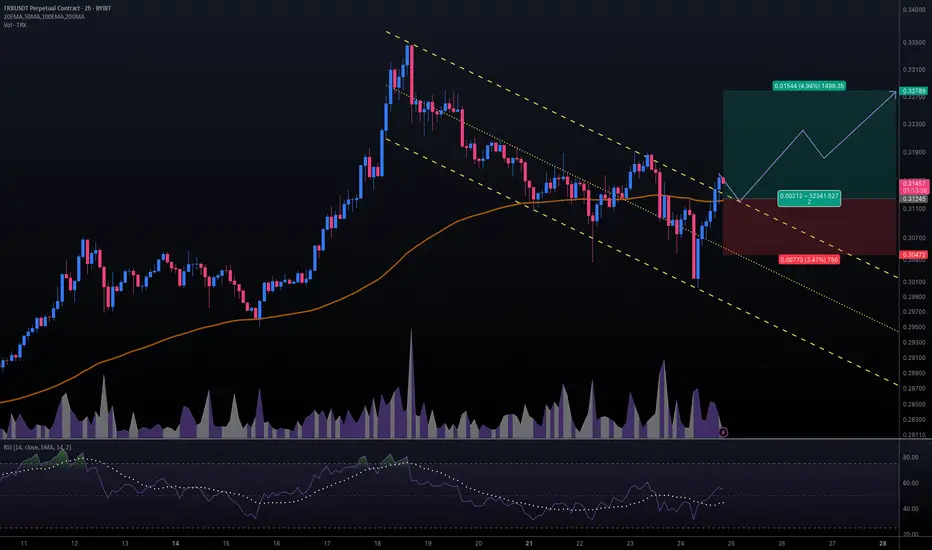
#TRXUSDT #2h (ByBit) Descending channel breakout and retestTron just regained 100EMA support and seems ready for bullish continuation after a pullback to it.
⚡️⚡️ #TRX/USDT ⚡️⚡️
Exchanges: ByBit USDT
Signal Type: Regular (Long)
Leverage: Isolated (16.0X)
Amount: 5.1%
Entry Targets:
1) 0.31245
Take-Profit Targets:
1) 0.32789
Stop Targets:
1) 0.30472
Published By: @Zblaba
CRYPTOCAP:TRX BYBIT:TRXUSDT.P #2h #TRON #DPoS #L1 #Web3 trondao.org tron.network
Risk/Reward= 1:2.0
Expected Profit= +79.1%
Possible Loss= -39.6%
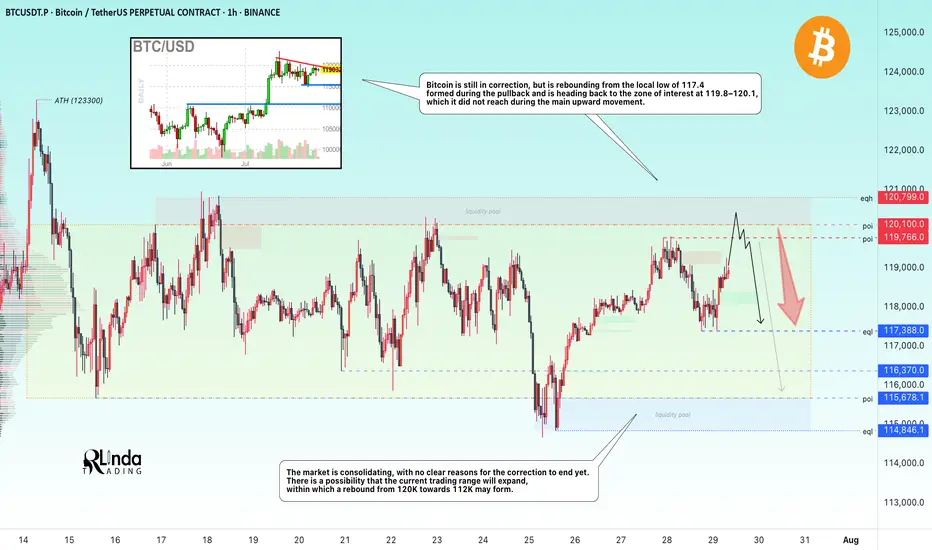
BITCOIN → Hunting for liquidity. Retest resistance before a fallBINANCE:BTCUSDT.P continues to consolidate after a strong rally. There is no strong driver yet, and Bitcoin is reacting weakly to economic data. There is a possibility of a continued correction...
Bitcoin is still in correction, but is rebounding from the local low of 117.4, formed during the pullback, and is heading back up towards the zone of interest at 119.8-120.1, which it did not reach during the main upward movement. I see no fundamental or technical reasons for the correction to end and for growth beyond 121K. I expect a rebound from the resistance zone towards 115-114K. However, in the medium term, I expect the market to attempt to close half or all of the gap between 112K and 114.8K, thereby expanding the key trading range.
Resistance levels: 119.77, 120.1K, 120.8K
Support levels: 117.4, 116.37, 115.68
Technically, a false breakout (liquidity capture) of key resistance and price consolidation in the selling zone could trigger bearish pressure on the market, which in turn would lead to a correction.
Best regards, R. Linda!
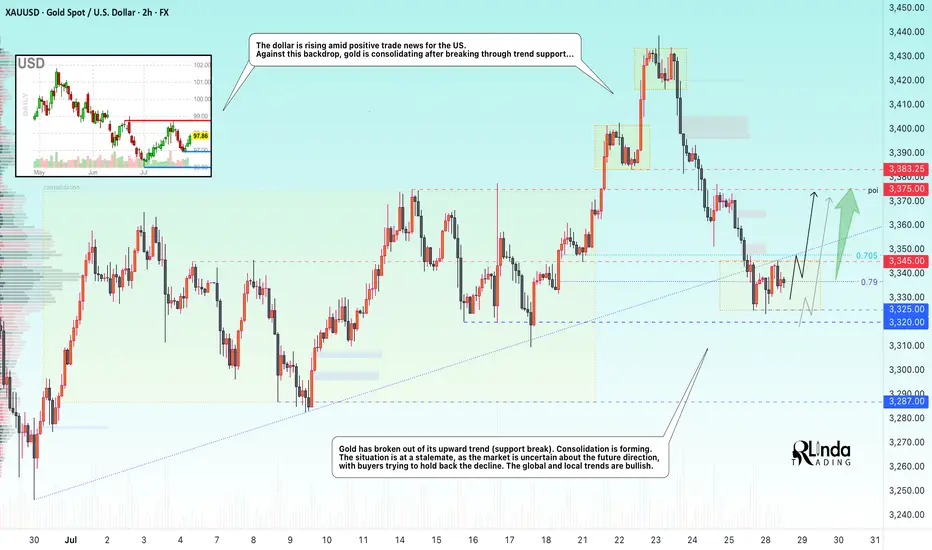
GOLD → Retest of trend support. Consolidation...GOLD is consolidating below the previously broken trend support. On Sunday, Trump announced a trade deal with the EU, which is putting pressure on the market along with the rising dollar...
Gold rebounded from support at $3310 after a week-long low, interrupting a three-day decline amid profit-taking. However, the overall downtrend remains intact as markets brace for a busy week with the release of US GDP data and the Fed's decision. Optimism surrounding US-China trade talks and the US-EU framework agreement is reducing demand for safe-haven assets. Additional pressure on gold is coming from easing geopolitical tensions: Thailand and Cambodia have agreed to ceasefire talks. The metal's recovery may be short-lived.
Technically, we have global and local bullish trends, against which gold is testing support, but as we can see, buyers are trying to hold back the decline due to uncertainty over interest rates. There is a chance that we will see active action by the Fed, behind which lies a rate cut, this week...
Resistance levels: 3345, 3375
Support levels: 3320, 3287
At the moment, I do not see a proper reaction to the support breakout. The price is consolidating after confirming the key trigger at 3345. Thus, if the price starts to return to 3345, test and consolidate above the level, we will have a chance for growth. I do not rule out a liquidity grab from 3325 (false breakout) before the rise.
BUT! The structure will be broken if the price breaks 3325 - 3320 and begins to consolidate below this zone. In this case, gold may fall to 3287
Best regards, R. Linda!
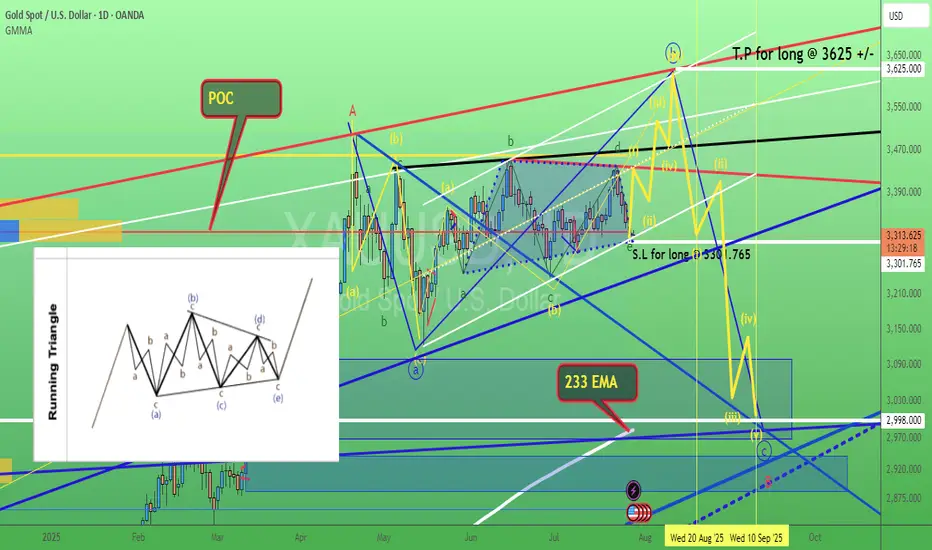
Gold. wave e (green) of triangle possible reached. 29/July/25XAUUSD based on speed of chart + confluence zone 1) Channel Support 2) POC of volume profile 3) Trendline support. Gold probably completed its wave e (green) of triangle.
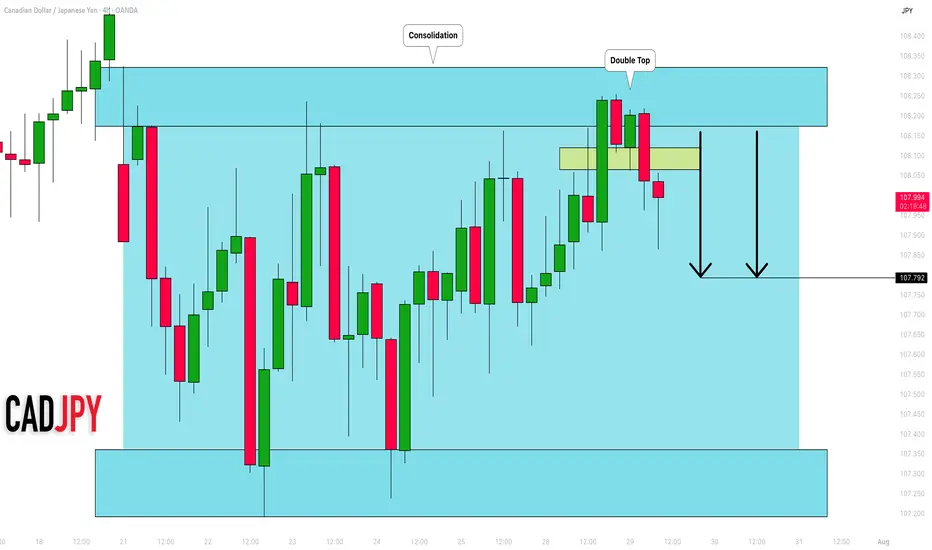
CADJPY: Consolidation Trading 🇨🇦🇯🇵
I expect a retracement from a resistance of a consolidation
range on CADJPY.
My confirmation is a double top pattern formation on that
on a 4H time frame.
Goal - 107.79
❤️Please, support my work with like, thank you!❤️
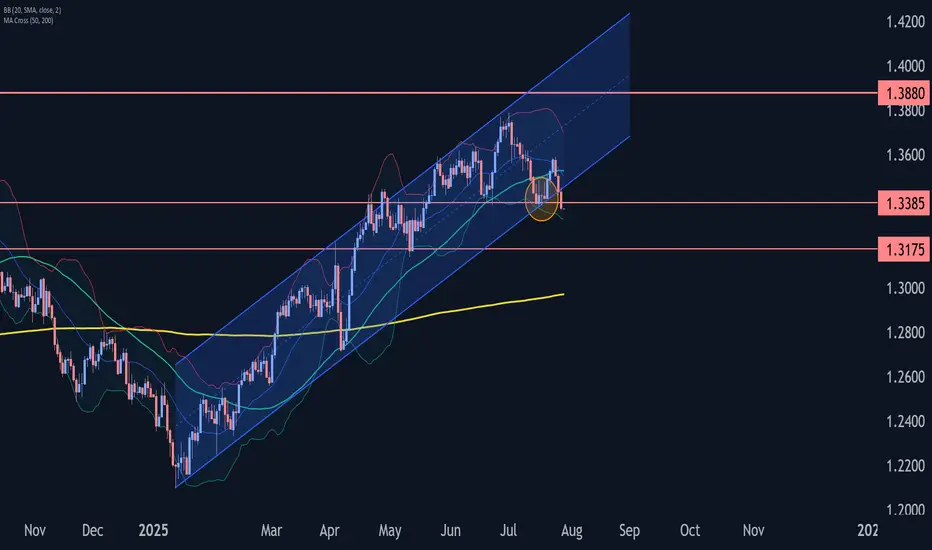
GBPUSD Wave Analysis – 28 July 2025
- GBPUSD broke support zone
- Likely fall to support level 1.3175
GBPUSD currency pair recently broke the support zone between the support level 1.3385 (which has been reversing the price from June) and the support trendline of the daily up channel from January.
The breakout of this support zone should accelerate the active intermediate impulse wave (1) from the start of July.
GBPUSD currency pair can be expected to fall to the next support level 1.3175 (former multi-month low from May, low of the earlier correction (4)).
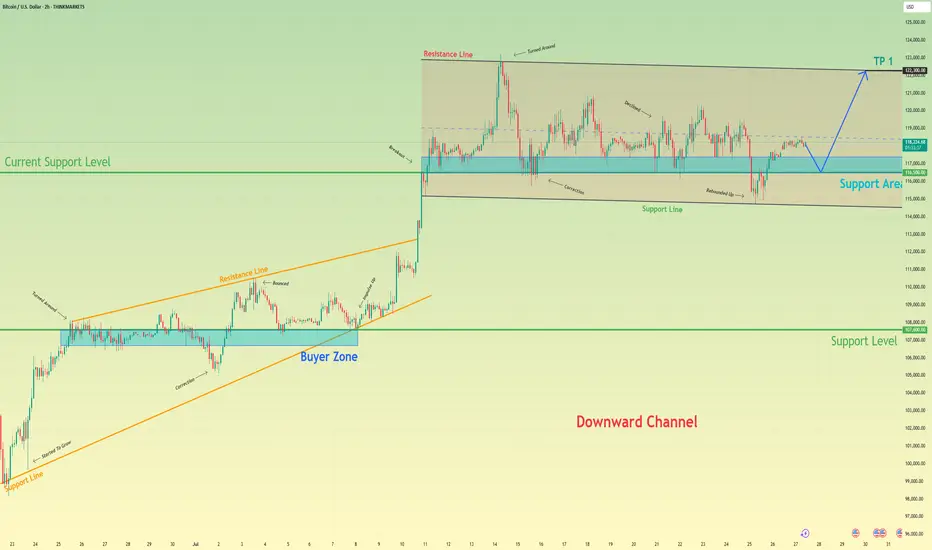
Bitcoin will rebound up from support area to resistance lineHello traders, I want share with you my opinion about Bitcoin. After a strong upward trend that originated from the buyer zone and evolved through an upward wedge, bitcoin executed a decisive breakout, shifting the market into a new, higher-value market phase. This powerful move has since led to an extended period of wide consolidation within a well-defined horizontal channel, a classic sign of the market pausing to absorb the prior impulse and build cause for its next major leg. Currently, the asset's price action is rotating within this structure, defined by a key support area around 116500 and an upper resistance line. Having been rejected from the top, the price is now completing another downward correction and is approaching the channel's foundational support for a crucial test. The primary working hypothesis is a long scenario, predicated on the proven resilience of this support level. A confirmed upward rebound from this 116500 zone would signal that the accumulation within the channel is continuing and likely to resolve upwards. Therefore, the tp is logically and strategically placed at 122300, as this level not only coincides perfectly with the channel's upper resistance line but also represents the completion of the internal rotation, setting the stage for a potential continuation of the larger uptrend. Please share this idea with your friends and click Boost 🚀
Disclaimer: As part of ThinkMarkets’ Influencer Program, I am sponsored to share and publish their charts in my analysis.
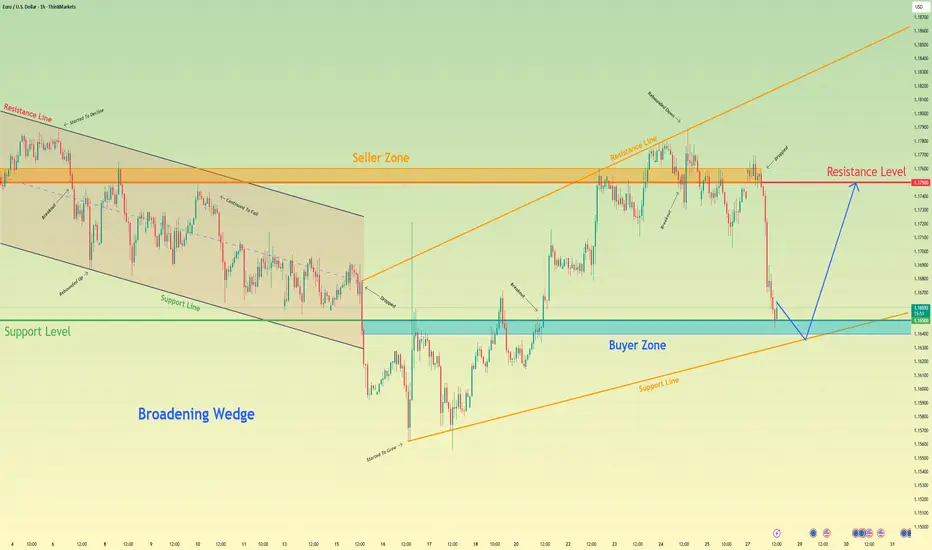
Euro will rebound from support line of wedge to resistance levelHello traders, I want share with you my opinion about Euro. After breaking out decisively from a prior downward channel, the euro initiated a significant structural shift, moving from a clear downward trend into a new and more volatile market condition. This transition has led to the development of a large broadening wedge pattern, which is characterised by higher highs and lower lows, indicating an expansion in volatility as both buyers and sellers fight for control. The boundaries of this struggle are well-defined by a major buyer zone around 1.1650 and a formidable seller zone near 1.1750. Currently, the pair is in a corrective phase, moving downwards within the wedge after a recent upward rebound was rejected from the upper resistance line. The primary working hypothesis is a long scenario, which anticipates that this downward correction will find strong support at the confluence of the wedge's ascending support line and the horizontal buyer zone around 1.1650. A confirmed bounce from this critical area of support would validate the integrity of the broadening wedge pattern and likely trigger another powerful upward rotation. Therefore, the TP is strategically placed at the 1.1750 resistance level. Please share this idea with your friends and click Boost 🚀
Disclaimer: As part of ThinkMarkets’ Influencer Program, I am sponsored to share and publish their charts in my analysis.