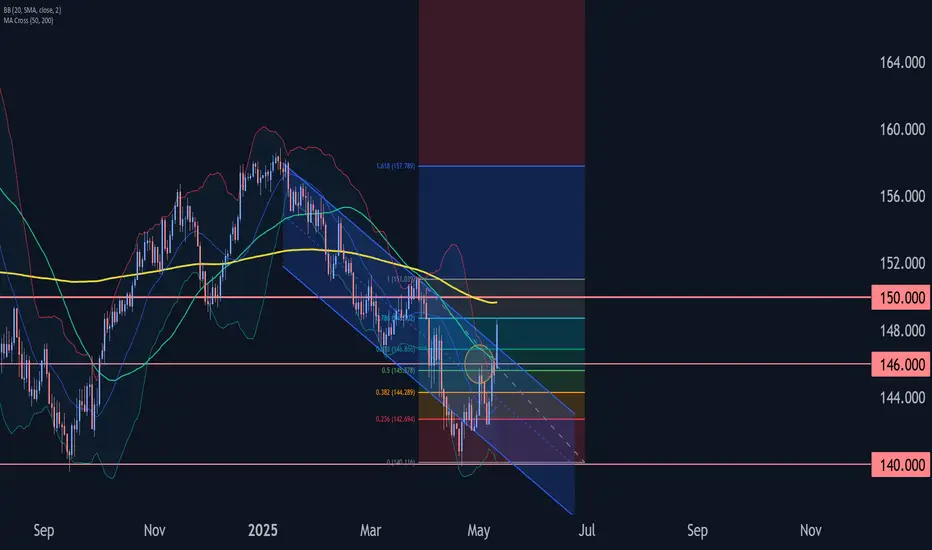
NZDJPY → Countertrend correction and false breakoutFX:NZDJPY is testing resistance within a global downtrend. The currency pair is not yet ready to continue its growth and is forming a local reversal pattern.
Within the global downtrend, the currency pair is forming a countertrend correction and testing resistance at 87.400. The liquidity pool formed above this level is not yet ready to let the price move further. Without the possibility of continuing growth, the price returns to the range and forms a false breakout of resistance. However, since we are in the range and the price has returned inside it, if the bears hold the line (the upper limit of the trading range) at 87.400, this could trigger a further decline, thereby continuing the global downtrend.
Resistance levels: 87.400
Support levels: 86.5, 85.26
Consolidation of the price below 87.400 will confirm that the price is not yet ready to continue the trend. The falling dollar index is provoking a rise in the Japanese yen, which may also put pressure on the currency pair.
Best regards, R. Linda!
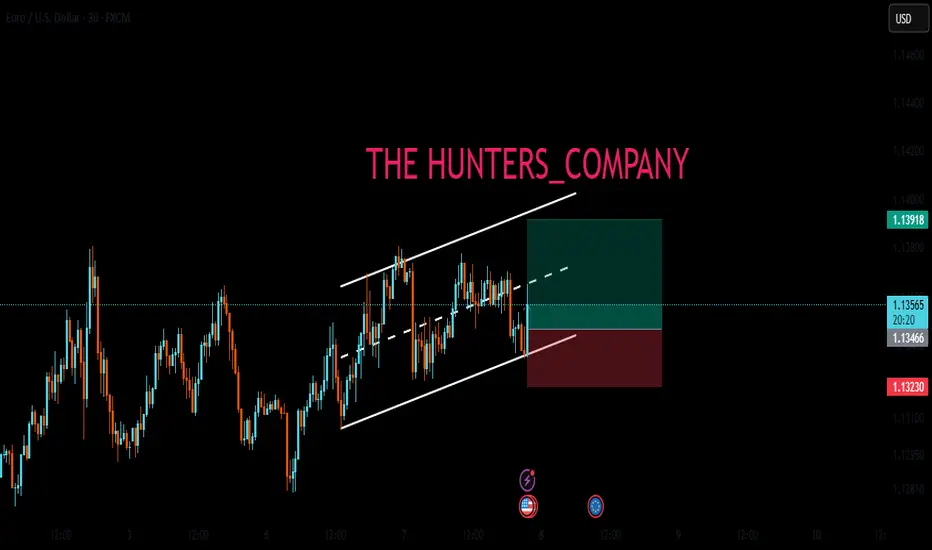
Parallel Channel

EURO - Price can continue to decline in falling channelHi guys, this is my overview for EURO, feel free to check it and write your feedback in comments👊
Not long ago, price entered to pennant, where it at once made an impulse up and broke $1.0820 level.
Then price rose to resistance line of a pennant and then corrected to support area, where it later reached the support line.
Next, Euro made an upward impulse, thereby exiting from the pennant pattern and breaking $1.0820 level again.
Price made a small correction and then rose higher than $1.1270 level, breaking it, but later started fall in falling channel.
In channel, Euro broke $1.1270 level one more time and fell to support line, after which rose almost to this level.
Now, I expect that price can rise to the resistance line and then continue to fall in a falling channel to $1.0960
If this post is useful to you, you can support me with like/boost and advice in comments❤️

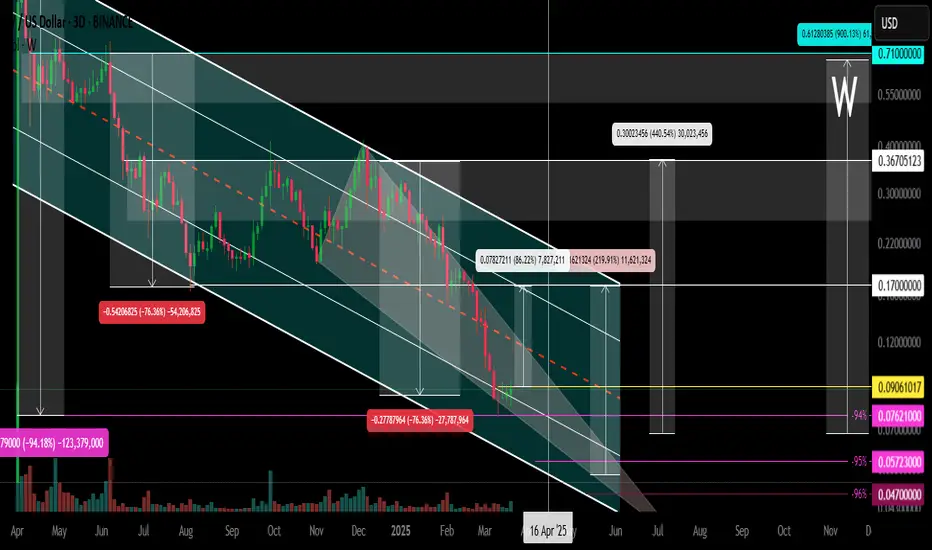
W / USDT Main trend. 23 03 2025Logarithm. Time frame 3 days. Descending channel, price in local clamping in consolidation at dynamic support of the internal channel. From listing -94% at the moment.
Local percentages, medium-term and long-term to key zones of chart logic and liquidity, are shown on the chart as a guide for building your tactics and risk control.
🔴 There is potential for a decline to external support of a large descending channel (optional). I showed this option for building tactics and money management. Such assets in terms of liquidity, as a rule, decrease by 96-98%
🟢 If, from this price clamp, the price goes up , then the first resistance is the dynamic resistance of the internal channel (from which there may be a local reversal). Then the external (similarly). If the trend breaks and exits the descending channel, then strong resistance is the previous consolidation of 0.24-0.36
Locally, this clamping zone looks like this.
USDCHF 30min | Fibonacci + Order Block Combo Reversal Setup💵 USDCHF 30-Min Smart Money Breakdown — May 14, 2025
This is a prime example of a multi-confluence reversal trade. Let’s walk through this sniper setup:
🔍 1. Market Structure & Context
Price has been flowing within a solid descending channel
We just witnessed a sharp impulse leg downward, now reacting from a key demand area
Channel bottom + OB + fib = confluence stacker heaven
🧱 2. Zone Confluence
Price taps into a high-probability Order Block (highlighted purple)
Lining up with the 61.8% fib retracement, one of the most powerful golden pockets
Immediate reaction seen with bullish wick rejection — evidence of smart money stepping in
📈 3. Entry Logic
Entry: Around 0.83350
SL: Below 0.83200 (protected under 70.5%)
TP: Near 0.84700
RRR ≈ 1:5+ — perfect for prop firm funded traders or swing-style scalpers
🔁 Management & Outlook
Key confirmation = break above midline channel
Scale out at 0.83700 (50% fib), then trail SL for runners
If price rolls back under 0.83200, it may seek the 79% or deeper liquidity zone
💡This type of setup is what separates reactive traders from anticipatory Smart Money traders. You’re not chasing—you're waiting in the kill zone.
💬 Comment “🔥” if you’d take this setup.
🔁 Repost if you love OB + Fib sniper logic.
📲 Follow @ChartNinjas88 for next-level breakdowns.
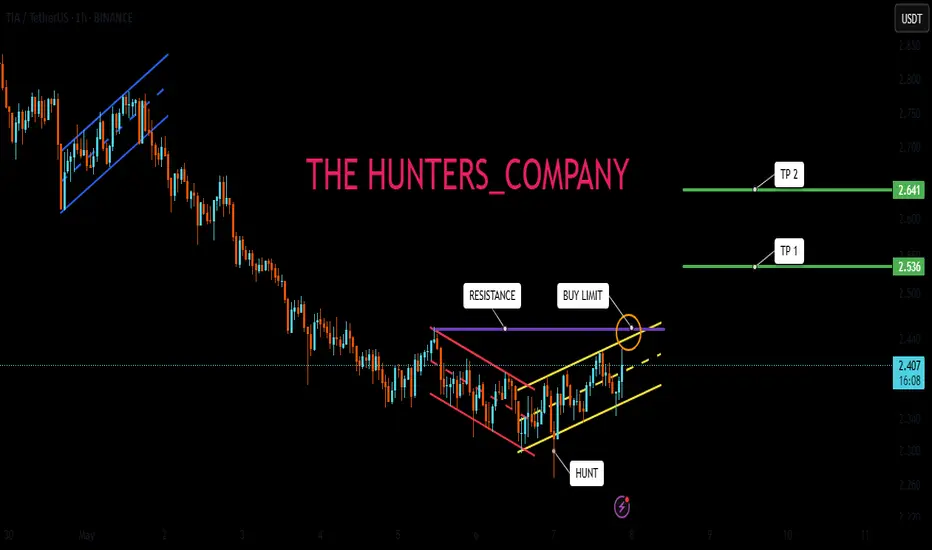
TIA SIGNALSHello friends
As you can see, this currency has a beautiful chart and the technical analysis we did is that if the valid resistance is broken, we can open a buy trade with capital and risk management and move with it to the specified targets.
*Trade safely with us*
GOOD POINT Hello friends
As you can see, the price has fallen to the bottom of the next channel with the channel break and now the important point is to see if the price is supported considering reaching the bottom of the channel and the important Fibonacci support?
To solve this issue, we suggest you buy stepwise, of course with capital and risk management...
*Trade safely with us*
EURUSD LIVE TRADEHello friends
Given the formation of an ascending channel and the price rebounding from the bottom of the channel, we can trade with risk and capital management.
*Trade safely with us*
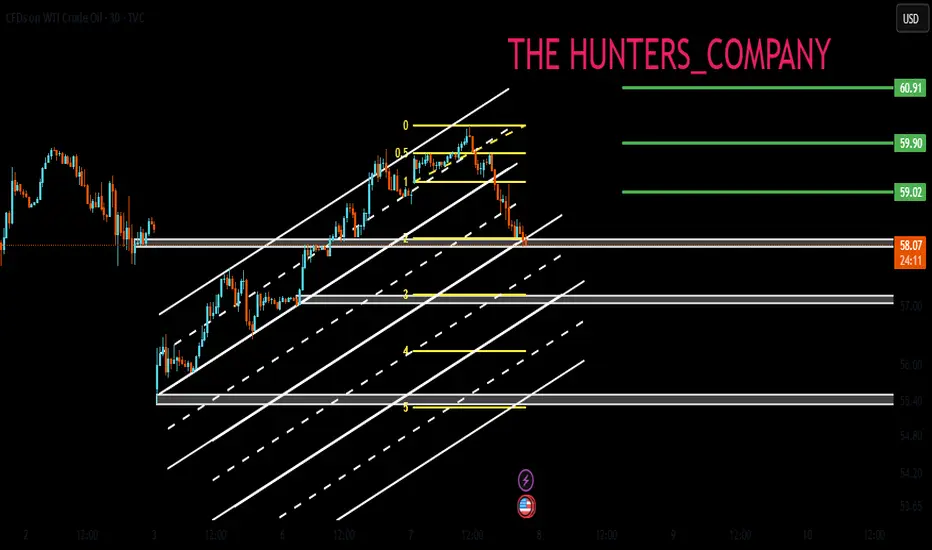
USOIL UPDATEHello friends
Given the recent growth in oil prices, it is natural for the price to correct. Now we have obtained the most important price support areas for you and we have also specified the target. If you are willing to enter the transaction, be sure to observe capital management.
*Trade safely with us*
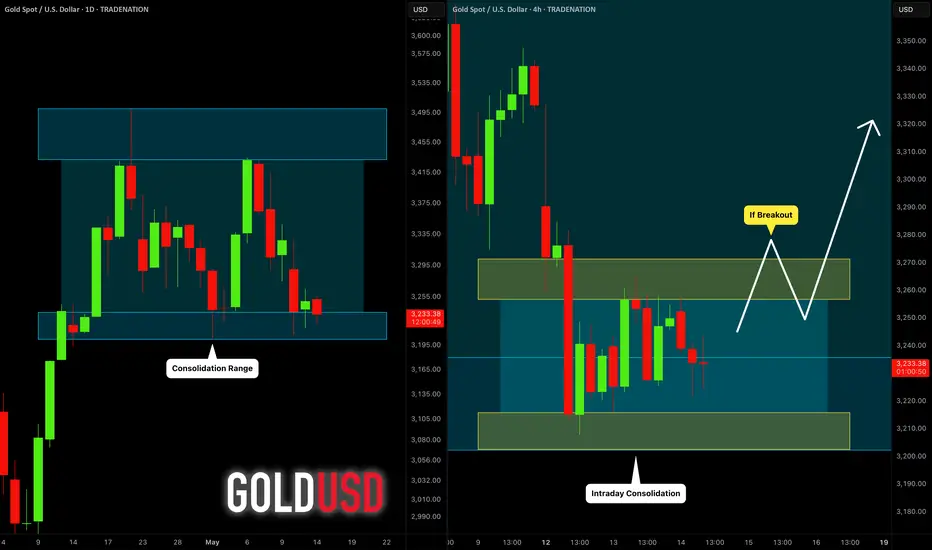
GOLD (XAUUSD): Detailed Technical Outlook & Trading Plan
As we discussed on the yesterday's live stream,
Gold is currently in a consolidation stage.
The price is stuck within a wide horizontal channel on a daily
and we see a test of its support at the moment.
With the absence of high impact news in the economic calendar,
I assume that a consolidation will continue and there is a high
chance to see a pullback.
Your confirmation signal will be a bullish breakout and a 4H candle close
above 3271 - upper boundary of the intraday horizontal range.
There will be a strong possibility of a rise to at least to 3320 level.
Alternatively, a bearish violation of a support of the range on a daily
and a daily candle close below that may trigger a further decline.
❤️Please, support my work with like, thank you!❤️
I am part of Trade Nation's Influencer program and receive a monthly fee for using their TradingView charts in my analysis.
SHORT. Approaching Key Resistance – Descending Channel 4HEntered a bit too early—currently in drawdown, but risk is managed. This is exactly the moment I step back, stay off the charts, and let the plan breathe. Discipline over impulse.
Price is climbing toward the upper boundary of a descending channel. Watching closely for a potential tap and rejection at the trendline. This level could act as a solid resistance zone for short entries, especially if momentum stalls. Patience is key—waiting for confirmation before diving in.
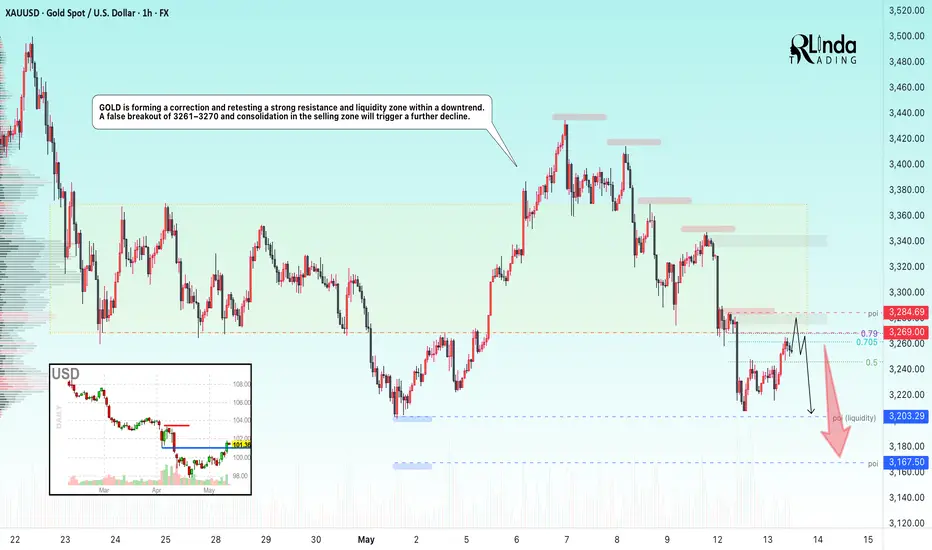
GOLD → Retest resistance before fallingFX:XAUUSD is forming a correction and retesting a strong resistance and liquidity zone within a downtrend. The global trend is one step away from a reversal...
Gold stabilized ahead of the release of US inflation data. After falling 3%, gold is holding steady at around $3,200, consolidating against a weaker dollar. Investors are awaiting US CPI data, which could set a new direction.
Optimism about the US-China trade agreement, geopolitical détente, and profit-taking on the dollar are holding back the price decline. The market is assessing how inflation data will affect Fed policy and demand for safe-haven assets.
Globally, the market doubts that the upward trend will continue, and there are reasons to look for points from which the price could start to fall sharply...
Resistance levels: 3269, 3284
Support levels: 3246, 3200, 3167
The news may cause a shake-up, but if there are no surprises, a false breakout of 3260-3270 and consolidation of prices in the selling zone could trigger a decline to 3200-3150.
Best regards, R. Linda!
SUIUSDT → False breakdown of support before growthBINANCE:SUIUSDT has entered a consolidation phase within a bullish trend. The chart shows a zone of interest and a trigger area that are worth paying attention to...
The coin looks quite positive. An upward trend is forming, which is also supported by the growth of Bitcoin and a relatively positive fundamental background.
Technically, SUI is consolidating between 4.110 and 3.811. Below the support level, a huge liquidity pool has formed, which has not yet been tested. There is a high probability of a false breakdown before the growth continues, but if the market turns out to be more aggressive, buyers may not let the price fall to 3.811, in which case we can consider a breakout of the resistance at 4.11-4.275 and consolidation of the price above these levels with the aim of continuing growth.
Support levels: 3.811, 3.667
Resistance levels: 4.11, 4.275
The movement of Bitcoin shows that the market is gathering liquidity as part of a local correction against the backdrop of a bullish trend. Yesterday, we all witnessed a local liquidation, but there are no reasons for a decline yet. SUI, in an ideal scenario, may test support at 3.811 and form a false breakdown before continuing to grow.
Best regards, R. Linda!

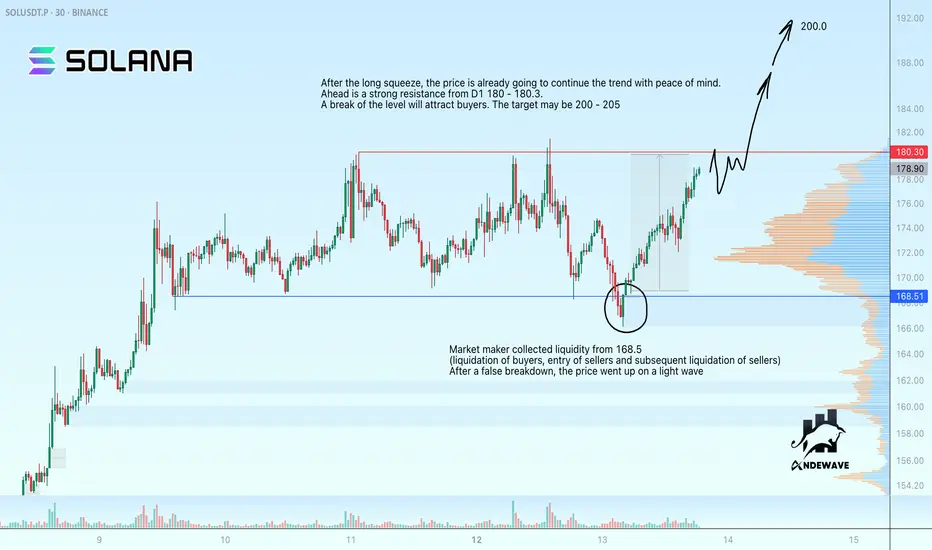
SOLUSDT may rise to 200.0 after long-squeezeMarket maker collected liquidity from 168.5 (liquidation of buyers, entry of sellers and subsequent liquidation of sellers)
After a false breakdown the price went up on a light wave
After the long squeeze, the price is already going to continue the trend with peace of mind.
Ahead is a strong resistance from D1 180 - 180.3.
A break of the level will attract buyers. The target may be 200 - 205
Scenario: a retest of the resistance may end in a small correction. If there is no reversal and the price continues to test 180-180.3, we can expect a breakout, which may attract buyers and further growth to 200 - 205.
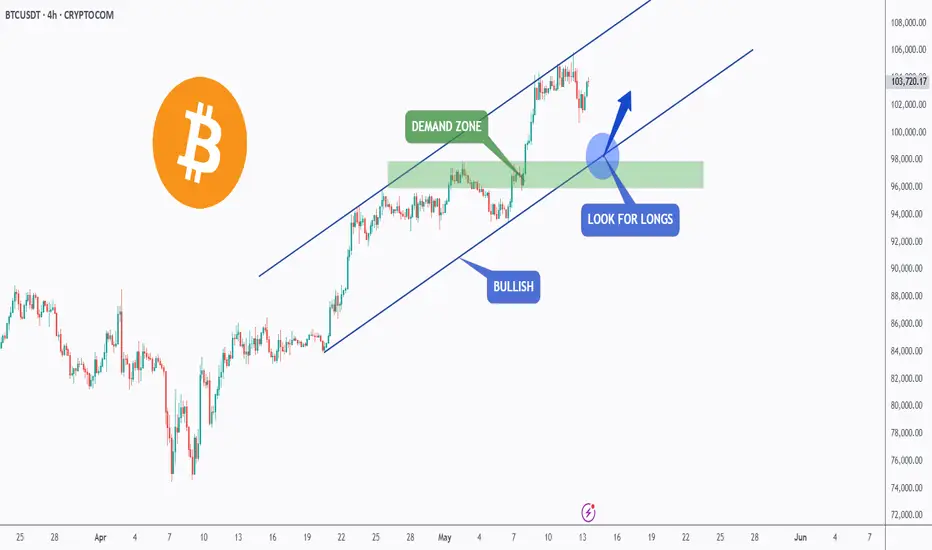
BTC - New Short-Term Long!Hello TradingView Family / Fellow Traders. This is Richard, also known as theSignalyst.
📈BTC has been overall bullish trading within the rising channel marked in blue.
Moreover, the green zone is a strong demand and structure.
🏹 Thus, the highlighted blue circle is a strong area to look for buy setups as it is the intersection of structure and lower blue trendline acting non-horizontal support.
📚 As per my trading style:
As #BTC retests the blue circle zone, I will be looking for bullish reversal setups (like a double bottom pattern, trendline break , and so on...)
📚 Always follow your trading plan regarding entry, risk management, and trade management.
Good luck!
All Strategies Are Good; If Managed Properly!
~Rich
HelenP. I Bitcoin will continue to grow inside upward channelHi folks today I'm prepared for you Bitcoin analytics. The price has recently shown another confident bullish impulse, pushing higher within a clean ascending channel. The key moment was the breakout above the resistance zone, which had previously acted as a ceiling for the price. This breakout marked the continuation of a higher-high, higher-low sequence that confirms the strength of the ongoing trend. Then the market returned to retest this former resistance, now acting as support, and immediately bounced, reinforcing buyer control and validating the area as a foundation for the next move. Now BTC is holding firm in the upper half of the channel, maintaining its position above the trend line with little sign of weakness. This combination of sustained bullish structure, well-respected technical levels, and steady volume behavior suggests that the market is still preparing for higher levels. With the current structure and momentum, I expect BTCUSDT will continue its upward path within the channel. My goal is 108700 points, which aligns almost with the resistance line of the upward channel. If you like my analytics you may support me with your like/comment ❤️

Long. 1H Broke through Resistance retest and rally??Price just broke above resistance with strong momentum. There’s a Fair Value Gap (FVG) below that might get filled on a pullback. With CPI data out today, volatility could spike—watch for a potential retest before continuation either way.
Ethereum Is Quietly Preparing for a Massive Move !Hello Traders 🐺
In this idea, I want to show you one of the coolest charts I’ve ever seen in my life — seriously!
These kinds of patterns, especially on the monthly time frame, take multiple years to form, and that’s exactly why they are extremely valid. When a structure develops on higher time frames, we can rely on it more confidently and make smarter decisions 📊
As you can see on the chart, ETH price is moving inside a very clear ascending channel, and its reactions to the channel lines are simply beautiful. Let’s take a closer look:
In addition to the top and bottom of the channel, we also have a “make or break” level, shown by the blue dotted line (which is the middle line of the channel).
Price reactions to this line throughout different time periods have been amazing. And here's the more interesting part:
👉 Price is currently above the middle line, and on its way up, it’s approaching one of the most critical resistance levels — the orange descending trendline.
If we zoom out, we’ll see that ETH is actually squeezed between this descending resistance and the ascending channel's middle line, forming a beautiful triangle 🔺
If ETH can break above this triangle, we could see a massive surge, possibly taking price all the way up to the top of the channel, which in my opinion is somewhere around $15,000 🚀
Now let’s talk about RSI:
If you take a closer look at the RSI below the chart, you’ll notice a repetitive pattern.
Each time ETH enters a major bull run or makes a new all-time high, RSI touches the upper resistance in the overbought zone.
We’re still in the early stage of this cycle — and both technically and indicator-wise, there seems to be plenty of room to grow.
Hope you enjoy this idea — I’ll be happy to answer your questions in the comments below 👇
And as always, remember our golden rule:
🐺 Discipline is rarely enjoyable, but almost always profitable 🐺
🐺 KIU_COIN 🐺

Macro Group Egypt is expected to target 2.70 then 2.92Daily chart,
the stock EGX:MCRO price is drawing a rising channel pattern.
I expect the price will break out the resistance line R1; to target the line R2, then the line R3 at around 2.92
Some intermediate resistance levels are shown on the chart.
A new entry (buy) should be made after closing above 2.30
Stop loss below 2.20
Technical indicators:
RSI has a bullish trend line
MACD is positive

Is $BTCUSDT going to 91k ??This BINANCE:BTCUSDT chart reveals that Bitcoin has been trading within a clear ascending channel. This pattern typically suggests bullish momentum, with price making higher highs and higher lows. However, the most recent price action shows a decisive break down below the lower trendline of this channel. This breakdown suggests a potential shift in the short-term bias from bullish to bearish.
The setup strongly suggests a short trading opportunity. The breakdown from the ascending channel, coupled with the potential supply zone above, provides a bearish setup.
Entry: A potential entry point would be a retest of the broken lower trendline of the channel or within the highlighted red supply zone.
Target 1: The immediate target is the horizontal purple support level around 96,000.
Target 2: If the 96,000 support breaks, the next target would be the stronger horizontal yellow support level around 91,000.
Kindly support this analysis to enable it reach to other people, and do comment your thoughts.

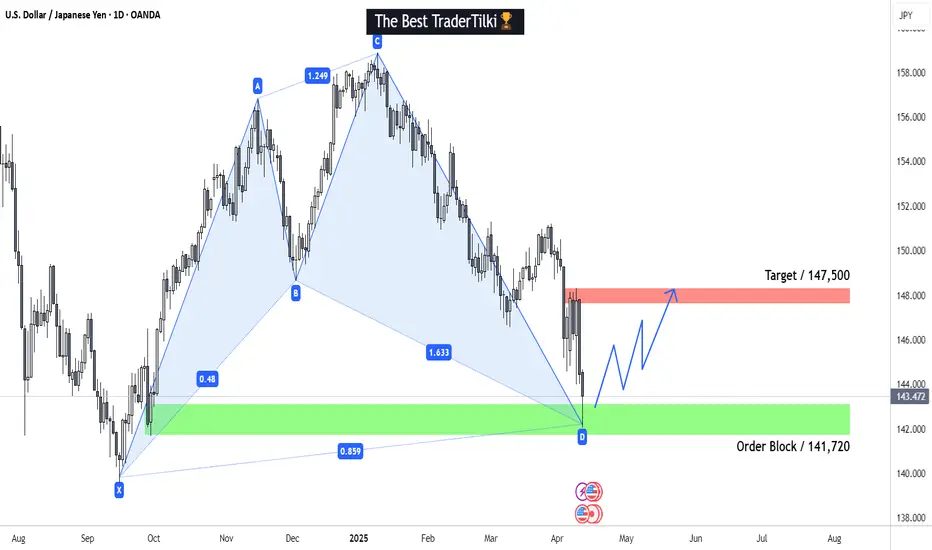
USDJPY Wave Analysis – 12 May 2025- USDJPY broke the resistance area
- Likely to rise to resistance level 150.00
USDJPY currency pair continues to rise strongly inside the c-wave, which recently broke the resistance area between the resistance level 146.00 (top of the previous wave a), 50% Fibonacci correction of the downward impulse from March and the resistance trendline of the daily down channel from January.
The breakout of this resistance area accelerated the minor c-wave of the active ABC correction (2) from the end of April.
USDJPY currency pair can be expected to rise to the next resistance level 150.00 (target price for the completion of the active c-wave).
USDJPY / 1 DAY / BULLHello Guys;
My USDJPY target level is 147,500.
My target may come a bit late because this trade is a swing trade.
I would appreciate it very much if you do not miss your likes within the framework of Respect for Labor Thank you very much in advance
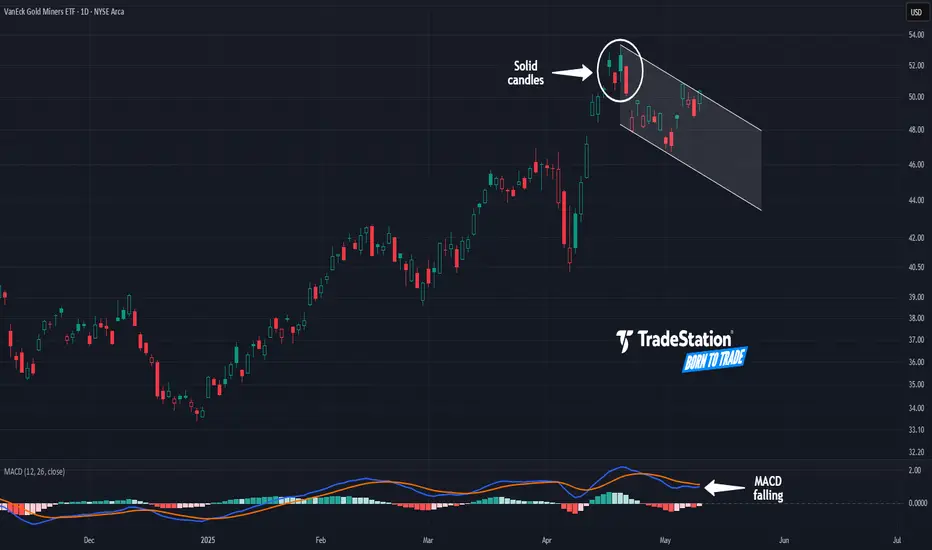
Gold Miners May Be FatiguedThe VanEck Gold Miners ETF had a major breakout in March, but some traders may think it’s getting fatigued.
The first pattern on today’s chart is the series of candles on April 16-22. Those bars occurred at the highest levels in almost four years. They’re also solid, illustrating that price wasn't able to hold the peaks.
Second, GDX fell sharply afterwards and made a lower high last week. That could mean April represented a peak. It could additionally suggest a new downward channel is taking shape.
Third, MACD is falling.
Next, gold and gold miners have benefited from the uncertainty caused by tariffs. Now, with signs of the trade war easing, some traders may find less appeal in the yellow metal.
Finally, GDX is an active underlier in the options market. (It averages more than 140,000 contracts per session, according to TradeStation Data.) That could help traders take positions with calls and puts.
Standardized Performances for the ETF mentioned above:
VanEck Gold Miners ETF (GDX)
1-year: +47.93%
5-years: +51.92%
10-year: +143.71%
(As of April 30, 2025)
Exchange Traded Funds ("ETFs") are subject to management fees and other expenses. Before making investment decisions, investors should carefully read information found in the prospectus or summary prospectus, if available, including investment objectives, risks, charges, and expenses. Click here to find the prospectus.
TradeStation has, for decades, advanced the trading industry, providing access to stocks, options and futures. If you're born to trade, we could be for you. See our Overview for more.
Past performance, whether actual or indicated by historical tests of strategies, is no guarantee of future performance or success. There is a possibility that you may sustain a loss equal to or greater than your entire investment regardless of which asset class you trade (equities, options or futures); therefore, you should not invest or risk money that you cannot afford to lose. Online trading is not suitable for all investors. View the document titled Characteristics and Risks of Standardized Options at www.TradeStation.com . Before trading any asset class, customers must read the relevant risk disclosure statements on www.TradeStation.com . System access and trade placement and execution may be delayed or fail due to market volatility and volume, quote delays, system and software errors, Internet traffic, outages and other factors.
Securities and futures trading is offered to self-directed customers by TradeStation Securities, Inc., a broker-dealer registered with the Securities and Exchange Commission and a futures commission merchant licensed with the Commodity Futures Trading Commission). TradeStation Securities is a member of the Financial Industry Regulatory Authority, the National Futures Association, and a number of exchanges.
Options trading is not suitable for all investors. Your TradeStation Securities’ account application to trade options will be considered and approved or disapproved based on all relevant factors, including your trading experience. See www.TradeStation.com . Visit www.TradeStation.com for full details on the costs and fees associated with options.
Margin trading involves risks, and it is important that you fully understand those risks before trading on margin. The Margin Disclosure Statement outlines many of those risks, including that you can lose more funds than you deposit in your margin account; your brokerage firm can force the sale of securities in your account; your brokerage firm can sell your securities without contacting you; and you are not entitled to an extension of time on a margin call. Review the Margin Disclosure Statement at www.TradeStation.com .
TradeStation Securities, Inc. and TradeStation Technologies, Inc. are each wholly owned subsidiaries of TradeStation Group, Inc., both operating, and providing products and services, under the TradeStation brand and trademark. When applying for, or purchasing, accounts, subscriptions, products and services, it is important that you know which company you will be dealing with. Visit www.TradeStation.com for further important information explaining what this means.
NZDUSD is preparing for a reversal and a fallNZDUSD is in consolidation and preparing to exit it. Ahead is possible breakout of trend support and fall to 0.5757
The reason is as follows: change of fundamentals background (positive signals on tariff war), dollar growth and market reversal.
Scenario: break of consolidation support at 0.5885, price consolidation below this level - this will be a signal ready to start distribution, i.e. downward movement.
Primary target 0.5 fibo, secondary target 0.7 fibo
