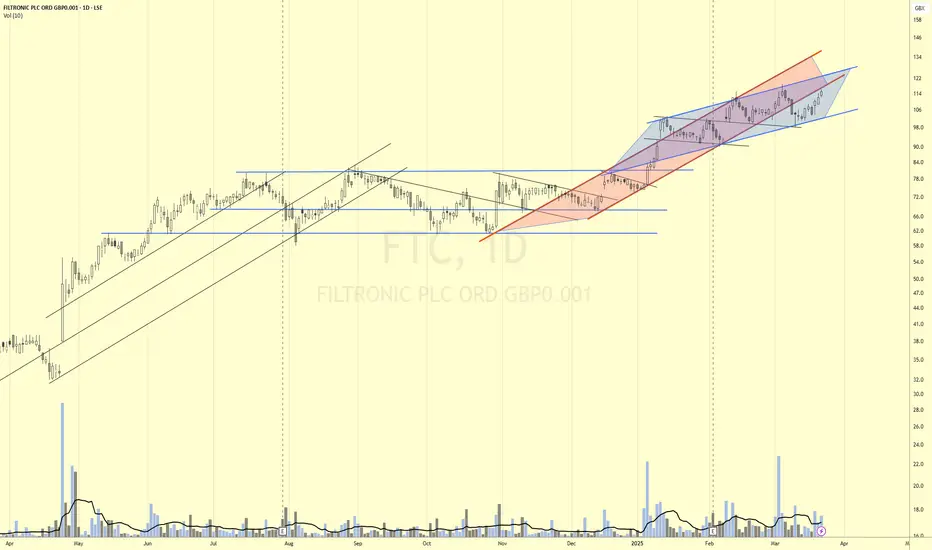
Change in Channel direction in #FTCI had thought that #FTC price might be coming up to bounce off the red channel support and could then perform a 'trader's remorse'. I now see that perhaps there could be a change in channel direction, from red to blue. This type of action can be seen quite often.
Parallel Channel
GOLD - Price can decline to support area and then start to growHi guys, this is my overview for XAUUSD, feel free to check it and write your feedback in comments👊
Recently price started to decline to falling channel and soon reached $2880 level and then rose to the resistance line.
Then price bounced and in a short time declined to support line of the channel breaking $2880 level.
But soon, Gold bounced from line and broke $2880 level again and some time traded near resistance line.
Next, price made a correction to $2880 level and then started to grow and soon exited from falling channel.
After this Gold reached $3025 level, broke it, and is now traded near this level, which coincides with support line.
So, in my opinion, Gold can decline to support area and then it bounce up to $3085, breaking the support line.
If this post is useful to you, you can support me with like/boost and advice in comments❤️

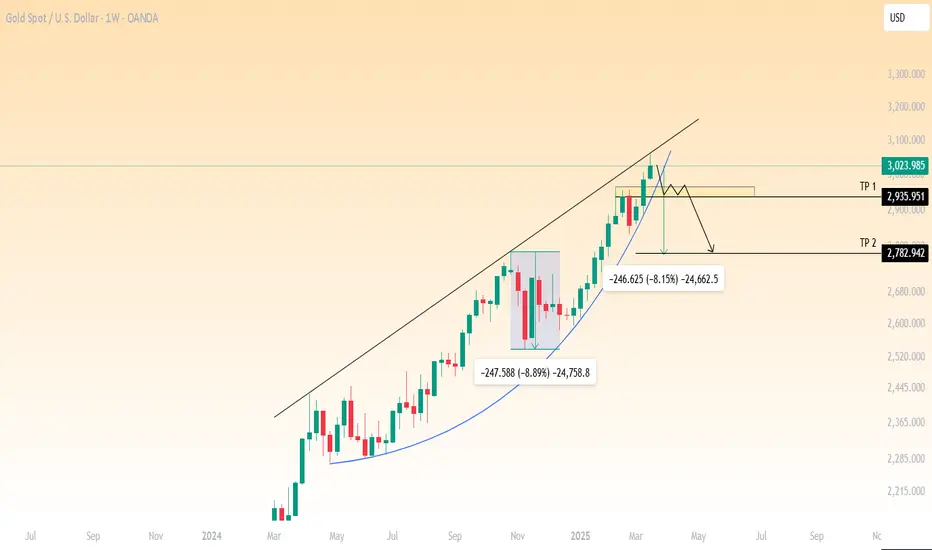
XAUUSD Weekly Analysis – Bearish Correction ExpectedGold (XAUUSD) has recently broken above a rising wedge resistance on the weekly timeframe but is now showing early signs of potential exhaustion. Price action is currently hovering around the $3,024 level after a strong bullish rally. However, historical patterns and structure suggest a possible bearish correction ahead.
📊 Key Technical Observations:
Rising Wedge Pattern: Price has been following an ascending channel with a sharp parabolic curve. The structure hints at overextension, making it vulnerable to a pullback.
Previous Corrections: Two notable corrections (-8.89% and -8.15%) provide a historical benchmark, reinforcing the possibility of a similar retracement.
Bearish Scenario :
A potential double-top formation and rejection zone is developing around the $3,050 area.
Target Zones:
TP1: $2,935.95 – first major support/resistance flip zone.
TP2: $2,782.94 – deeper retracement aligned with previous corrective structure.
🧠 Trading Bias:
Bearish bias in the short to medium term as gold may seek to correct before any continuation of the bullish trend.
BITCOIN → Flag (consolidation) before falling to 78-73KBINANCE:BTCUSD is consolidating after a short-squeeze relative to 85-87K. A bearish set-up is being formed, the break of which may strengthen further decline to the key target of 73K
A symmetrical triangle is forming within the downtrend on D1, a breakdown of this structure may strengthen the decline. Locally, within the channel a flag - bearish figure is formed (on the local TF false uptrend, the crowd enters to buy from the support or at the break of local resistance, at accumulation of the necessary potential the big player removes the limit order and releases the price, which is dispersed by liquidation of traders), regarding 85K-86.6K the liquidity capture is formed and the price returns to the selling zone. Consolidation below 85K may trigger a breakdown of the figure support and further fall to 80K-78K
Fundamentally: the market sells off any positive news very quickly (negative background is created):
crypto summits, (Trump said nothing new at the second summit)
positive resolutions of problems (for example between SEC and XRP, or removal of restrictions from local exchanges)
crypto reserve
The only nuance, bitcoin's dominance index is still high despite the price drop...
Resistance levels: 85150, 866700, 89400
Support levels: 82K, 80K, 78200
There are no positive signs for growth. The zone where we can consider a trend reversal ( if something supernatural happens ) is 89-91K, but it is very far away.
But now I would consider a breakdown of the flag, or 83.5 - 82.5 and price consolidation below this zone with the purpose of further fall to the local important level 78173. Then another consolidation or correction is possible before a further fall to 73.5K
Regards R. Linda!

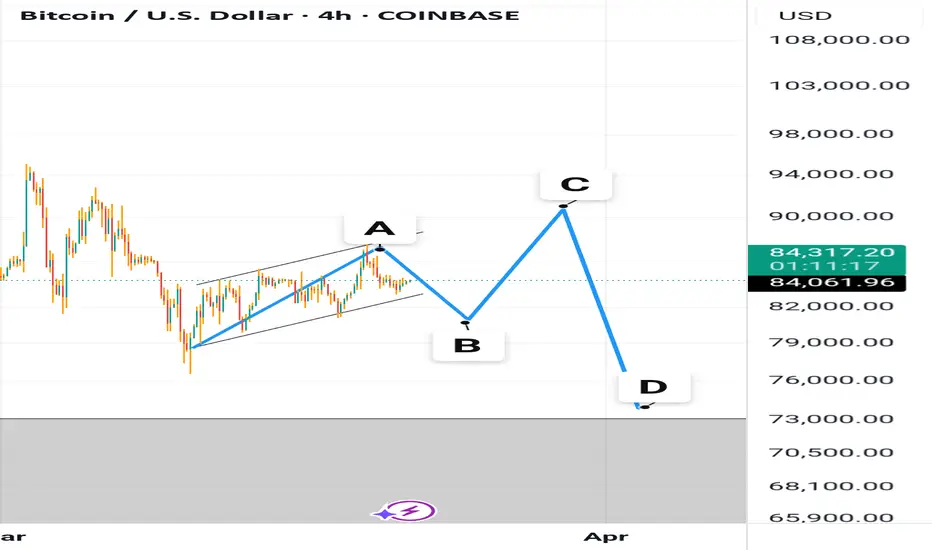
Don't FOMO into the market yet; the bear run isn't over!Earlier today, I took some time to scroll through Reddit and Twitter, where I saw discussions suggesting that the recent pullback in crypto is the first leg of the highly anticipated bull run.
While I largely agree that the bull run is far from over, a broader look at price movements across multiple markets indicates that the bear market isn’t over yet.
To prove this point, I will be analysing Bitcoin's price charts.
On Bitcoin's daily chart, it's clear that the current price movement is more of a correction than a reversal.
Zoom in to the 4-hour chart and and you can see how the pullback moves in an ascending triangle. Over the next few days we might see price break below the channel and head for the area around point 'B'.
This will serve as the pullback for this short swing, where bulls will temporarily drive prices slightly above the most recent high before a sharp decline leads to the formation of a new low.
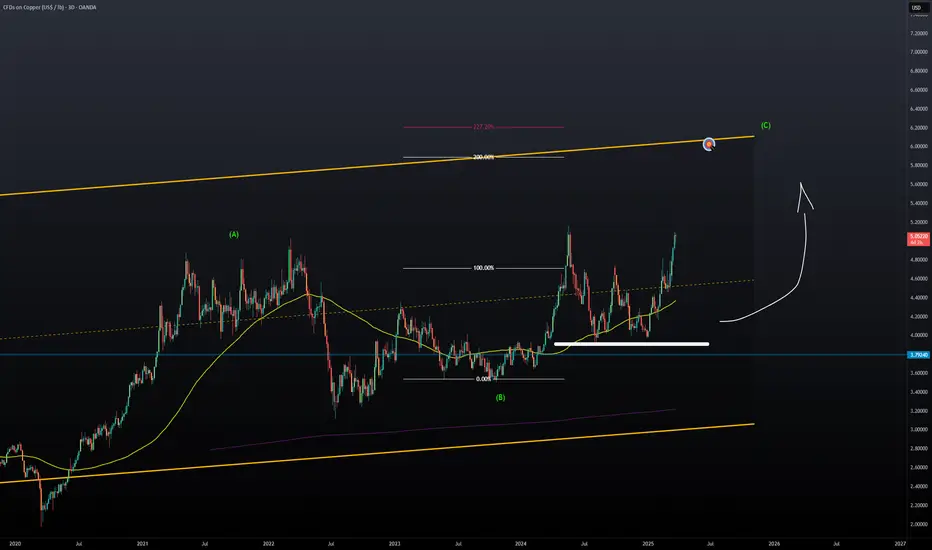
$6 Copper By 2026 | 9 Months to GoWould like to see some type of pullback as we're at a major resistance level and then a resumption towards the $6 target.
This is the best fractal I've seen play out and is still on track.
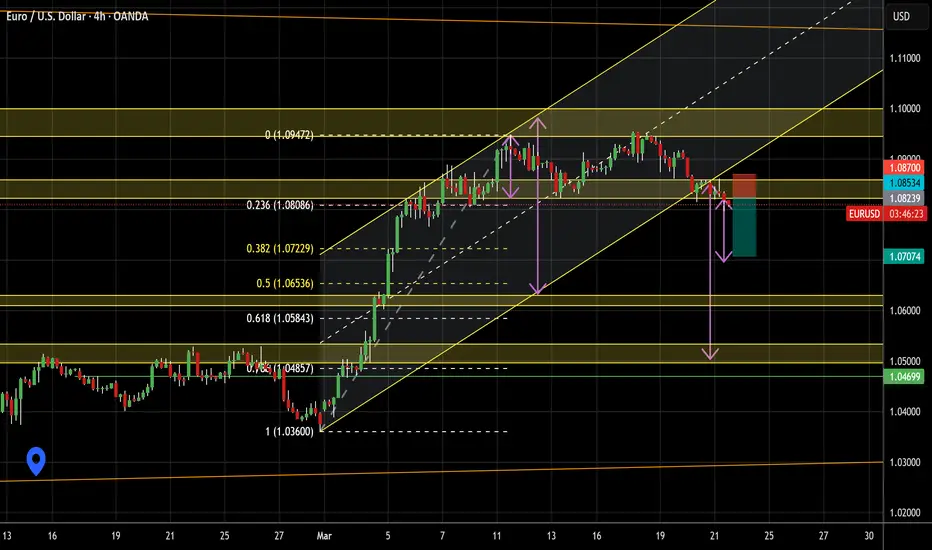
EURUSD 4H SHORTEURUSD 4H SHORT
The pair broke just exited a bullish channel and doing so broke the neckline of a double top, the pair now is doing a pullback to the neck line. The objective for the Double top is around 1.07074 that almost matches Fibo 38% in 1D chart, while the objective for the broken channel is around 1.051 taking the price to a strong resistance working now as support.
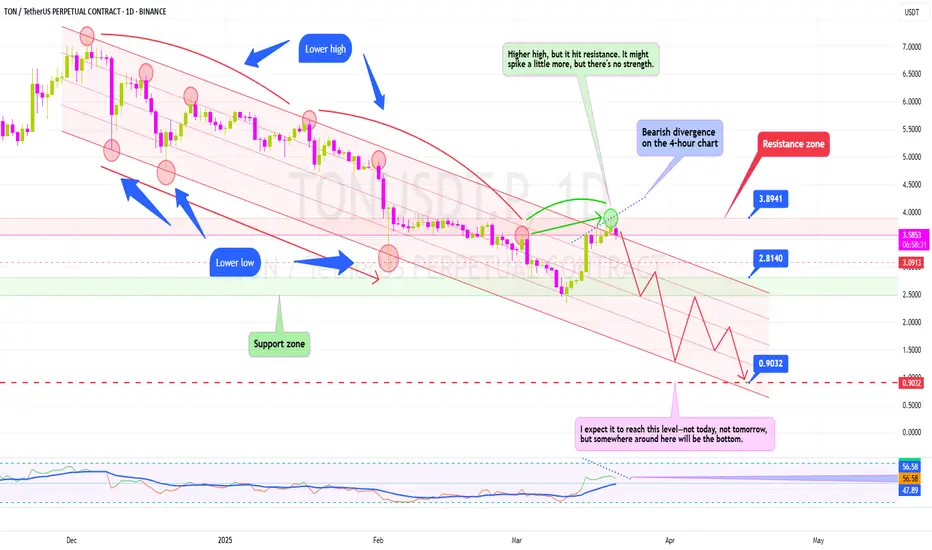
TON – Breakout or Breakdown?TON Coin – Breakout or Breakdown?
🔹 Currently moving in a downward channel.
📉 Lower highs & lower lows – a textbook bearish trend.
🚧 Right at a resistance zone.
Where could it go from here? Let's break it down!
TON’s Current Price Action
The chart clearly shows the downward channel—lower highs, lower lows, signaling trend weakness.
🎯 Right now, price is at resistance. From here, we either see a breakout or a rejection. (Spoiler: I’m leaning towards the latter.)
Why a Rejection Seems Likely
Price is at the top of the channel—if it doesn’t break out, it’s likely to return to the range.
The next key support sits around $2.80, making it a crucial level to watch.
Bearish RSI Divergence
On the 4H chart, RSI isn’t confirming the price action. Price is moving up, but RSI is trending down = classic bearish divergence.
This often signals trend weakness and a potential reversal.
Conclusion
⚠️ If price rejects at resistance, $0.90 is a key target. I expect it to reach this level—not today, not tomorrow, but somewhere around here will be the bottom.
The trend is still down—until we see a strong breakout, short setups remain favorable. If a breakout happens, time to reassess.
Are you bullish or bearish on TON? Drop your thoughts in the comments! 🔽
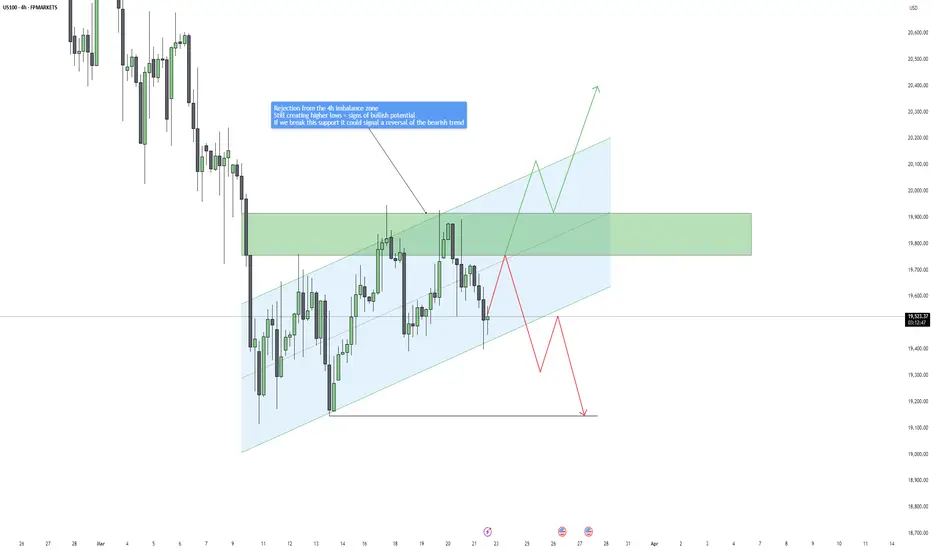
US100 - Testing Key Resistance: Will the 4H Trend Reverse?Market Structure & Trend Overview
The Nasdaq (US100) has been in a 4-hour uptrend, forming a series of higher lows and respecting an ascending channel after a prolonged bearish trend. This structure suggests that buyers are stepping in, and momentum may be shifting in favor of the bulls. However, the index remains at a critical decision point that could determine whether we see a confirmed bullish reversal or a continuation of the larger downtrend.
Key Zone: 4H Imbalance & Resistance Area
Currently, price action is testing a 4-hour imbalance zone, which has already acted as a strong resistance level twice. The market is struggling to break through this supply zone, which is crucial in determining the next major move. If price tests this area again and successfully breaks above it, it could confirm that buyers have gained control, signaling a potential trend reversal back into a bullish phase.
However, if price gets rejected from this level again, it could indicate that sellers are still dominant, increasing the probability of a breakdown from the ascending channel and a resumption of the bearish trend.
Bullish Scenario: Break & Hold Above Imbalance Zone
For a confirmed bullish reversal, Nasdaq must break above the imbalance zone with strong volume and sustain price action above it. A successful breakout could attract more buyers, leading to a push towards higher resistance levels, possibly targeting the $20,000 - $20,300 range in the short term.
Signs to look for in a bullish breakout:
✅ A decisive close above the imbalance zone with strong bullish momentum.
✅ Retesting the broken level as support, confirming it as a new demand zone.
✅ A continuation of higher highs and higher lows after the breakout.
Bearish Scenario: Breakdown of the Ascending Channel
If price fails to break through the imbalance zone and instead rejects for the third time, this could indicate a weakening bullish structure. The key support to watch is the lower boundary of the ascending channel. A confirmed break below this channel could invalidate the short-term uptrend, signaling a return to bearish price action.
If this occurs, Nasdaq could drop towards the key support level at $19,146, a previous liquidity zone where buyers may step in again.
Signs to watch for a bearish breakdown:
❌ A clear rejection from the imbalance zone.
❌ A break and close below the ascending channel.
❌ Increased selling pressure and a shift in market sentiment.
Final Thoughts: A Critical Inflection Point
Nasdaq is at a pivotal moment where the next move will determine the broader trend direction. If bulls can push price above the imbalance zone, we could see a confirmed bullish reversal with upside potential. However, if sellers regain control and force a breakdown of the channel, the downtrend is likely to continue, targeting the $19,146 level as a potential support zone.
Traders should closely monitor price action at the imbalance zone and the ascending channel boundaries, as these key areas will dictate the next major move. Whether we see a trend reversal or continuation, this setup presents significant trading opportunities in either direction.
Key Levels to Watch:
📍 Bullish Breakout Target: $19,900 - $20,000
📍 Bearish Breakdown Target: $19,146
__________________________________________
Thanks for your support!
If you found this idea helpful or learned something new, drop a like 👍 and leave a comment, I’d love to hear your thoughts! 🚀
Make sure to follow me for more price action insights, free indicators, and trading strategies. Let’s grow and trade smarter together! 📈
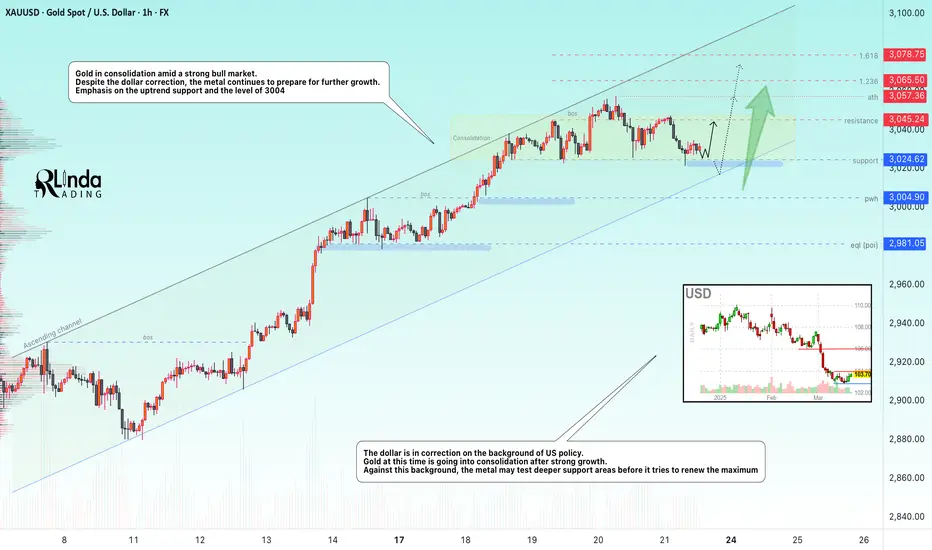
GOLD → Consolidation (correction) before growth to $3100FX:XAUUSD is going into consolidation after strong growth on the back of dollar correction. The metal may test deeper support areas before attempting a new high
Gold is correcting, but remains in an uptrend
The decline in quotations may be seen as a buying opportunity, given the economic uncertainty due to Trump's tariffs and expectations of Fed rate cuts.
The Fed reiterated its forecast of two rate cuts in 2025 despite Powell's cautious comments. Gold is further supported by rising inflation risks and geopolitical tensions in the Middle East.
Resistance levels: 3045, 3057
Support levels: 3024, trending, 3004
Reaction to support is weakening, even amid the uptrend. Gold may stay in this consolidation until the middle of next week, or it may try to break out of the consolidation to retest deeper support zones, such as the rising trend line or the 3004 imbalance zone, from which the growth may resume.
Regards R. Linda!
Gold can continue to grow inside upward channelHello traders, I want share with you my opinion about Gold. This chart shows how the price initially rebounded from the support level, which aligned with the buyer zone, but soon reversed and dropped back down to the support line. After hovering near this line, the price entered a triangle pattern, where it bounced off the resistance line and fell to the support line, breaking below the support level. Following that move, the price reversed upward and returned to the buyer zone, where it consolidated briefly before declining again to the support line. From there, it bounced and began to climb. Shortly after, the price broke through the 2915 level and eventually exited the triangle pattern. From that point, the price started trending upward within an ascending channel, reaching the current support level, which overlaps with a key support area, before rising to the resistance line of the channel. Recently, the price pulled back to the support zone once again, and I believe there’s a good chance it will decline a little below from this area and continue its upward move within the channel, aiming for the resistance line. For this scenario, my TP is set at 3080. Please share this idea with your friends and click Boost 🚀

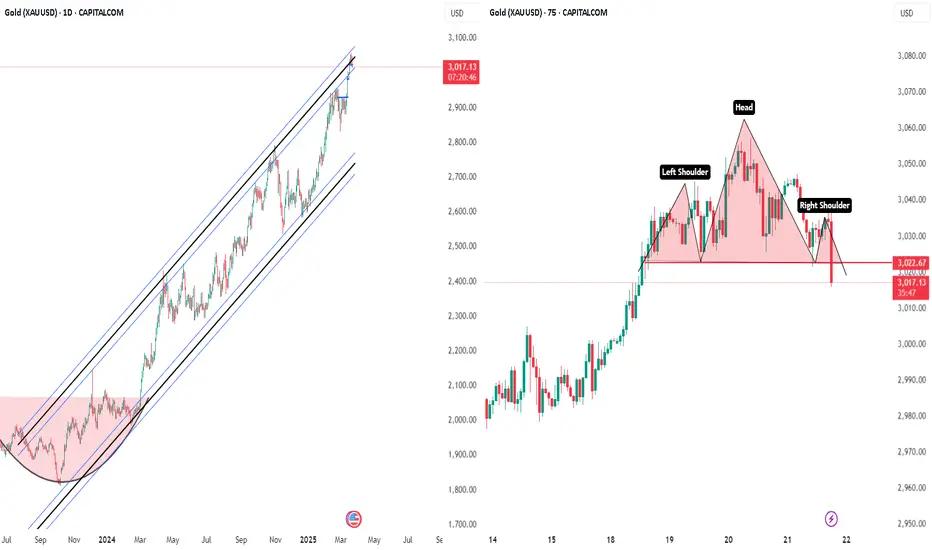
Gold Perfect Candidate to ShortGold is moving in pattern forming head and should pattern at the top, This is perfect candidate to short
BTC: Accumulate energy for the rise and soar into the sky!📍BTC's volatility has narrowed, with selling pressure showing signs of weakening. Throughout the choppy price action, the 84000-83500 zone has established itself as a critical support area in the short-term structure. This level now serves as a key defensive line.
📍Following this consolidation phase, BTC may stage a rebound from this support region. If the price manages to break through the resistance around 84800 with strength, further upside momentum could drive it towards the 90000 level.
🔎Trade Idea:
BTCUSD:Buy at 83500-83000
TP:84500-85000
SL:Adjust according to risk tolerance.
📩Trading means that everything has results and everything has feedback. I have been committed to market trading and trading strategy sharing, striving to improve the winning rate of trading and maximize profits. If you want to copy trading signals to make a profit, or master independent trading skills and thinking, you can follow the channel at the bottom of the article to copy trading strategies and signals

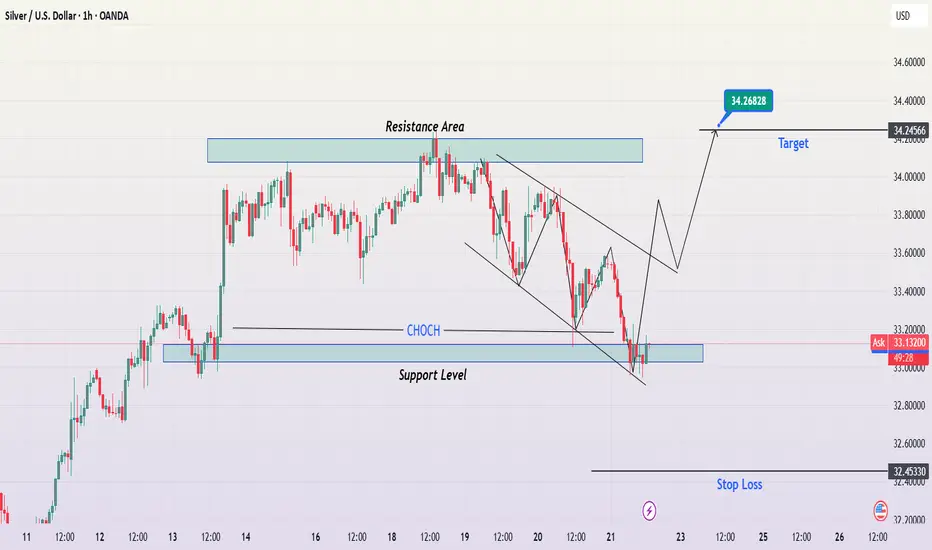
XAG/USD (Silver) – 1H Technical Analysis & Trade SetupThis analysis presents a high-probability bullish trade setup based on key price action principles, market structure, and technical indicators. The chart illustrates a potential reversal from a support zone, a descending channel breakout, and an overall shift in trend dynamics.
1. Market Structure & Key Price Levels
Before placing any trade, it's essential to analyze the bigger picture, including support and resistance levels, trend structure, and liquidity zones. Let's break down the key areas:
A. Resistance Area (Supply Zone) – $34.20 to $34.60
This horizontal resistance zone has historically acted as a selling pressure area where price faced rejection.
It represents a profit-taking zone for bulls and a possible reversal point for bears.
If price successfully breaks and closes above this resistance, it could signal further upside potential.
B. Support Level (Demand Zone) – $32.90 to $33.10
The price has consistently bounced from this region, indicating strong buying interest.
This level has acted as a demand zone, where institutions or large traders are likely accumulating positions.
A strong bullish reaction from this zone strengthens the reversal scenario.
C. Change of Character (CHoCH) – Key Structural Shift
A Change of Character (CHoCH) is marked on the chart, indicating a potential shift from a bearish to a bullish trend.
This is one of the most reliable signals when transitioning from a downtrend to an uptrend.
2. Chart Pattern & Price Action Analysis
A. Descending Channel Formation (Bullish Reversal Pattern)
The market has been forming a descending channel, which is a corrective pattern rather than a continuation pattern.
This structure consists of lower highs and lower lows, indicating short-term selling pressure.
However, when such a pattern forms near strong support, it often precedes a breakout and trend reversal.
A confirmed break above the channel's upper trendline will serve as a bullish breakout signal.
B. Liquidity Grab & Stop Hunt Consideration
Many retail traders place stop-loss orders below the support zone, making it an area of liquidity accumulation.
The market may attempt to sweep these stops before moving up, which aligns with institutional trading behavior.
If price momentarily dips below the support and then quickly reverses with strong bullish momentum, it confirms a stop hunt and a possible reversal setup.
3. Trading Strategy & Setup
To maximize profits while managing risk, we need a well-structured entry, target, and stop-loss strategy.
📌 Entry Strategy
Aggressive Entry:
Enter a buy position within the support zone ($33.00 - $33.10) if bullish price action (e.g., bullish engulfing candle) confirms buying pressure.
Conservative Entry:
Wait for a clear breakout from the descending channel’s upper trendline, then buy on a retest.
This reduces the risk of a fakeout and provides higher confirmation.
🎯 Target Levels (Take Profit Zones)
First Target (TP1) – $34.26
This is a key resistance level where price previously reversed.
Partial profit-taking is recommended here to secure gains.
Second Target (TP2) – $34.60
If momentum continues, price could reach this extended target.
Strong breakout volume would support this move.
🛑 Stop Loss (SL) Placement
Stop-loss should be set below the support zone ($32.45).
This ensures adequate risk management and avoids premature stop-outs.
If price breaks below this level with strong selling volume, the bullish setup is invalidated.
4. Risk Management & Trade Considerations
📌 Risk-to-Reward Ratio (RRR):
The trade setup offers an RRR of at least 1:3, making it a high-probability trade.
📌 Possible Fakeouts & Confirmation Signals:
If price breaks above the descending channel but fails to hold above support, it's a sign of a fake breakout.
Watch for strong bullish volume and clear break of previous lower highs before entering long.
📌 Fundamental Factors:
Keep an eye on economic reports, Federal Reserve speeches, and USD strength, as they heavily influence Silver prices.
5. Conclusion – High-Probability Bullish Setup
Descending channel breakout, strong support level, and CHoCH indicate a potential bullish reversal.
If buyers successfully defend the support zone, price is likely to target $34.26 – $34.60.
Risk management is crucial – waiting for confirmation reduces chances of a failed trade.
🚀 Watch for bullish confirmation before entering!
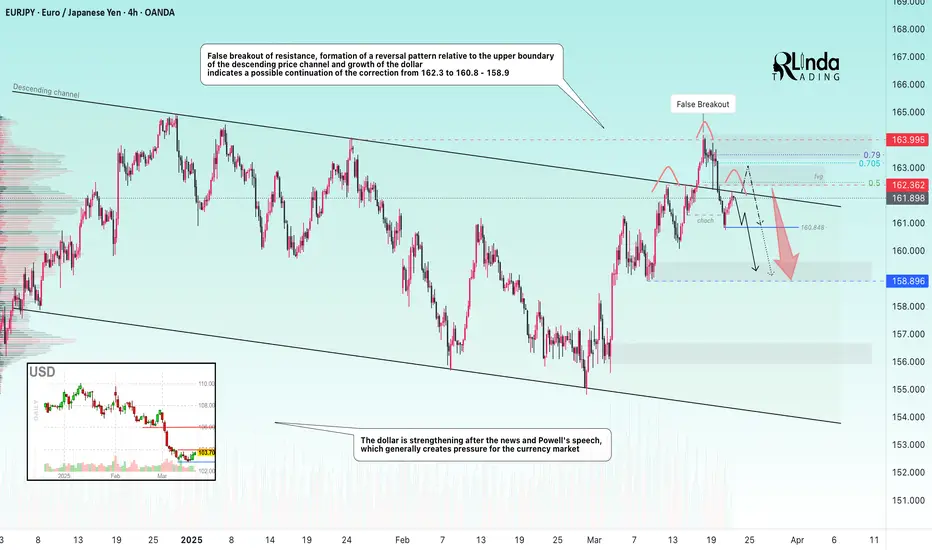
EURJPY → False breakout of key resistance ...FX:EURJPY is forming a false breakdown of resistance and draws us a reversal pattern against the upper boundary of the descending price channel, as well as the pressure on the market creates the correction of the dollar...
On the daily chart the structure is bearish. After the false breakout of the global resistance a correction is formed, within which the price can test the imbalance zone or the previously broken resistance and continue its fall after the liquidity capture. The global trend is neutral and in this case it is worth considering local support levels as targets
Resistance levels: channel boundary, 162.3, 163.0
Support levels: 160.84, 158.9
A retest of the channel resistance or the area of 162.4 - 163 is possible. But any return of the price under the resistance of the descending channel and consolidation of the price in the selling zone may provoke further decline
Regards R. Linda!
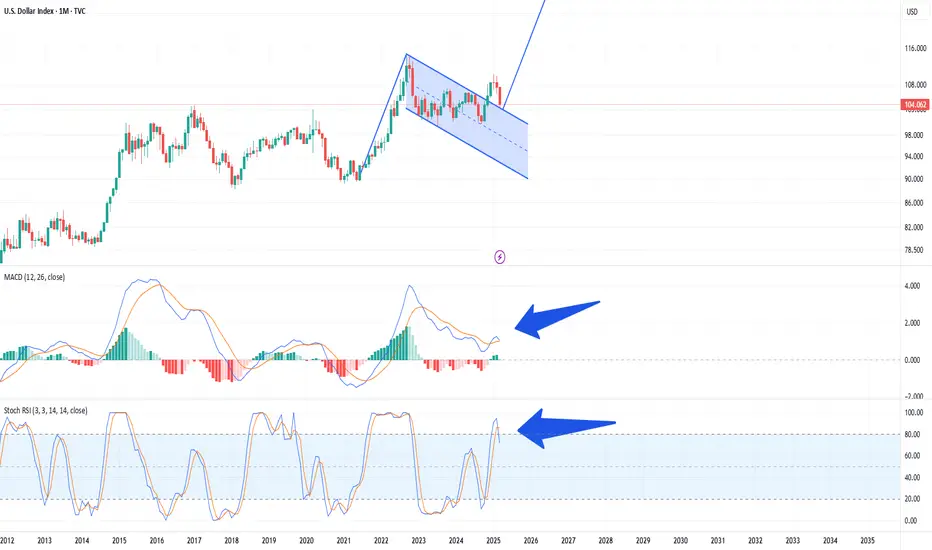
DXY, bullish or bearish?Welcome back!
Today i'm posting a small idea on the DXY. Usually i cover crypto but the macro is important. A weak dollar correlates with more risk being taken and a strong dollar with less risk being taken. Hence my analysis of the DXY.
In the above chart a couple of things can be seen which makes the outlook hard to predict.
On one side there is a bullflag on the monthly timeframe with a target of 130!
On the other side, looking under we can see a bearish MACD cross and a bearish stoch RSI. On average it takes half a year to a year for a cross like this to recover.
This causes me to be bearish on the dollar and bullish on risk-on assets.
Thanks for reading