NATURAL GAS - STILL IN THE GAME TRADING IDEA UPDATE -
NATURAL GAS - STILL IN THE GAME🔥
The XNGUSD goes quite well, as predicted. It held the trendline and moving upwards slowly, but surely. Short-term support here is the EMA20 on 4h timeframe. The asset is just below 3.600 resistance level and sma200. Since the July 10, the asset seems to be moving within the ascending channel (pic 2). I expect that the price will break the 3.6000 resistance level, will go towards upper channel border and then, after quick retest, move towards 3.8000. Not a trading advice! Trade cautiously!
Parallel Channel

NZDCHF → Pre-breakdown consolidation on a downtrendFX:NZDCHF is forming a pre-breakout consolidation amid a downtrend. Focus on support at 0.4759. Global and local trends are down...
On July 10-11, the currency pair attempted to break out of the trend. In the chart, it looks like a resistance breakout, but technically it was a short squeeze aimed at accumulating liquidity before the fall. We can see that the price quickly returned back and the market is testing the low from which the trap formation began. The risk zone for the market is 0.4759 - 0.475. In simple terms, this is a bull trap against the backdrop of a downtrend. The NZD has passed through the risk zone. At this time, the currency pair is forming a pre-breakout consolidation relative to the support level of 0.4759 with the aim of continuing its decline.
Support levels: 0.4759, 0.4753
Resistance levels: 0.477, 0.4782
A breakout of the 0.4759 level and consolidation in the sell zone could trigger a continuation of the decline within the main and local trends.
Best regards, R. Linda!

It's high time to make the header optional.Maybe there's a good chance.
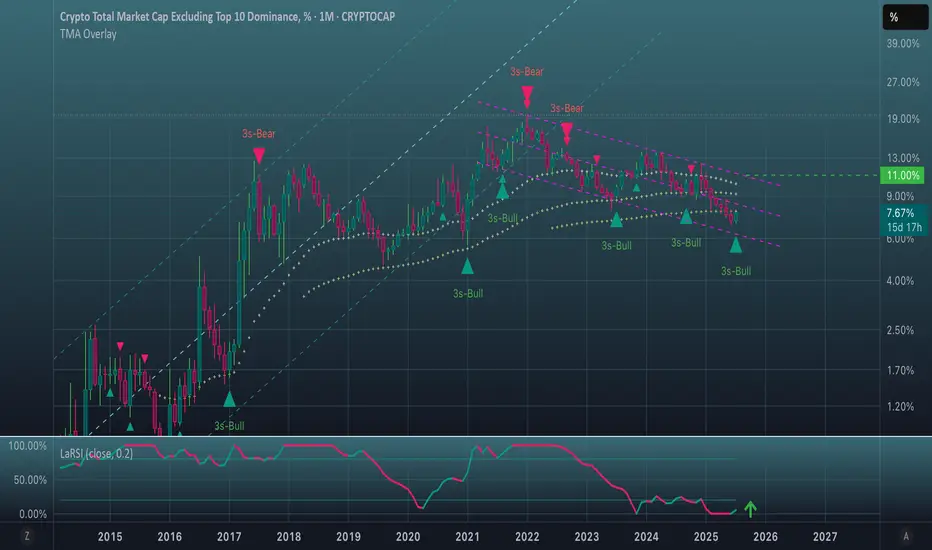
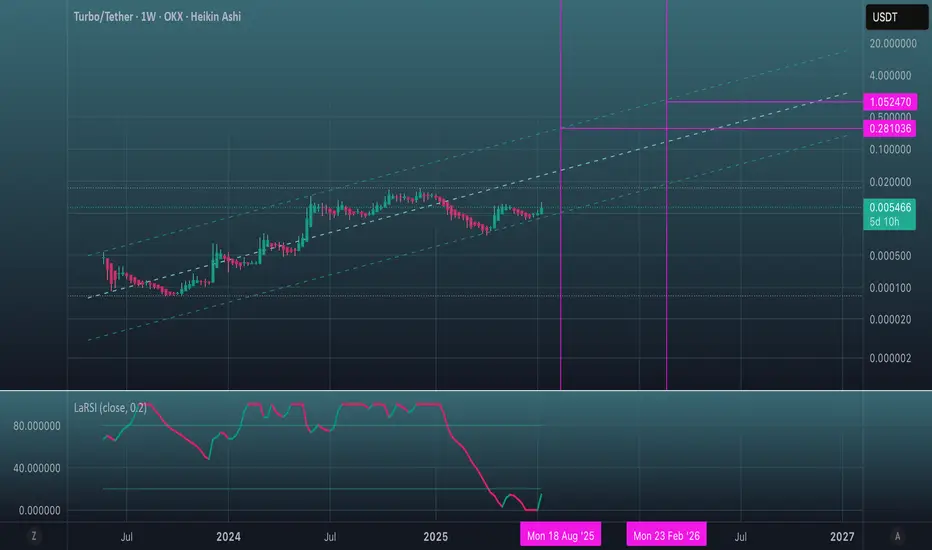
OK, LaRSI on the monthly chart shows that the share of alts could rise significantly.
But there is a bullish correlation with bullish sentiment in the stock market.
However, the candle has gone below the 100 SMMA for the first time.
But at the same time a bullish momentum is forming at this point.
I suggest waiting for the end of the month.
*******************************************************************
But real strength can only be demonstrated
if the candles break out of this channel. Where they are now.
The 10.7%-11% level will be critical.
As usual, no need to call anyone on anything.
EURUSD TRIGGERED STOP LOSSTRADING IDEA UPDATE - EURUSD TRIGGERED STOP LOSS
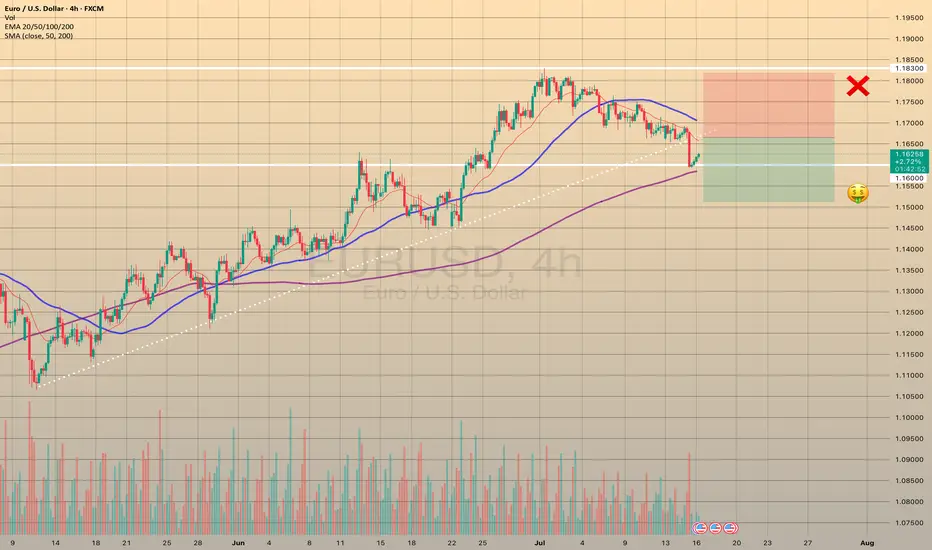
The U.S. CPI report data came out right what the market expected (2.7% vs. 2.7% annually). After this report the pair went downwards on increased volume, triggering my stop loss and found the support only on 4-h sma200 and 1.16000 level.
What will be the possible scenario next?
I assume that the asset will go testing the trendline at 1.16650. If the test is successful, I will consider opening a
🔽 a pending sell stop order at 1.16651 with
❌a stop loss at 1.18180 and
🤑a take profit at 1.15122
Only if the retest is successful, not earlier! Let's observe first. Additionally, today is the U.S. PPI report coming out at 12:30 p.m. UTC, so got to be careful around this time
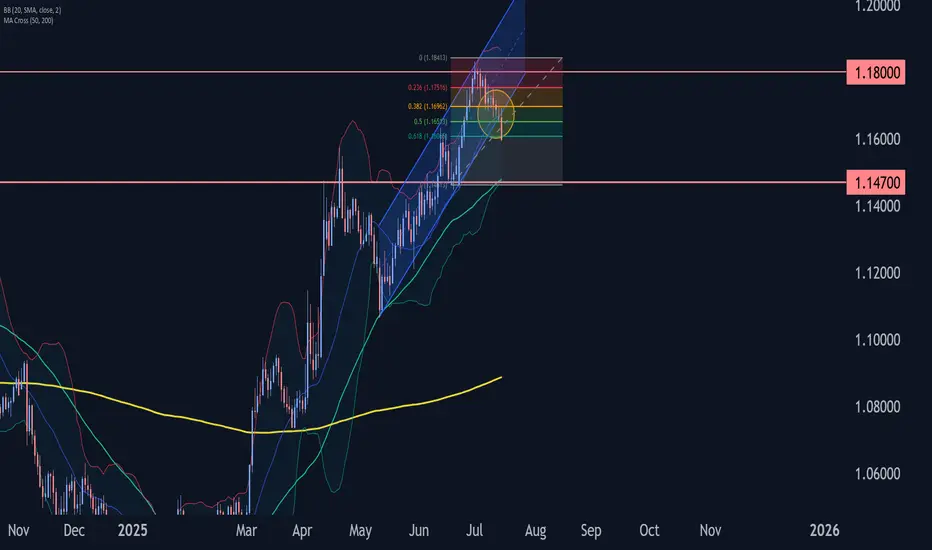
EURUSD Wave Analysis – 15 July 2025- EURUSD broke daily up channel
- Likely to fall to support level 1.1470
EURUSD currency pair recently broke the support area located at the intersection of the support trendline of the daily up channel from May and the 38.2% Fibonacci correction of the upward impulse from June.
The breakout of this support area accelerated the active short-term ABC correction 4.
Given the strongly bullish US dollar sentiment coupled with significant euro pessimism seen today, EURUSD currency pair can be expected to fall further to the next support level 1.1470 (low of former wave iv).
USDCHF Wave Analysis – 15 July 2025
- USDCHF reversed from support zone
- Likely to rise to resistance level 0.8055
USDCHF currency pair recently reversed from the support zone lying at the intersection of the support level 0.7900, lower daily Bollinger Band and the support trendline of the daily down channel from May.
The upward reversal from support zone started the active short-term ABC correction ii.
Given the strongly bullish US dollar sentiment seen today, USDCHF currency pair can be expected to rise to the next resistance level 0.8055 (former strong support from April and June).

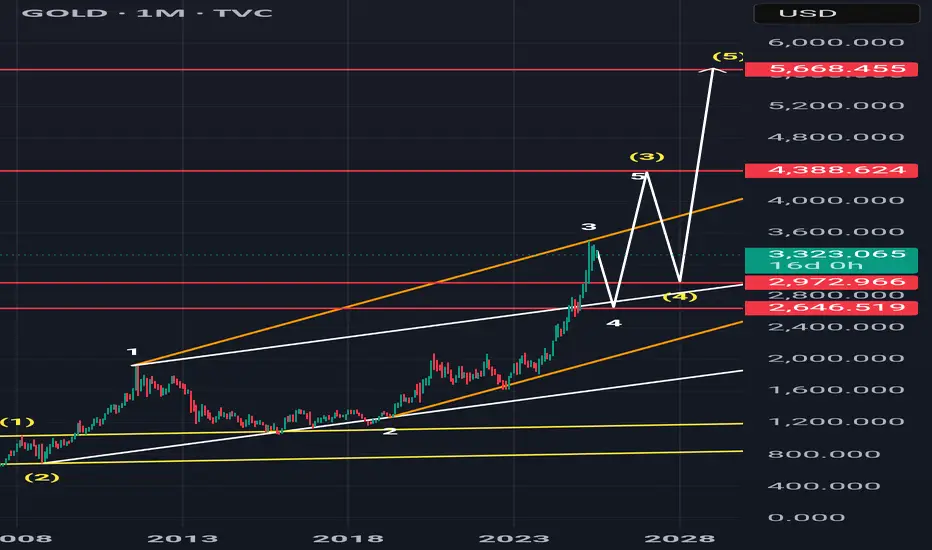
#xauusd #elliottwave short sell setup wave 4 16Jul24This count is based on my assumptions so anything can happen not a trading or financial advice just for educational purposes only kindly do your own ta thanks trade with care good luck.
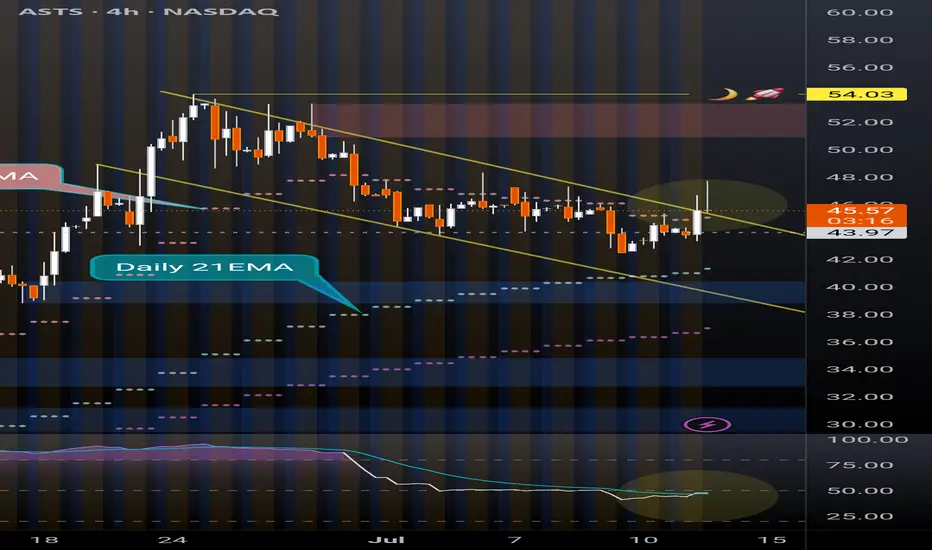
ASTS massive daily bull flagWith the cult like following on this ticker, a 4H break out and hold of this bull flag to the upside could see massive retail money piling in to send the price back to $54 ATH. RSI is also showing potential bullish confluence. The 4H chart has daily EMAs overlayed. The price is currently sitting above the daily 7EMA. Breakout above ATH and it's clear blue skies with no resistance. Huge potential.
AUDUSD good structure for higher bullish
OANDA:AUDUSD whats next, we are have DESCENDING CHANNEL breaked, its followed by bullish push, but its not make to much in my op, at end price is make revers, its stop at end on strong sup zone (0.64900).
We are have in last day-two RBA and RBNZ today, price is start pushing looks like zone 0.64900 can be taked for valid zone, from which now expecting higher bullish push in next periods.
SUP zone: 0.65100
RES zone: 0.66300, 0.66600

Just a couple of lines.Depending on what waves of liquidity will be pumped from bitcoin to slagcoins,
many things are possible. Faster? Lower price.
Slower? More accumulation, stronger level protection.
LaRSI may be preparing to storm the 20 line on the weekly chart.
Positive.
You may agree or disagree, at your discretion.
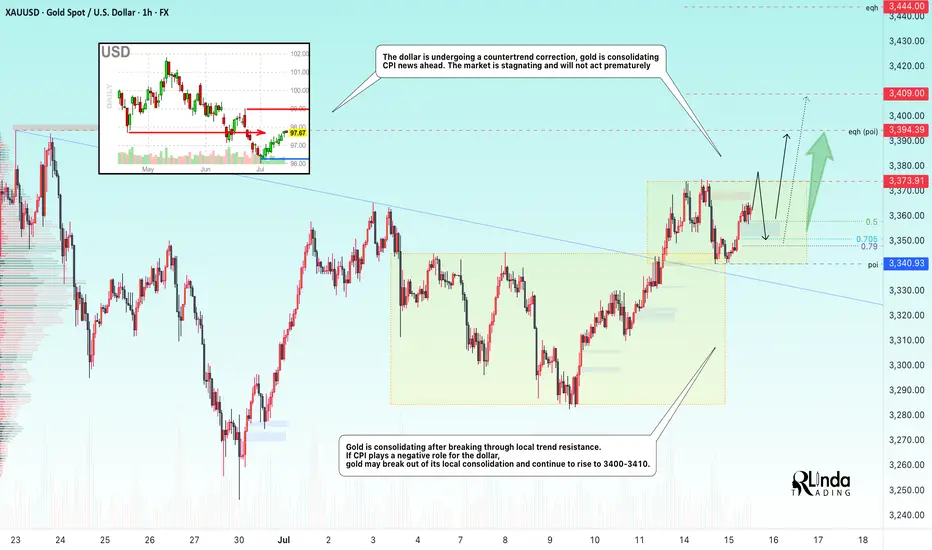
GOLD → Consolidation ahead of CPI. Chances for growth?FX:XAUUSD Gold is consolidating amid a correction in the dollar ahead of important news. Consumer price index data is due later today. The market is stagnant and will not move prematurely.
On Tuesday, gold rose slightly amid profit-taking ahead of the US CPI release. Investors are waiting for a signal from inflation: weaker data could strengthen bets on a Fed rate cut and support gold, while strong inflation would strengthen the dollar and put pressure on the metal. The situation is exacerbated by Trump's new tariff threats and his criticism of the Fed chair. Let me remind you of Trump's pressure on regulators regarding inflation and interest rate cuts.
Technically, gold is trading above the previously broken “symmetrical triangle” consolidation. Bulls are trying to hold their ground above 3340-3350. Focus on the current range of 3340-3373
Resistance levels: 3373, 3394
Support levels: 3350, 3340
Favorable news for gold could boost interest in the metal, which would generally lead to growth. However, there is a factor of unpredictability, and against this backdrop, gold may test support at 3350-3340. If the bulls manage to keep the price above this zone, we may see growth in the medium term. Otherwise, the price may drop to 3310-3280.
Best regards, R. Linda!
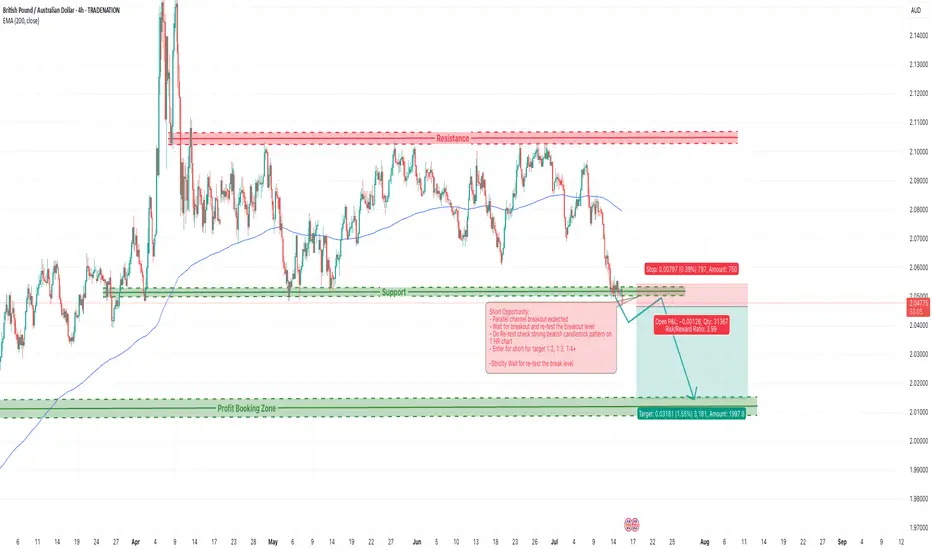
GBPAUD Weekly Trade Setup–Parallel Channel Breakdown Opportunity1. Overview of GBPAUD Technical Setup
As of 15th July 2025, the GBPAUD 4-hour chart reflects a price currently positioned at a critical support level around 2.0470–2.0480, which has held multiple times since early April. The price action leading to this point has formed a classic descending parallel channel, with price making lower highs and testing horizontal support with increased frequency.
Key observations:
Price is well below the 200 EMA (currently around 2.0794), confirming a bearish long-term bias.
The resistance zone at 2.1070–2.1120 has proven strong over time, pushing back multiple rallies.
Price is compressing — getting squeezed into the lower boundary of the channel with shorter pullbacks, often a precursor to breakout.
The setup is aligning for a high-probability short trade, with a potential move toward the next major demand zone around 2.0100.
The Breakdown Thesis – What We See on the Chart
The current structure of GBPAUD tells a very clear story:
After a rally in early April, price has been trading within a consolidation range, failing to make higher highs.
The support around 2.0470 has now been tested repeatedly with lower bounces each time.
Price recently made a lower high and returned to support with momentum, increasing the probability of a breakdown.
We are expecting a bearish breakout of this support level, followed by a re-test of the broken zone, and then a strong downside continuation.
Risk Management Strategy
Every trade setup — no matter how technically perfect — must begin with a strong risk management plan.
For this GBPAUD setup:
Entry Trigger: Breakdown below 2.0470 and successful re-test rejection with bearish candle confirmation
Stop Loss: Above re-test high; ideally, just above 2.0530 (~66 pips risk)
Target 1: 2.0300 (170+ pips)
Target 2: 2.0200
Target 3 / Final: 2.0100 (potential 370+ pip move)
This gives us an excellent Risk:Reward ratio of ~1:5 or more, allowing traders to be wrong several times and still remain profitable over time.
Opportunities in the market don’t come from guessing — they come from waiting. The GBPAUD parallel channel setup is a brilliant example of structure-based trading that combines logic with discipline. Whether you're a full-time FX trader or a part-time swing participant, setups like these are where consistency is built.
Watch the breakdown. Wait for the re-test. Execute only when the market confirms your plan.
Happy Trading!
=================================================================
Disclosure: I am part of Trade Nation's Influencer program and receive a monthly fee for using their TradingView charts in my analysis.
=================================================================
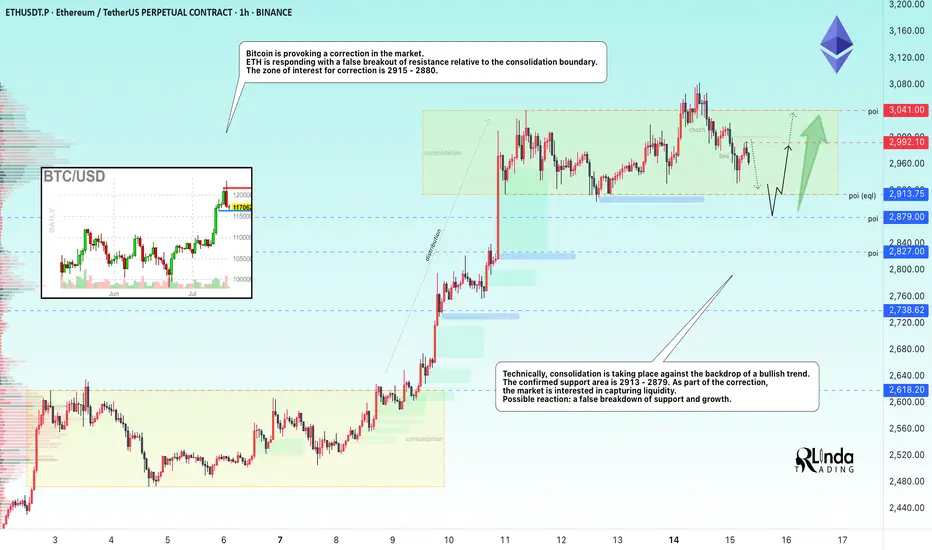
ETHEREUM → Correction to 2900 before growth BINANCE:ETHUSDT is entering a correction after a strong breakout of resistance. At the same time, Bitcoin is falling from 123K to 116K, triggering a pullback across the entire market...
On D1, ETH is facing strong resistance and is not yet ready to break it (it lacks strength after the rally). The most likely scenario after a false breakout is a correction to support. But the main focus is on Bitcoin — will there be a correction or a reversal of the local trend? If the flagship continues its decline, the cryptocurrency market will humbly follow suit.
ETH has a nearest zone of interest at 2913, where liquidity capture could attract buyers, but I do not rule out the possibility that the correction could go much deeper before further growth, for example to 2879-2827 (support on D1).
Resistance levels: 2992, 3041
Support levels: 2913.7, 2879, 2827
Technically, consolidation against a bullish trend. Confirmed support area 2913 - 2879. As part of the correction, the market is interested in capturing liquidity. If, against the backdrop of the current correction, the bulls manage to hold their ground above the specified support, ETH may still surprise us with its growth :)
Best regards, R. Linda!
ETHUSD REACHED NEW HIGH - SHORT OPPORTUNITY
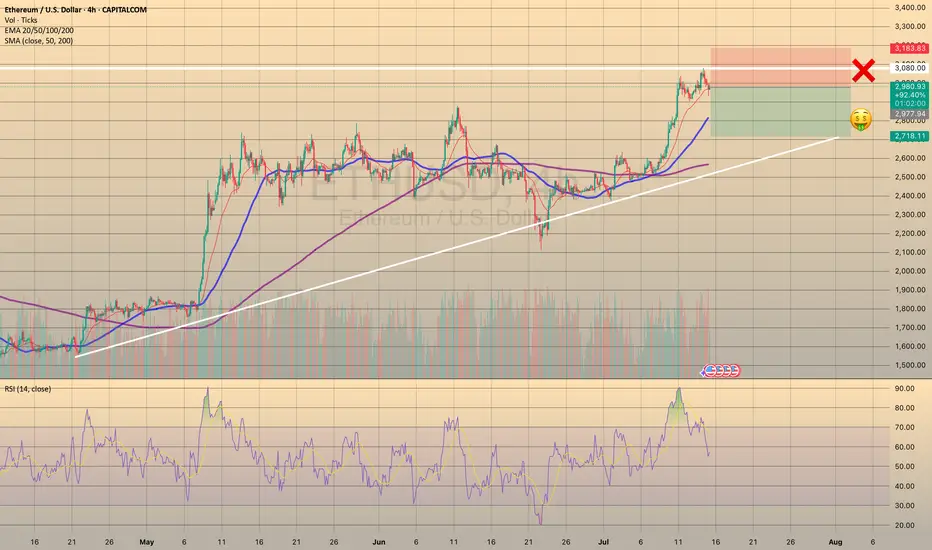
TRADING IDEA - ETHUSD REACHED NEW HIGH - SHORT OPPORTUNITY📉
The same as BTCUSD, ETHUSD has reached a new maximum at 3.083.52. After that the asset went sideways, waiting for some impulse. I see strong divergence on 4h timeframe on RSI and expect a decline within next 24-48 hours. Basically, it is the same story here as with the bitcoin, cause the nature of the recent hike is also the same. So, I put a
🔽 a market sell order at 2977.94 with
❌a stop loss at 3183.83 and
🤑a take profit at 2718.11
It is a counter-trend trade, so it's a bit more risky than usual.
Trade cautiously! Preserve your deposits!
MarketBreakdown | GBPAUD, WTI CRUDE OIL, US30, US100
Here are the updates & outlook for multiple instruments in my watch list.
1️⃣ #GBPAUD daily time frame 🇬🇧🇦🇺
The market is trading within a wide horizontal parallel channel.
The price is stuck on its support.
Probabilities will be high that the market will start growing from that.
Alternatively, its bearish breakout will provide a strong bearish signal.
2️⃣ #WTI CRUDE OIL daily time frame 🛢️
The price is now testing a significant rising trend line.
It is a critical decision moment for the market.
A bearish breakout of that may trigger a strong bearish continuation.
Monitor intraday price action today. If you see a strong bullish pattern,
it will provide a reliable confirmation to buy,
3️⃣ DOW JONES INDEX #US30 daily time frame
The market started a correction movement in
a bullish flag pattern.
Your next signal to buy will be a breakout of its resistance
and a daily candle close above that.
4️⃣ NASDAQ INDEX #US100 daily time frame
The market is now breaking a resistance of a horizontal parallel channel.
IF a today's daily candle closes above that, it will confirm a start of
another bullish wave.
The market will continue growing then.
Do you agree with my market breakdown?
❤️Please, support my work with like, thank you!❤️
I am part of Trade Nation's Influencer program and receive a monthly fee for using their TradingView charts in my analysis.

EURUSD SEEMS TO FIND SUPPORT
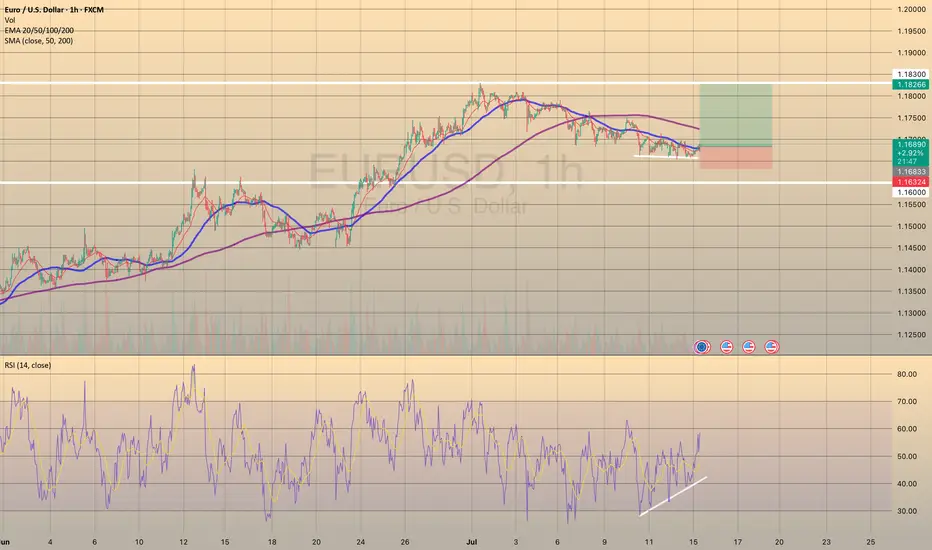
TRADING IDEA UPDATE - EURUSD SEEMS TO FIND SUPPORT🦾
EURUSD seems to find support on a trendline and shows us divergence on RSI on 1-h timeframe. So, I decided to close my trade in advance before my stop loss gets triggered and open long position with a
🔼 a market buy order at 1.16833 with
❌a stop loss at 1.16324 and
🤑a take profit at 1.18266
Additionally, today is the U.S. CPI report data coming out. Market expects the annual inflation to be around 2.7%. Me, personally, think that actual June inflation will be a bit lower, which may provide some fundamental support to the EURUSD. Will see.
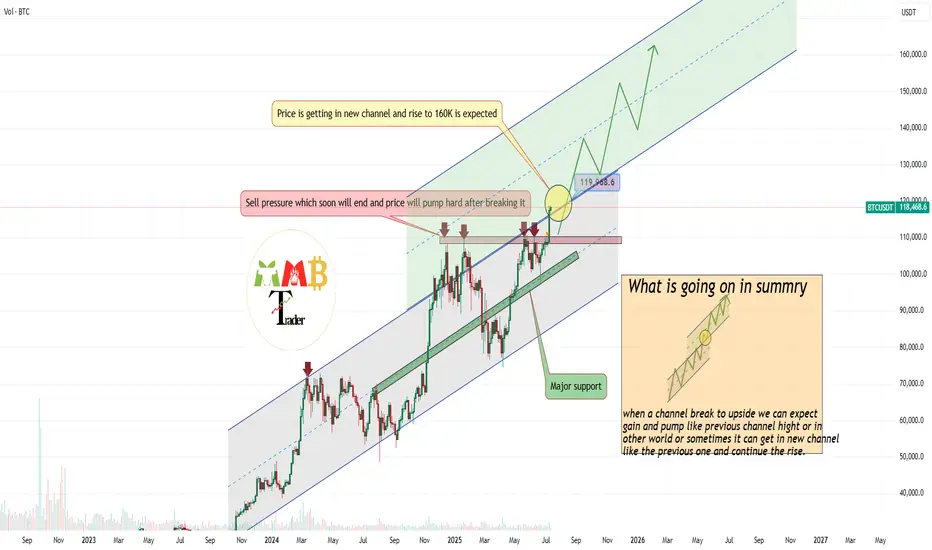
Bitcoin in New Ascending channel wait for 160K$As we can see Price broke previous ATH & channel resistance together and is holding strong, if it continue soon new channel is path to claim for Price based on chart and targets like 160K is just easy to hit.
So get Ready for new Highs and ATH here also this breakout to upside was mentioned in previous analysis and now that it is happening don't get surprise if you see notifications like Bitcoin new ATH 150K$.
DISCLAIMER: ((trade based on your own decision))
<<press like👍 if you enjoy💚
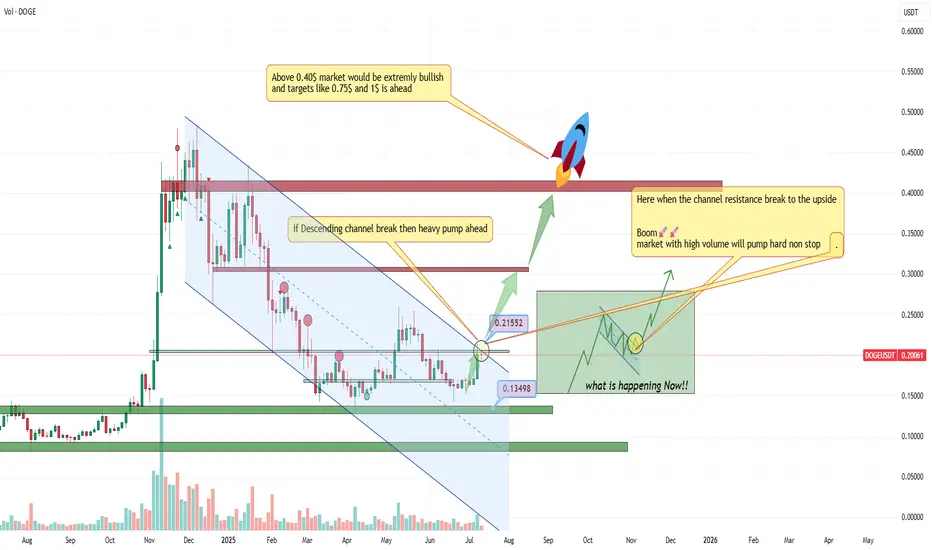
Wooow DOGEUSDT breakout happening Major resistance which is 0.22$ and is also channel resistance is breaking and BINANCE:DOGEUSDT would be nonstop bullish after that at least for a while to the targets like 0.40$ and 0.60$.
As we can see on the chart here is last valid and strong resistance zone after that i am expecting nonstop rise for This token which is still sleep and soon will follow the market and also lead with daily +15% candles.
DISCLAIMER: ((trade based on your own decision))
<<press like👍 if you enjoy💚
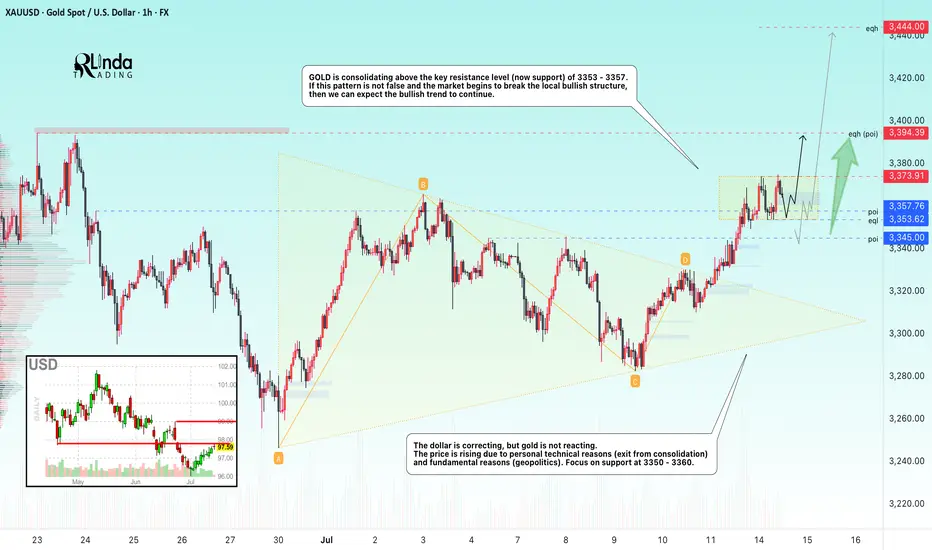
GOLD → Consolidation. Long squeeze before growth to 3400FX:XAUUSD has broken through resistance at 3353-3357 since the session opened, and bulls are currently trying to keep the market in the buying zone. Should we expect a long squeeze before growth?
Gold is in local consolidation after breaking through a key level. The price is still in the consolidation phase formed during a week-and-a-half correction. The price reached a three-week high of $3,374 on Monday but fell after the EU's conciliatory statements. Investors are awaiting US inflation data and Chinese GDP figures as they assess the prospects for a Fed rate cut. Heightened geopolitical and trade tensions are keeping demand for safe-haven assets high.
Technically, gold has entered a local buying zone, but there is a fairly complex resistance zone above it, and consolidation is needed to break through it. Such patterns could include a retest of support and a liquidity grab before growth.
Resistance levels: 3373, 3394
Support levels: 3357, 3353, 3345
There is a possibility of a retest of eql 3353 in a long squeeze format and a return to resistance at 3373 for a breakout. I also do not rule out a retest of the key level of 3345. The global trend is bullish, with the price locally in a fairly wide range, with an emphasis on the support zone of 3345-3355. If the bulls can hold this zone overall, the market will have a good chance of rising to 3400-3450
Best regards, R. Linda!
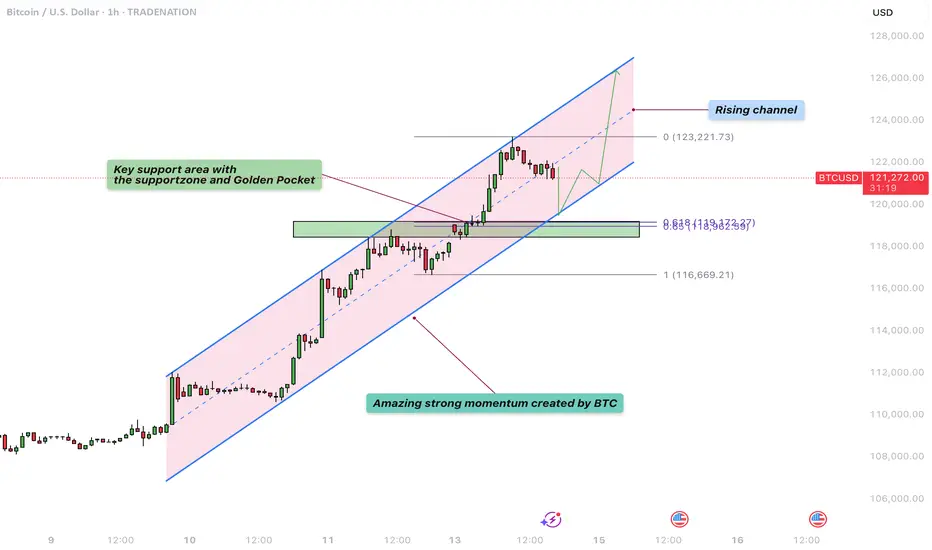
Bitcoin – Rising channel with critical support at $119.000!The chart presented shows Bitcoin in a well-defined rising channel, highlighting a strong bullish momentum over recent trading sessions.
Rising channel
The price action is currently oscillating within the boundaries of this upward sloping channel, marked by parallel trendlines. The channel suggests that Bitcoin has been consistently making higher highs and higher lows, with the current price hovering around $121,794. The upper boundary near $123,200 acts as potential resistance, while the lower boundary of the channel provides dynamic support, suggesting a continuation pattern if this structure holds.
Uptrend
The overall uptrend is clearly visible and remains strong, especially since July 10th, where a significant bullish breakout occurred. The breakout was followed by steady gains, with minimal pullbacks, indicating strong buying interest and market confidence. The momentum shows a healthy bullish structure with minimal price overlap, characteristic of a trending market, which favors continuation as long as critical support levels remain intact.
Support area
A critical element in this chart is the key support area, highlighted in green. This support zone is located between approximately $118,500 and $119,600. This zone was previously a resistance level that has now turned into support following the breakout. It also aligns with the mid-level of the rising channel, reinforcing its significance. Should the price retrace, this area is likely to act as a cushion where buyers may step in again to defend the trend.
Fibonacci
Additionally, the chart features a Fibonacci retracement drawn from the swing low to the current swing high. The 0.618 Fibonacci level is particularly noteworthy, sitting at around $119,623. This level is known as the “golden ratio” in technical analysis and often acts as a strong retracement level during corrections. Below it, the 1.0 level is marked at $116,669, which represents a full retracement of the move and a deeper correction scenario if the support fails. These Fibonacci levels coincide with the key support zone, further validating it as an area of high confluence and likely buying interest.
Final thoughts
Overall, the technical structure remains bullish within the rising channel, with key levels of interest lying around $119,600 for support and $123,200 for potential resistance. A successful defense of the support area could propel the price higher toward the channel’s upper bound, while a breakdown may lead to a test of deeper Fibonacci retracement levels.
Disclosure: I am part of Trade Nation's Influencer program and receive a monthly fee for using their TradingView charts in my analysis.
Thanks for your support. If you enjoyed this analysis, make sure to follow me so you don't miss the next one. And if you found it helpful, feel free to drop a like and leave a comment, I’d love to hear your thoughts!
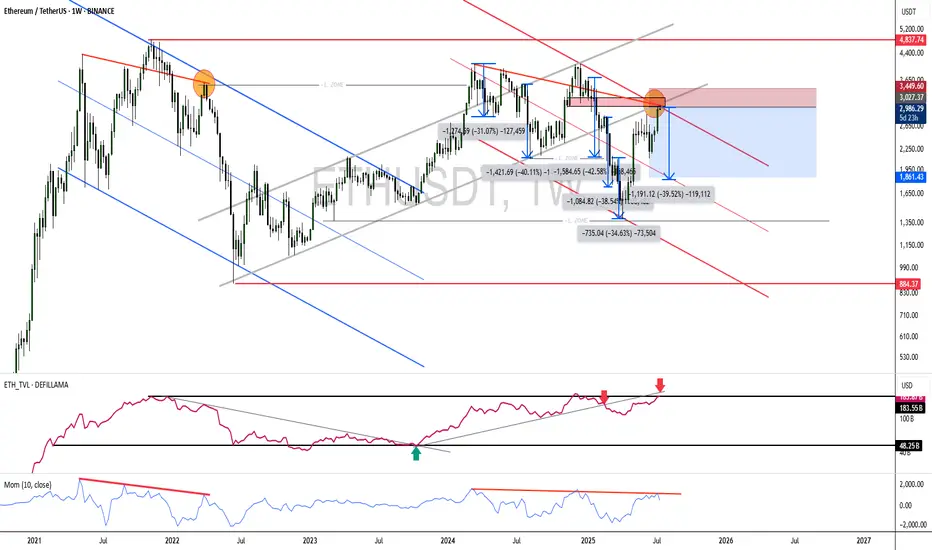
Is ETH overextended and due for a correction?For those holding ETH, this is a good point to set up a hedge using derivatives.
If the price keeps going up (which I think is unlikely at this moment—perhaps it will move sideways), buying at these levels is crazy.
In fact, there’s been a recent rally, full of people on X and YouTube saying this is the big moment to buy… That immediately raises a red flag for me!
And what about the FEDFUNDS? Have you taken a look? Haha, just something to think about.
--
After a long time away from TradingView and the community, I’m back to breathe some life into it!
Missed you all — let’s enjoy life and make the most of what it has to offer!
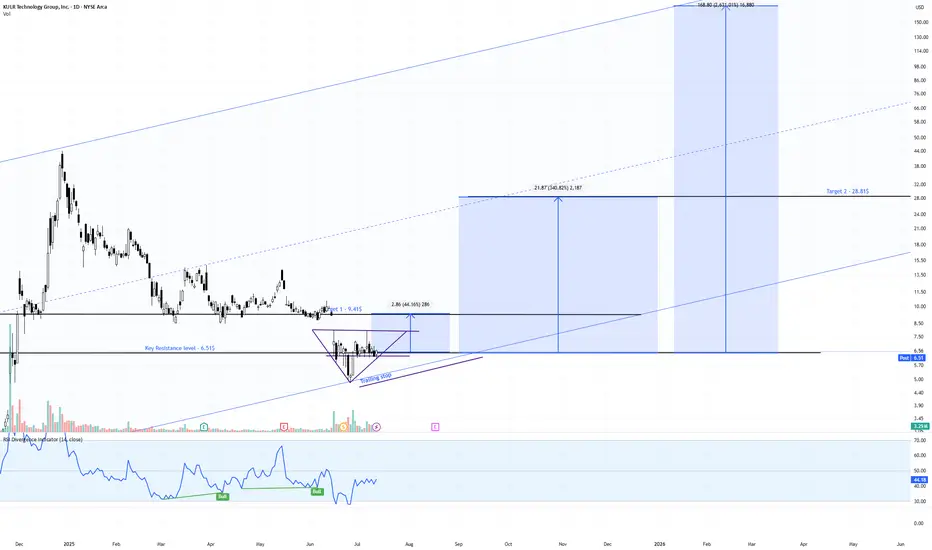
KULR Daily Watch – Triangle Squeeze Loading📍 Price Action:
Sitting tight at $6.50, coiling inside a clean symmetrical triangle. Last fake-out under support didn’t confirm → bulls still holding the line.
📊 Pattern Probabilities (Bulkowski):
Symmetrical triangles break ~54–60% in trend direction. Post-breakout moves hit ~60–75% of measured height → decent odds for upside here.
✅ Volume contracting = typical pre-breakout behavior
✅ RSI divergence still bullish
✅ Channel since 2023 intact, macro structure supports trend-following
🎯 Targets & RR Setup:
Trigger zone: $7.20–$7.50
Target 1: $9.45 (+31% | RR ~2.5:1)
Target 2: $28.81 (+298% | RR ~12:1)
Target 3 (channel top): $168.12 (+2,368% | moonshot 🌙)
⏳ Next Step:
Break over $7.50 = green light for Target 1. We’re trailing stops below the rising trendline to lock in gains without killing the move early.
#KULR #TrianglePattern #BreakoutWatch #TargetTraders #StockMarket
Silver Wave Analysis – 14 July 2025
- Silver reversed from resistance zone
- Likely to fall to support level 37.00
Silver recently reversed down from the resistance zone lying at the intersection of the resistance level 39.00, upper weekly Bollinger Band and the resistance trendline of the weekly up channel from 2023.
The downward reversal from resistance zone created the daily Japanese candlesticks reversal pattern Shooting Star.
Given the strength of the nearby resistance zone and the overbought weekly Stochastic, Silver can be expected to fall to the next support level 37.00.
