AUDCAD / GBPAUD Trade Recaps 01.08.25A tester trade on AUDCAD with the reasons explained as to why this was a test position, and a short position executed on GBPAUD. Solid setup that this time around just didn't commit.
Full explanation as to why I executed on these positions and the management plan with both.
Any questions you have just drop them below 👇
Patterns

01.08.25 Morning ForecastPairs on Watch -
FX:EURJPY
FX:EURGBP
A short overview of the instruments I am looking at for today, multi-timeframe analysis down to what I will be looking at for an entry. Enjoy!

31.07.25 Morning ForecastPairs on Watch -
FX:GBPAUD
FX:AUDCAD
FX:AUDCHF
A short overview of the instruments I am looking at for today, multi-timeframe analysis down to what I will be looking at for an entry. Enjoy!

30.07.25 Morning ForecastPairs on Watch -
FX:AUDUSD
FX:NZDUSD
FX:EURUSD
A short overview of the instruments I am looking at for today, multi-timeframe analysis down to what I will be looking at for an entry. Enjoy!

29.07.25 Morning ForecastPairs on Watch -
FX:EURGBP
FX:AUDUSD
FX:NZDUSD
A short overview of the instruments I am looking at for today, multi-timeframe analysis down to what I will be looking at for an entry. Enjoy!

28.07.25 Morning ForecastPairs on Watch -
FX:EURCAD
FX:GBPUSD
OANDA:XAUUSD
FX:EURUSD
A short overview of the instruments I am looking at for today, multi-timeframe analysis down to what I will be looking at for an entry. Enjoy!

25.07.25 Morning ForecastPairs on Watch -
FX:USDJPY
CAPITALCOM:DE40
FX:GBPUSD
FX:AUDUSD
A short overview of the instruments I am looking at for today, multi-timeframe analysis down to what I will be looking at for an entry. Enjoy!

24.07.25 Morning ForecastPairs on Watch -
FX:GBPCAD
FX:GBPUSD
FX:AUDNZD
A short overview of the instruments I am looking at for today, multi-timeframe analysis down to what I will be looking at for an entry. Enjoy!

Bullish Cup & Handle Pattern Formed 🚨 SEED_WANDERIN_JIMZIP900:WIF Testing Red Resistance – Bullish Cup & Handle Pattern Formed 📈
SEED_WANDERIN_JIMZIP900:WIF is currently testing the red resistance zone and has formed a bullish cup and handle pattern on the chart.
If a breakout occurs, potential upside toward:
✅ First Target: Green line level
✅ Second Target: Green line level
Wait for breakout confirmation before entering long. 📊
Patience is key—watch this closely! 💼💸

23.07.25 Morning ForecastPairs on Watch -
FX:GBPUSD
CAPITALCOM:DE40
FX:NZDUSD
A short overview of the instruments I am looking at for today, multi-timeframe analysis down to what I will be looking at for an entry. Enjoy!

22.07.25 Morning ForecastPairs on Watch -
FX:GBPJPY
FX:AUDUSD
OANDA:XAUUSD
FX:GBPUSD
A short overview of the instruments I am looking at for today, multi-timeframe analysis down to what I will be looking at for an entry. Enjoy!

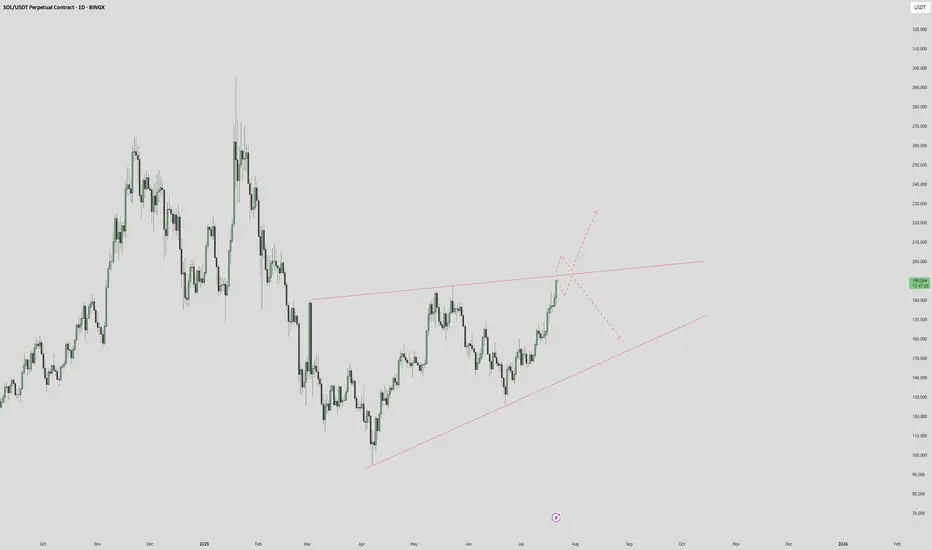
SOLANA $250 INCOMING? or $150 again?We can see a wedge is forming, price is at a major point, break above with a failed break below the resistance - we see high potential for $250.
Failed breakthroughs and a rejection? We see $150 once more.
Thoughts?
21.07.25 Morning ForecastPairs on Watch -
FX:GBPAUD
FX:EURUSD
FX:AUDUSD
OANDA:XAUUSD
A short overview of the instruments I am looking at for today, multi-timeframe analysis down to what I will be looking at for an entry. Enjoy!

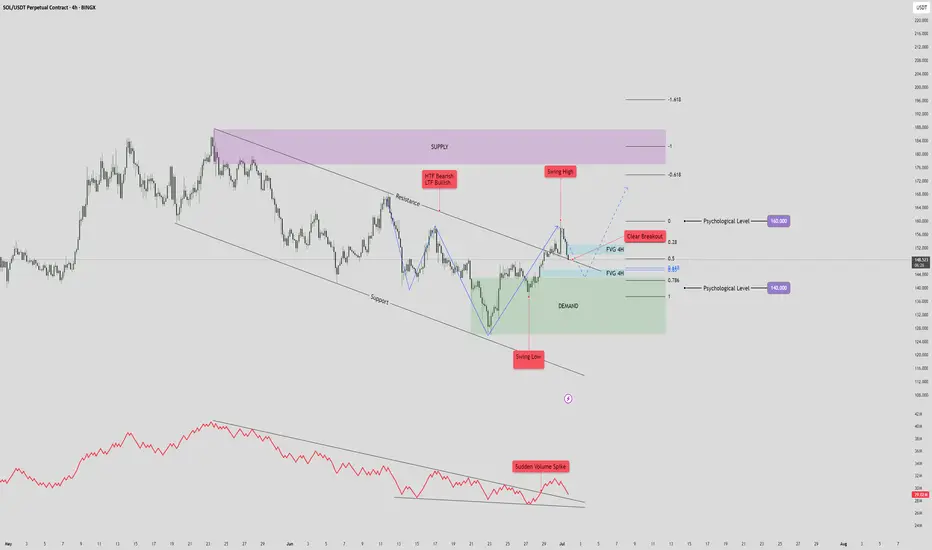
Solana (SOL/USDT) 4H Reverse H&S PatternSolana (SOL/USDT) – 4H Market Outlook | July 1, 2025
Introduction
SOL has formed a reverse head and shoulders pattern, followed by a clean breakout above resistance. While the lower time frame is bullish, the higher time frame remains bearish, creating a short-term opportunity within a broader downtrend.
Context 1: Key Zones
Supply Zone: 176 – 187
Demand Zone: 126 – 143
Psychological Levels: 140 and 160
Context 2: Technical Structure
Pattern: Reverse Head & Shoulders
Breakout: Confirmed above neckline/resistance
FVGs:
One below price (within demand)
One above price (potential target)
Golden Pocket: Sits just above lower FVG and inside demand — strong confluence support
Context 3: Volume Insight
OBV Indicator: Shows a sudden volume spike, adding strength to the breakout and the bullish pattern confirmation.
Bullish Scenario
Price pulls back into the golden pocket + FVG + demand zone
Finds support → bounces to form higher low
Second leg of the move breaks swing high → targets upper FVG and 160 psychological level
Bearish Scenario
Price breaks back below demand zone and invalidates the golden pocket
Fails to hold structure → reverts to macro bearish trend
Potential retest of previous swing low below 126
Summary
SOL is showing bullish momentum on the 4H after completing a reversal pattern and spiking in volume. A pullback into the demand zone confluence may offer a strong long setup — but failure to hold could revalidate the higher timeframe downtrend.
18.07.25 Morning ForecastPairs on Watch -
FX:GBPAUD
FX:EURAUD
FX:EURNZD
FX:EURCAD
A short overview of the instruments I am looking at for today, multi-timeframe analysis down to what I will be looking at for an entry. Enjoy!

17.07.25 Morning ForecastPairs on Watch -
OANDA:US30USD
CAPITALCOM:DE40
FX:GBPJPY
A short overview of the instruments I am looking at for today, multi-timeframe analysis down to what I will be looking at for an entry. Enjoy!

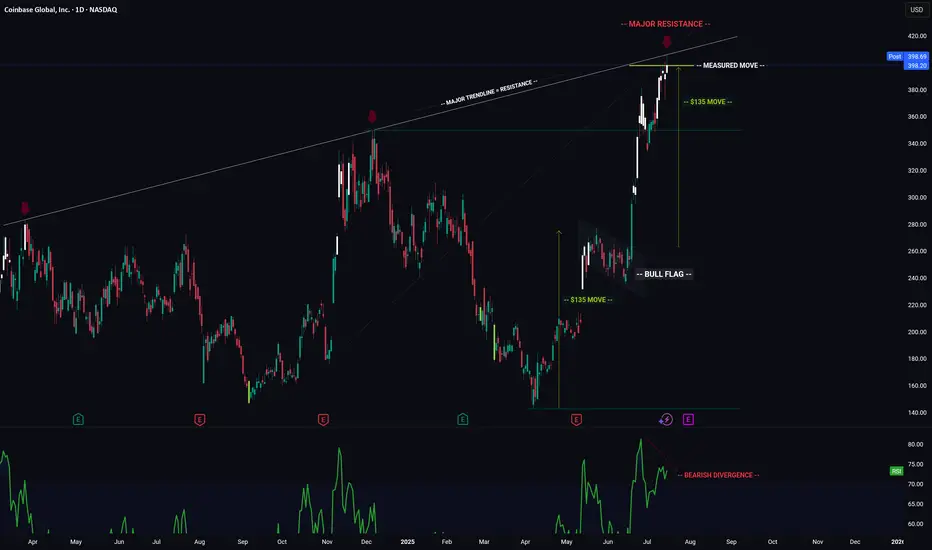
COIN -- Major Trendlines + Bearish Divergence = Breakdown?Hello Traders!
Today I have shared the chart of COINBASE. Of course we cant know for sure what price will do, however you can take clues and combine them to give you a high probability reading of the chart.
Here are the clues:
1) MAJOR TRENDLINE
2) TRENDLINE
3) BEARISH DIVERGENCE
4) BULL FLAG MEASURED MOVE
When we combine these clues, a very bearish picture is painted... This signals to me that there is a high probability price will likely reverse and trade to the downside in the near future.
I hope everyone enjoyed this post and is able to use it as an educational tool.
Thanks everyone and best of luck on your trading journey!
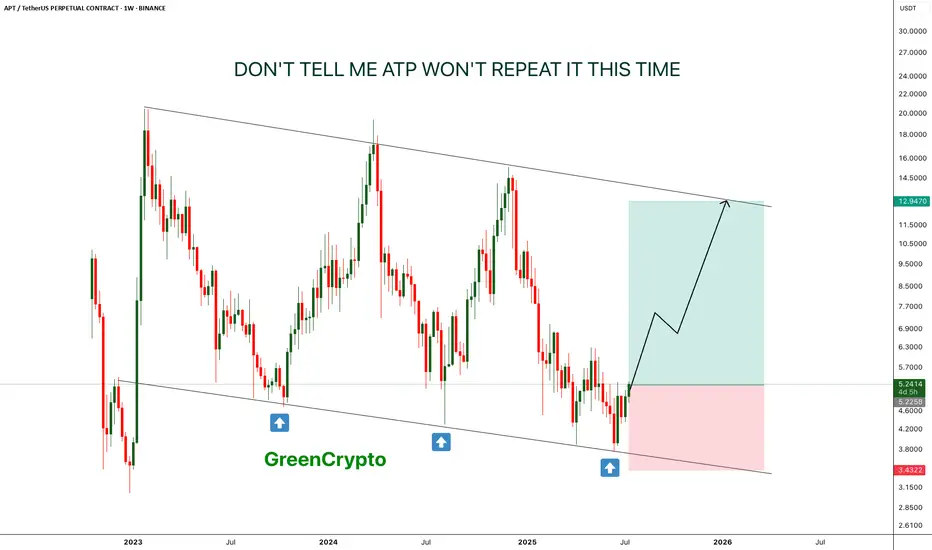
APT - Don't tell me this pattern won't repeat- This time is the charm, APT is is reversing from lower low on weekly chart.
- just like last two time, it is expect to forma new HL.
- there is a high chance that previous two patterns will repeat again
Entry Price: 5.22
Stop Loss: 3.4
TP1: 6.6632
TP2: 8.5059
TP3: 12.6945
Max Leverage: 5x
Don't forget to keep stoploss
Cheers
GreenCrypto
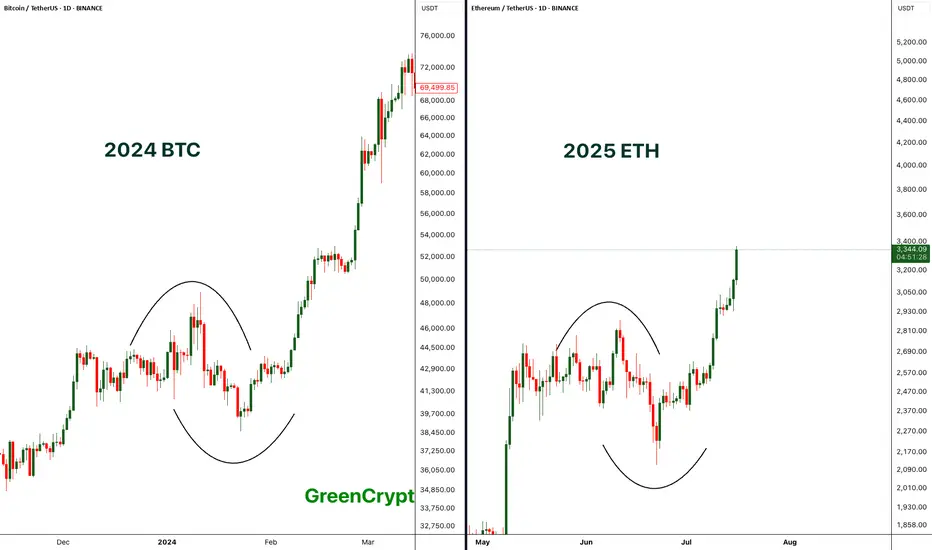
Comparing BTC 2024 with ETH 2025 - Perfect Match- If compare the chart pattern of BTC from 2024 with the current 2025 ETH pattern, wee see exactly similar chart patterns being formed here.
- Price started consolidating then it had fake breakout towards both the sides and finally the real breakout.
- BTC breakout push the price towards the new all time high above 69K, if we ETH follows similar trend then we can expect new all time high on ETH.
Let's see how it plays out.
Stay tuned for more updates.
Cheers
GreenCrypto
16.07.25 Morning ForecastPairs on Watch -
FX:GBPJPY
FX:GBPNZD
FX:USDJPY
A short overview of the instruments I am looking at for today, multi-timeframe analysis down to what I will be looking at for an entry. Enjoy!

15.07.25 Morning ForecastPairs on Watch -
FX:EURUSD
CAPITALCOM:DE40
FX:EURGBP
FX:GBPJPY
A short overview of the instruments I am looking at for today, multi-timeframe analysis down to what I will be looking at for an entry. Enjoy!

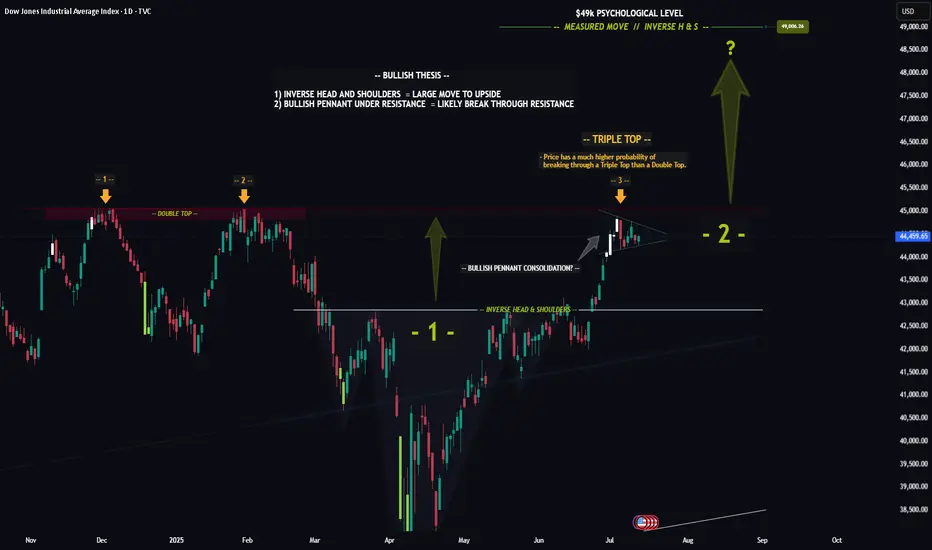
DOW (DJI) -- Preparing For The Next Big Move?Hello Traders!
The chart of the DOW is really quite incredible... Recently price formed a textbook Inverse Head & Shoulders pattern, which led to a nice nearly to the all time high. Furthermore price looks to be consolidating in a Bullish Pennant just below the all time high resistance level.
The reason the Pennant below resistance is so significant is because this signals that investors are likely preparing to drive price higher to new highs. Think about it like a fighter resting before the next big fight.
Triple Top: In addition to the pennant price has now hit this resistance level for the 3rd time. The more times price hits a level typically the weaker it gets. After the 3rd hit the chance of a breakout increases dramatically.
In Summary: The "Triple Top" in conjunction with the "Bullish Pennant" means that there is undoubtedly a very high probability that price will breakout and make new all time highs.
This post is primarily meant to be educational vs a trade idea. Its charts like this that invigorate my technical analysis side and I hope it does for you as well.
Best of luck on your trading journey!
14.07.25 Morning ForecastPairs on Watch -
FX:NZDCAD
FX:USDJPY
FX:EURUSD
OANDA:US30USD
A short overview of the instruments I am looking at for today, multi-timeframe analysis down to what I will be looking at for an entry. Enjoy!
