17.06.25 Morning ForecastPairs on Watch -
FX:EURUSD
FX:CADCHF
OANDA:XAUUSD
A short overview of the instruments I am looking at for today, multi-timeframe analysis down to what I will be looking at for an entry. Enjoy!
Patterns

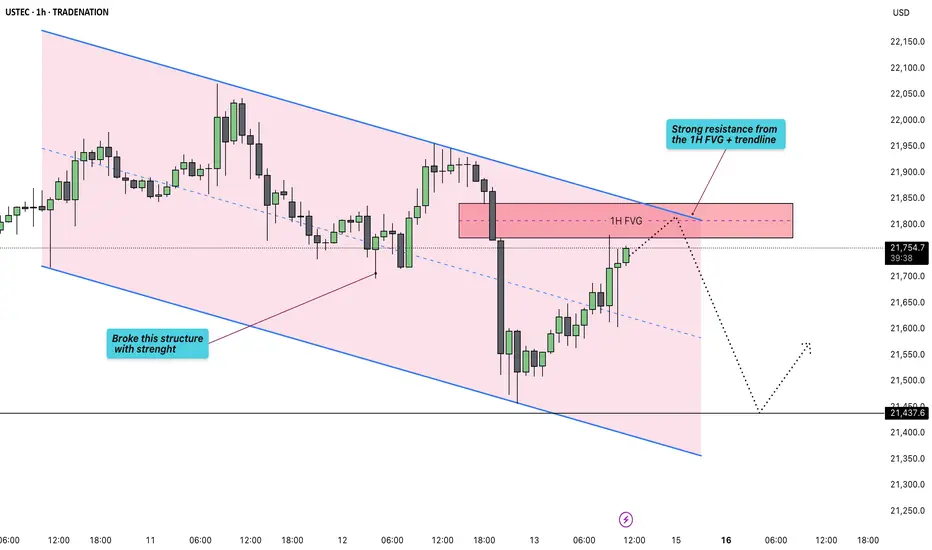
US100 - Trading within a bearish parallel channel!Introduction
The US100 is currently trading within a well-defined parallel channel to the downside, consistently finding support along the lower trendline and facing resistance near the upper boundary. This structure has led to a clear pattern of lower lows and lower highs on the 1H timeframe. Most recently, price action broke market structure, and we now anticipate a reaction near a high-confluence resistance area.
Parallel Channel
A distinct parallel channel has been developing on the US100 over the past several days on the 1H timeframe. During last night's move, the price touched the lower boundary of the channel and has been trending upward since. After breaking above the midline at $21,640, momentum suggests a potential continuation toward the upper boundary of the channel around $21,830.
FVG
During the most recent downward move, the US100 created a significant 1H Fair Value Gap (FVG), stretching from $21,775 to $21,840. This zone represents a key imbalance that could generate a strong reaction to the downside if price revisits it.
Conclusion
Given the break in structure on the 1H timeframe, short-term upward moves are likely to face resistance. The confluence between the upper boundary of the parallel channel and the 1H FVG creates a high-probability area for price rejection, making it a critical level to watch for potential downside pressure.
Disclosure: I am part of Trade Nation's Influencer program and receive a monthly fee for using their TradingView charts in my analysis.
Thanks for your support.
- Make sure to follow me so you don't miss out on the next analysis!
- Drop a like and leave a comment!
16.06.25 Morning ForecastPairs on Watch -
FX:NZDUSD
FX:CADJPY
OANDA:XAUUSD
FX:EURCAD
A short overview of the instruments I am looking at for today, multi-timeframe analysis down to what I will be looking at for an entry. Enjoy!

13.06.25 Morning ForecastPairs on Watch -
FX:GBPUSD
FX:EURUSD
A short overview of the instruments I am looking at for today, multi-timeframe analysis down to what I will be looking at for an entry. Enjoy!

12.06.25 Morning ForecastPairs on Watch -
OANDA:JP225USD
FX:AUDJPY
FX:USDJPY
FX:GBPJPY
A short overview of the instruments I am looking at for today, multi-timeframe analysis down to what I will be looking at for an entry. Enjoy!

10.06.25 Morning ForecastPairs on Watch -
FX:GBPJPY
FX:EURJPY
FX:USDCHF
A short overview of the instruments I am looking at for today, multi-timeframe analysis down to what I will be looking at for an entry. Enjoy!

06.06.25 Morning ForecastPairs on Watch -
FX:EURUSD
FX:AUDUSD
FX:USDJPY
FX:AUDCAD
A short overview of the instruments I am looking at for today, multi-timeframe analysis down to what I will be looking at for an entry. Enjoy!

05.06.25 Morning ForecastPairs on Watch -
FX:AUDUSD
OANDA:XPTUSD
A short overview of the instruments I am looking at for today, multi-timeframe analysis down to what I will be looking at for an entry. Enjoy!

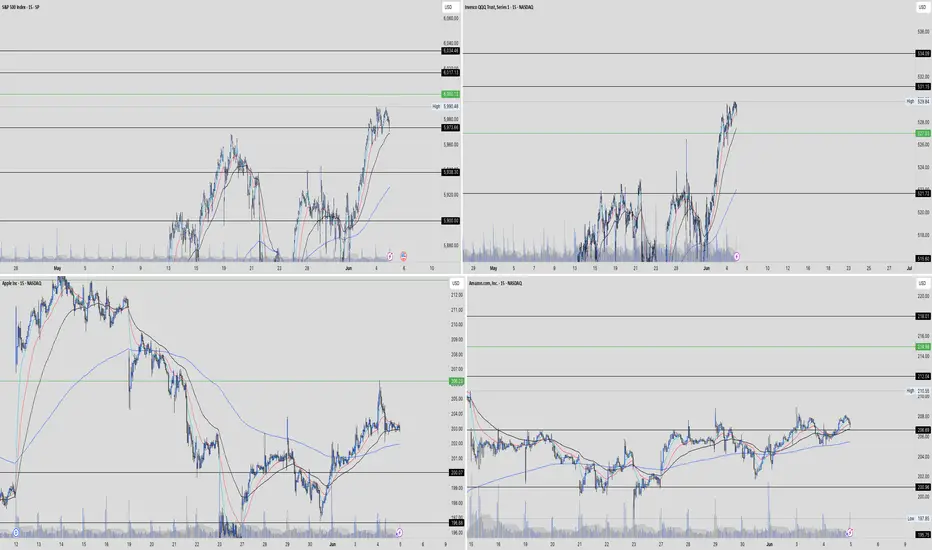
Andycharts, publishing key levels. We have key levels across 15 different charts which I am looking at tomoorow for contination,
OptionsMastery: Inverse head and shoulders on UAL! 🔉Sound on!🔉
📣Make sure to watch fullscreen!📣
Thank you as always for watching my videos. I hope that you learned something very educational! Please feel free to like, share, and comment on this post. Remember only risk what you are willing to lose. Trading is very risky but it can change your life!

04.06.25 Morning ForecastPairs on Watch -
FX:EURUSD
FX:USDJPY
FX:GBPCHF
OANDA:XPTUSD
A short overview of the instruments I am looking at for today, multi-timeframe analysis down to what I will be looking at for an entry. Enjoy!

03.06.25 AUDUSD Trade Recap (Breakeven Manual Close)A long position taken on AUDUSD for a breakeven manual close, full explanation as to why I made this decision in the recap and my current thoughts on this pairs next move

03.06.25 Morning ForecastPairs on Watch -
FX:EURUSD
FX:GBPAUD
FX:AUDUSD
FX:AUDCAD
A short overview of the instruments I am looking at for today, multi-timeframe analysis down to what I will be looking at for an entry. Enjoy!

02.06.25 Morning ForecastPairs on Watch -
FX:AUDUSD
FX:USDJPY
FX:EURGBP
A short overview of the instruments I am looking at for today, multi-timeframe analysis down to what I will be looking at for an entry. Enjoy!

30.05.25 Morning ForecastPairs on Watch -
FX:EURUSD
A short overview of the instruments I am looking at for today, multi-timeframe analysis down to what I will be looking at for an entry. Enjoy!

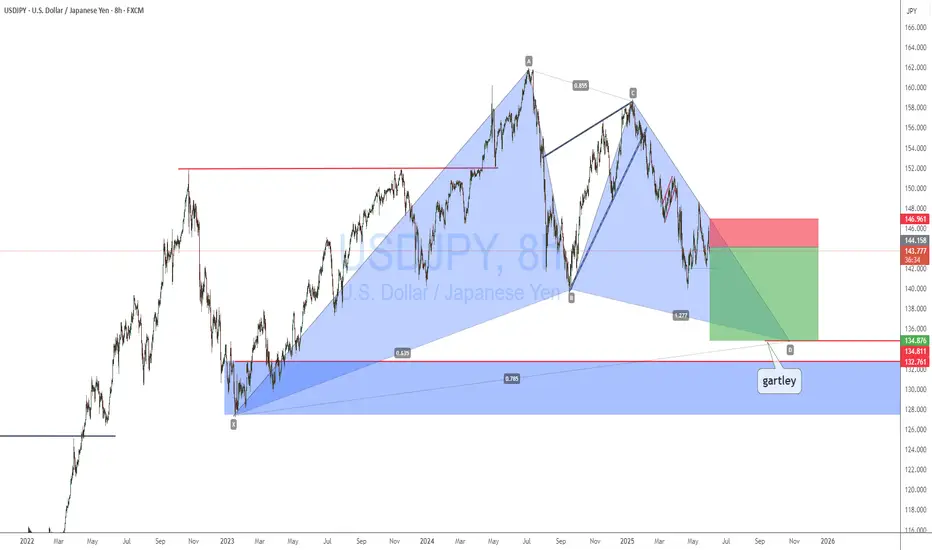
USDJPY SHORTUSDPY is expected to sell to complete the gartley pattern.
Look out for the quasimodo pattern on the 4hr or 8hr time frame to short
29.05.25 Morning ForecastPairs on Watch -
FX:AUDCAD
FX:EURUSD
TVC:USOIL
FX:GBPJPY
A short overview of the instruments I am looking at for today, multi-timeframe analysis down to what I will be looking at for an entry. Enjoy!

28.05.25 Morning ForecastPairs on Watch -
OANDA:AU200AUD
FX:GBPAUD
A short overview of the instruments I am looking at for today, multi-timeframe analysis down to what I will be looking at for an entry. Enjoy!

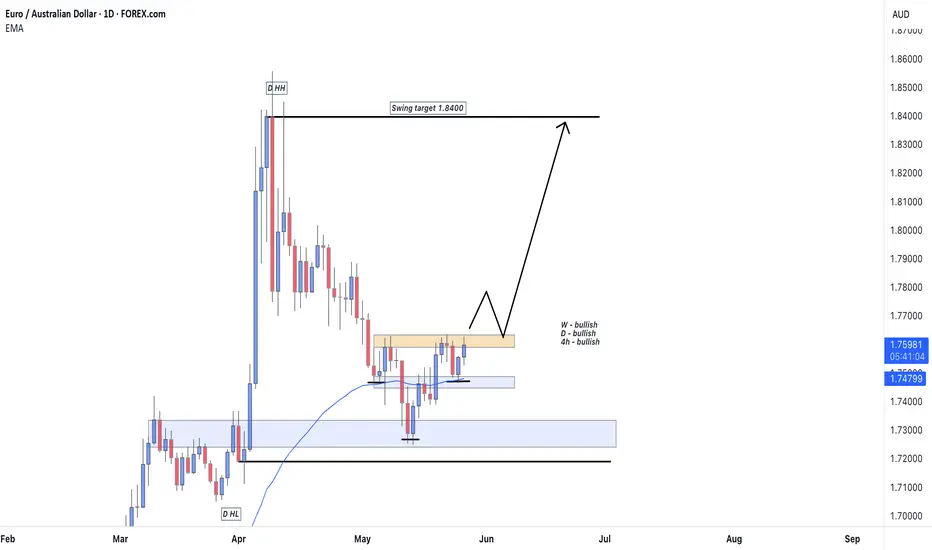
EURAUD Swing Trade (Long)After seeing price come into the premium of the daily structure and a strong level of daily support we are now seeing an inverted head and shoulders pattern, which can be seen on the daily and 4h timeframes.
If we see a daily candle break and close above the orange resistance zone (which is also the neckline of the inverted head and shoulders pattern) then i will be looking for price to come back to retest the neckline to target the daily HH (1.8400)
27.05.25 Morning ForecastPairs on Watch -
FOREXCOM:COFFEE
FX:GBPAUD
A short overview of the instruments I am looking at for today, multi-timeframe analysis down to what I will be looking at for an entry. Enjoy!

26.05.25 Morning ForecastPairs on Watch -
FOREXCOM:COFFEE
FX:GBPAUD
FX:EURAUD
A short overview of the instruments I am looking at for today, multi-timeframe analysis down to what I will be looking at for an entry. Enjoy!

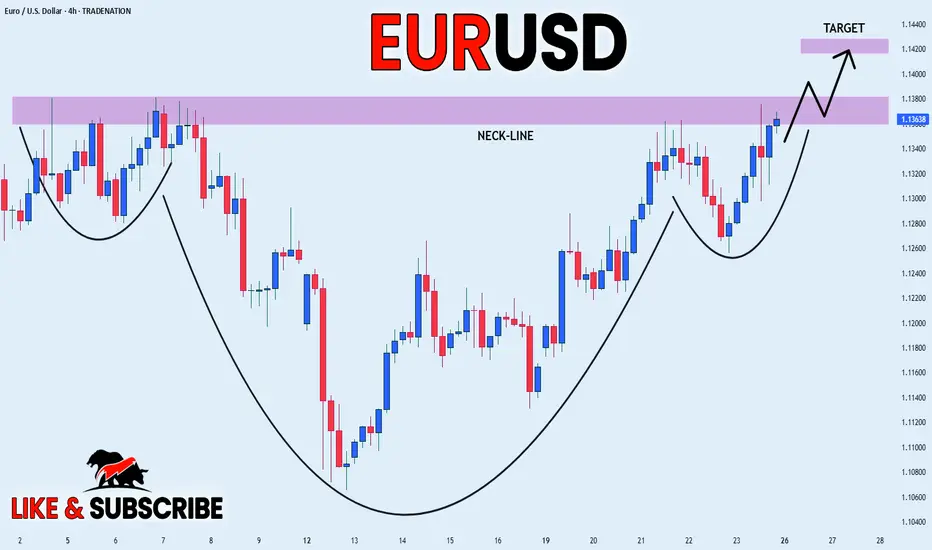
EUR_USD HEAD AND SHOULDERS|LONG|
✅EUR_USD has formed a
Head and Shoulders pattern
And the pair has now formed
The last leg of it, so we are
Bullish biased and IF we see
A bullish breakout of the
Neckline of 1.1380 next week
Then we will be expecting a
Further bullish move up
LONG🚀
✅Like and subscribe to never miss a new idea!✅
Disclosure: I am part of Trade Nation's Influencer program and receive a monthly fee for using their TradingView charts in my analysis.
23.05.25 Morning ForecastPairs on Watch -
FX:CADJPY
FX:AUDCAD
A short overview of the instruments I am looking at for today, multi-timeframe analysis down to what I will be looking at for an entry. Enjoy!
