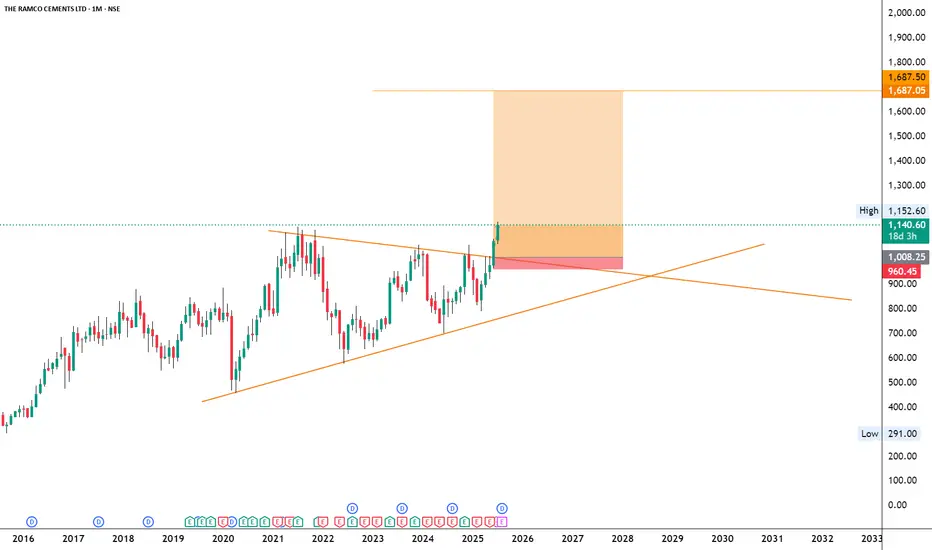
RAMCOCEM
NSE:RAMCOCEM
Note :
1. One should go long with a Stop Loss, below the Trendline or the Previous Swing Low.
2. Risk :Reward ratio should be minimum 1:2.
3. Plan your trade as per the Money Mangement and Risk Appetite.
Disclamier :
>You are responsible for your profits and loss.
>The idea shared here is purely for Educational purpose.
>Follow back, for more ideas and their notifications on your email.
>Support and Like incase the idea works for you.
Patterntrading
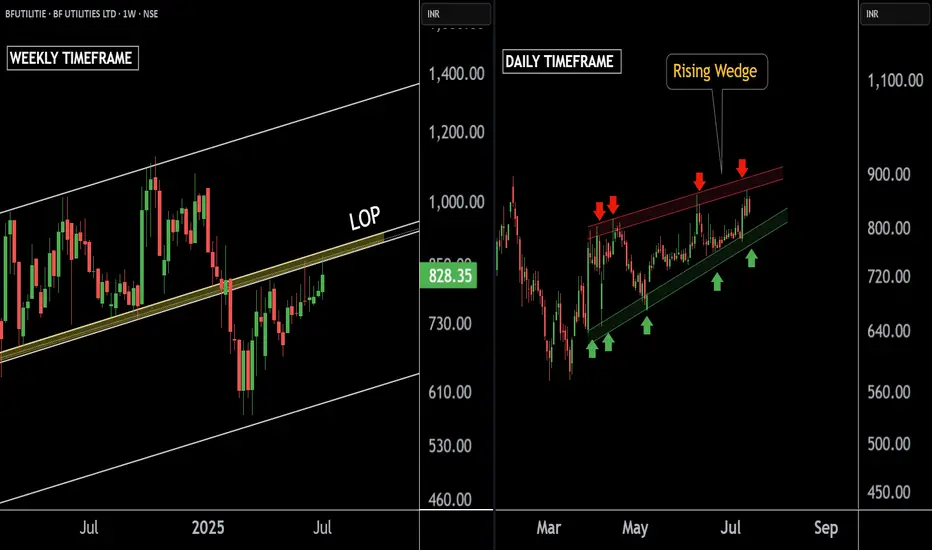
BF UTILITIES LTD 'S KEY LEVEL || BREAKDOWN OR BREAKOUT ??These are two charts of BF Utilities – one on the daily timeframe and the other on the weekly timeframe.
In the first chart : BF Utilities is sustaining near its Law of Polarity (LOP), which is acting as a resistance zone around the 880–890 range.
In the second chart : BF Utilities is forming a Rising Wedge pattern, with the resistance also lying in the 870–880 zone.
If this level is sustain ,then we may see lower price in BF Utilities.If this level is broken, the stock may move towards the upper boundary of the channel.
Thank you !!
Wipro AT Best Support Zone These are two daily timeframe charts of Wipro .
In the first chart : Wipro is trading within an ascending parallel channel, with the lower boundary positioned around the ₹251–₹254 zone.
Wipro has previously respected the Fibonacci golden zone, and the stock is once again approaching this key retracement area. A potential bounce from this zone is likely if the level is respected again around 254 near .
If this level is sustain , then we may see higher Prices in Wipro.
Thank You !!

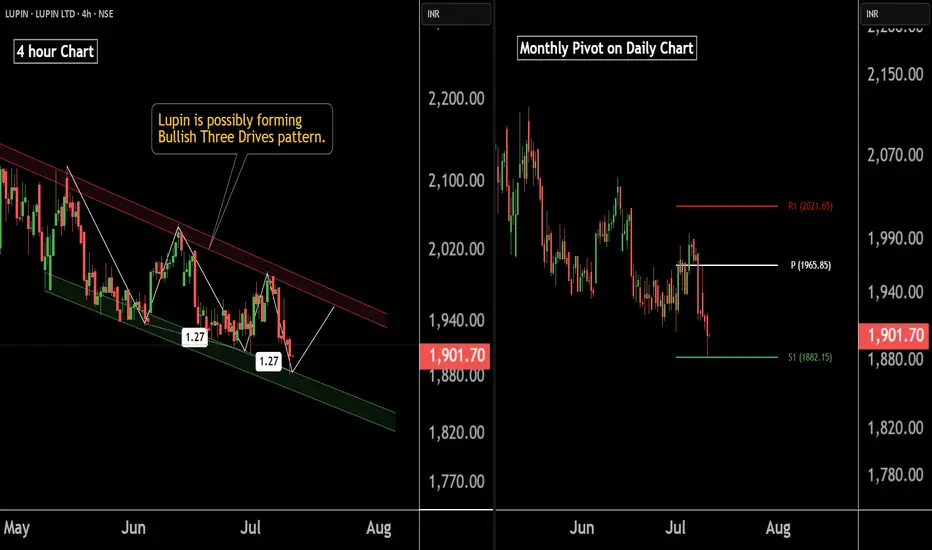
Lupin At Best Support !! This is the 4 hour chart of Lupin .
Lupin appears to be forming a potential Three Drives bullish reversal pattern, with both drives terminating at the 1.27 Fibonacci extension level, indicating a possible exhaustion of the downtrend.
Lupin is trading within a well-defined descending channel. It has once again approached the lower boundary of the channel, which lies around the 1865–1880 zone, and is showing signs of a bounce.
If this level is sustain , then we may see higher prices in Lupin.
Thank You !!
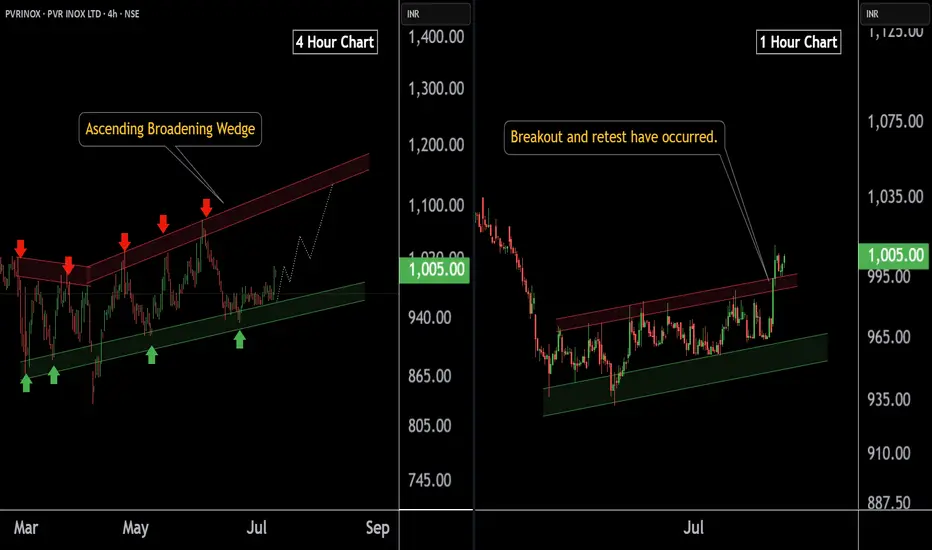
PVR INOX LTD at Best Support !! Breakout Alert !!Here are two charts of PVERINOX — one in the 4-hour timeframe and the other in the 1-hour timeframe.
4-Hour Timeframe Chart:
In the 4-hour timeframe, Power Inox is respecting its lower boundary, with a support range between 930–950.
ChatGPT said:
1-Hour Timeframe Chart:
In the 1-hour timeframe, the stock has given a breakout and has now completed a retest at 980-990 level.
If this level is sustain then , we may see higher in PVRINOX.
Thank you !!
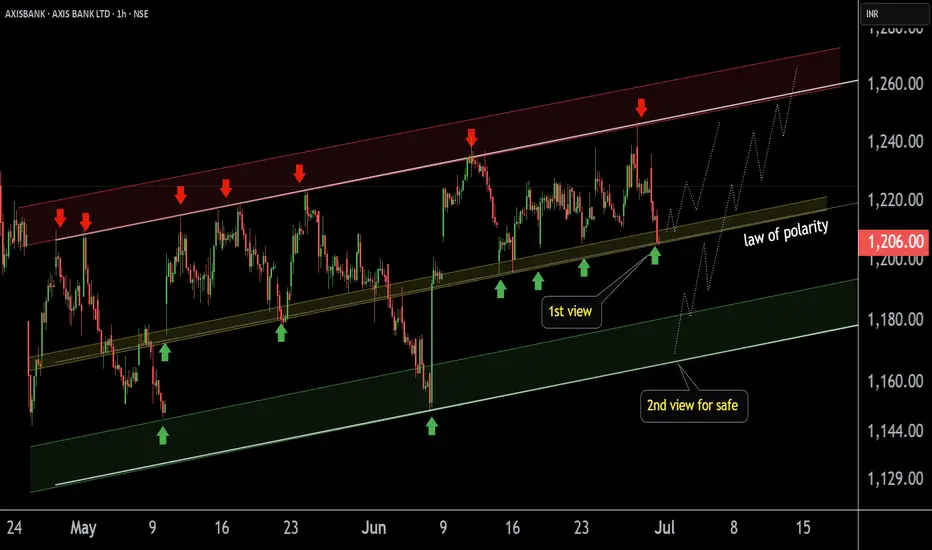
AXIS BANK at Best Support !!This is the 1 hour chart of AXIS BANK .
Axis bank having a good law of polarity at 1200 level.
Axisbank is moving in well defined parallel channel with support range 1160-1180 .
If this level is sustain , then we may see higher prices in AXISBANK.
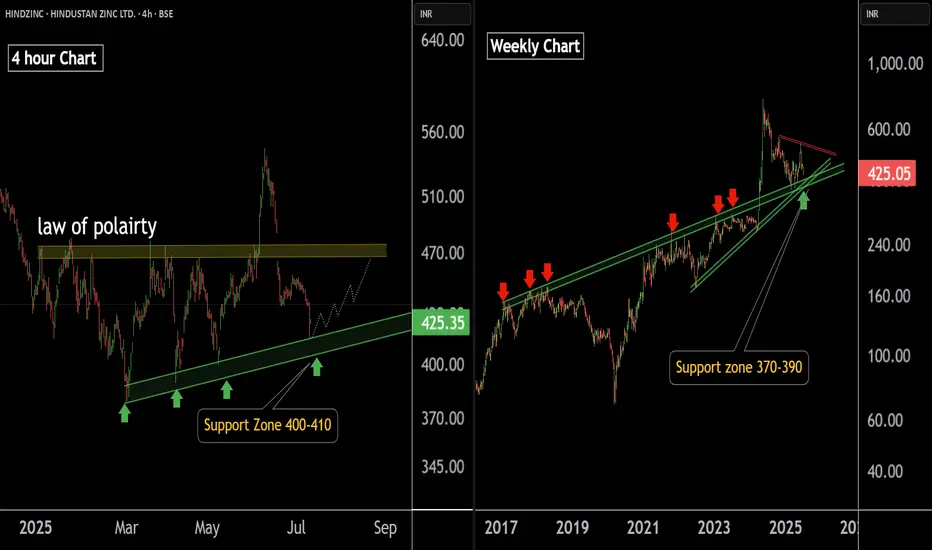
HINDUSTAN ZINC LTD at Best Support !!There are two charts of Hindustan Zinc — one on the 4-hour time frame, and the second on weekly time frame.
Chart 1 (4-Hour Timeframe):
The stock is moving in a Higher High, Higher Low (HH-HL) structure, indicating a bullish trend.
Support zone is observed near the 400–410 range.
Chart 2 (Weekly Timeframe):
On the weekly chart:
the stock is approaching a major support zone in the range of ₹375 – ₹390, which has historically held strong.
If this level is sustain then we may see higher prices in HINDZINC.
Thank You !!
MANGALORE REFINERY & PETROCHEM 'S KEY LEVEL !! BREAKOUT !!This is the 4 hour chart of MRPL.
MRPL having a good law of polarity at 145 range.
MRPL is trading within a well-defined parallel channel, with support in the 135–140 range.
If this level is sustain , then we may see higher prices in MRPL .
THANK YOU !!

Avadh Sugar & Energy Limited at Best Support !! Breakout This is the 1 hour chart of Avadh Sugar & Energy Limited .
AVADHSUGAR is trading within a well-defined parallel channel and is currently positioned near its L.O.P boundary support zone around ₹495–₹500.
The lower boundary of the channel is 480-490 level and The upper boundary of the channel is positioned near ₹515 and 535, offering a favorable risk-reward setup.
Thank You !!

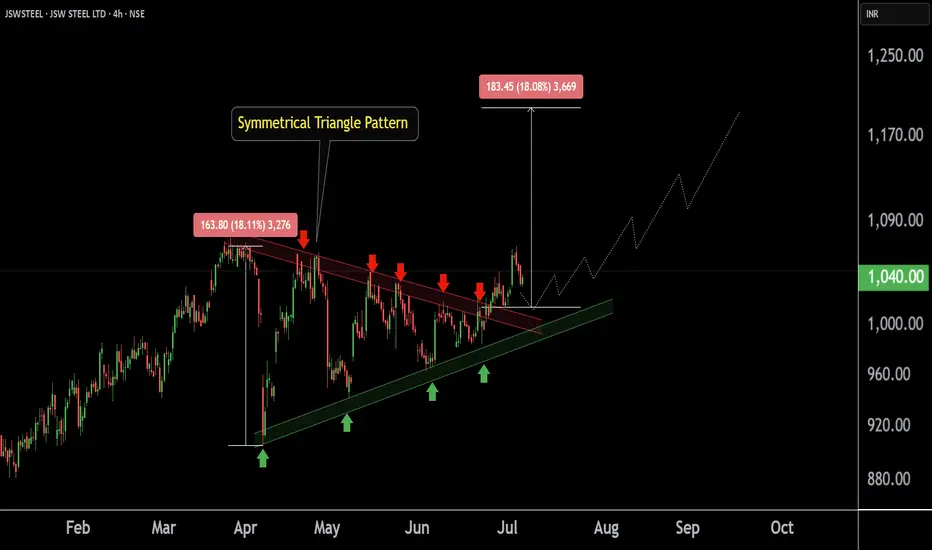
JSWSTEEL ' S Key Level | Big Breakout !This is the 4 hour chart of JSW STEEL.
JSWSTEEL having a good pattern support zone near at 980-1000 level .
JSW Steel has formed a Symmetrical Triangle pattern on the chart, and a breakout has occurred. The stock may retested the breakout level and then appears poised to move toward its projected target at 1180 - 1200 .
If the support zone level is sustain , then we may see higher prices in JSW Steel.
Thank You !!
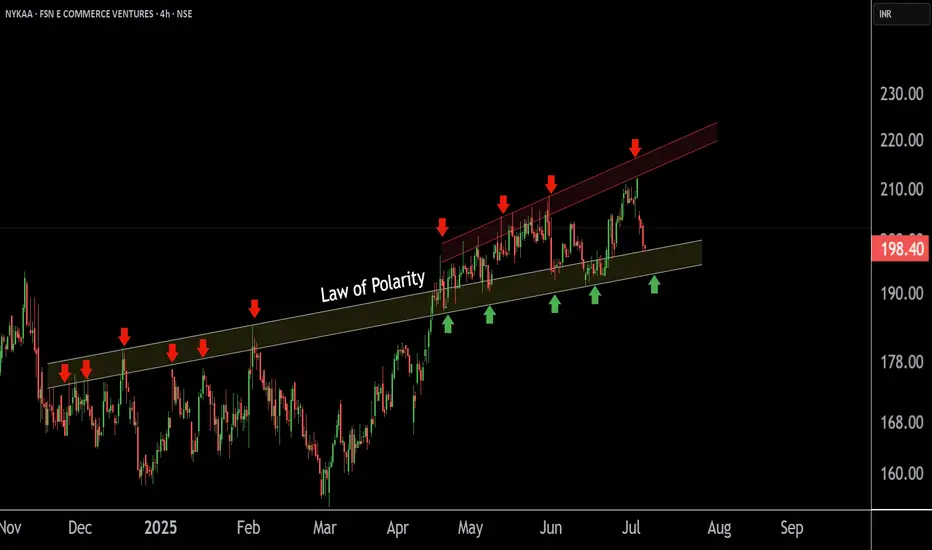
FSN E COMMERCE VENTURES at Best Support Level | NYKAA !!This is the 4 hour Chart of Nykaa.
Nykaa having a good law of polairty near at 195-190 range.
Nykaa is forming ascending boradening wedge pattern with support at 190-195 range .
If this level is sustain , then we may see higher prices in Nykaa .
Thank You !!
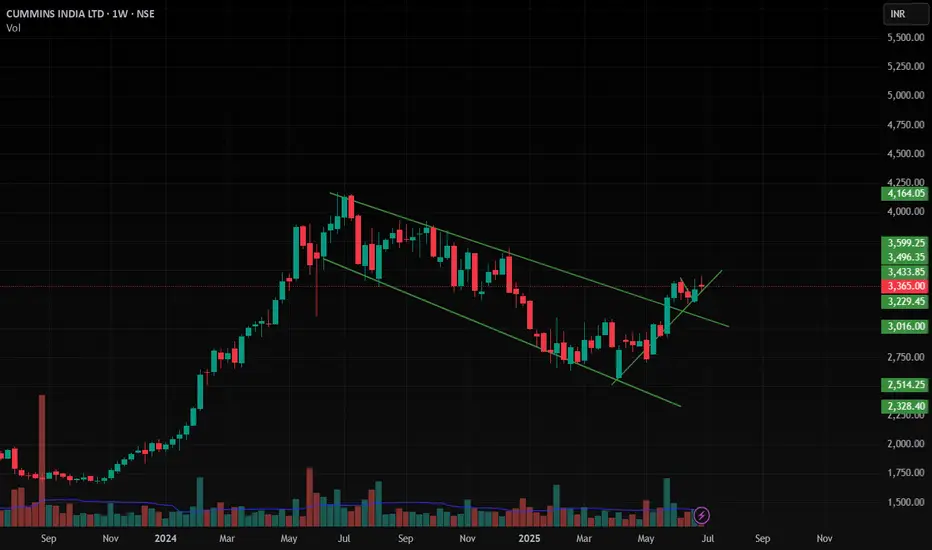
Cumminsind , 1W, Bullishit has Formed a very Good Pattern and Given a Breakout with Good Volume and now it is Trending to Up side ,
Follow proper position sizing and Risk Management
Follow for More Swing Ideas Like this
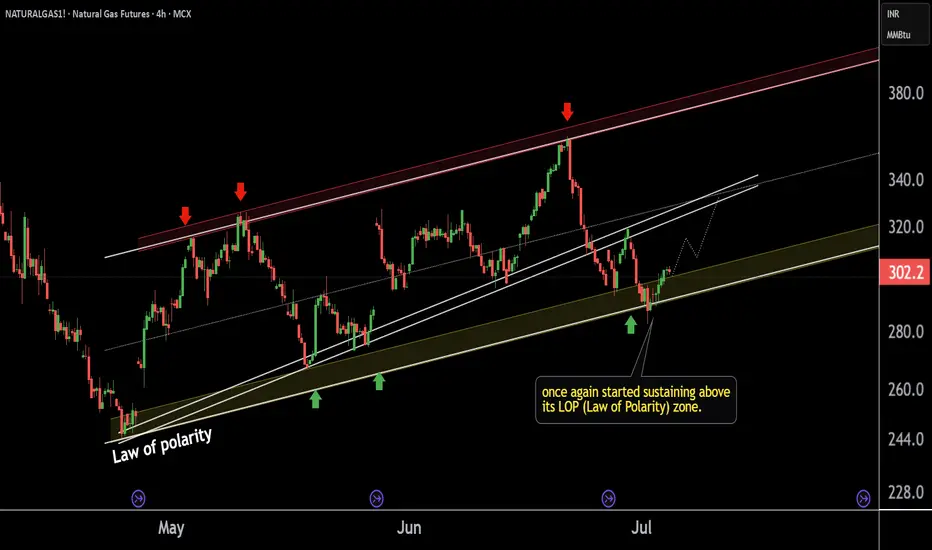
NATURALGAS1! 's key Level |This is the 4 hour chart of NATURALGAS1!
NATURALGAS1! has once again started sustaining above
its LOP (Law of Polarity) zone near at 290-295
If This level is sustain then ,we may see higher prices again in NATURALGAS1!.
Thank You !!
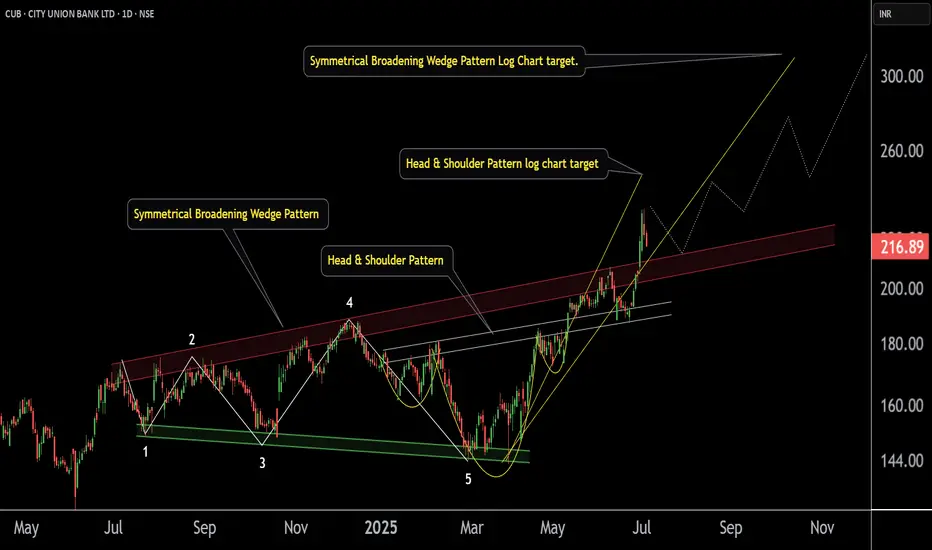
City Union Bank ' s Key level | Breakout |This is the Daily Chart of City Union Bank .
CUB has formed a Broadening Wedge pattern on the daily chart, with a breakout near the ₹200 support zone. Post breakout, the pattern suggests potential upside targets of ₹274 and ₹310
On the 4-hour chart, the stock has formed a Head and Shoulders pattern, with a breakout at ₹190, which has already been retested. The first target of the pattern has been achieved, while the next potential target is ₹250.
Thank You !!
HINDUSTAN OIL EXPLORATION at Best Support !!This is daily chart of HINDUSTAN OIL EXPLORATION .
HINDOILEXP having a good Support zone at 162-165 level.
HINDOILEXP has formed a Falling Wedge Pattern with Support near at 165 level.
If this level is sustain , then we may see higher prices in HINDOILEXP .
Thank You !!

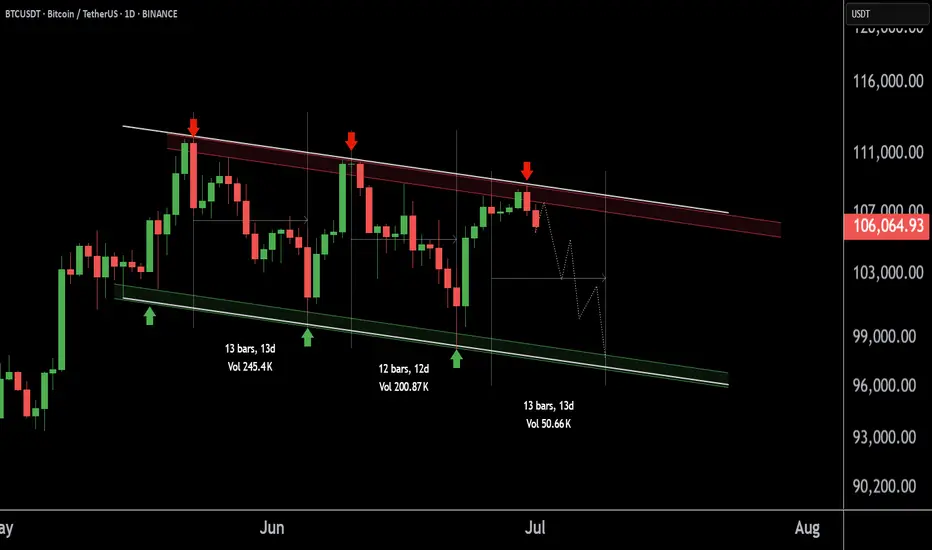
BTCUSDT at Best Resistance !!This is the Daily chart of Bitcoin .
BTCUSDT is trading near it Resistance Zone 108,600 - 107,400.
If this level is sustain , then we may see lower prices in BTCUSDT.
Thank You !!
01.07.25 Morning ForecastPairs on Watch -
FX:EURNZD
FX:GBPCAD
FX:EURUSD
FX:GBPJPY
A short overview of the instruments I am looking at for today, multi-timeframe analysis down to what I will be looking at for an entry. Enjoy!

Xrp - The expected rally of +50%!Xrp - CRYPTO:XRPUSD - is still clearly bullish:
(click chart above to see the in depth analysis👆🏻)
Ever since Xrp rallied more than +550% in the end of 2024, we have been witnessing a quite expected consolidation. However Xrp still remains rather bullish and can easily retest the previous all time highs again. Maybe, we will even see another parabolic triangle breakout.
Levels to watch: $3.0, $10.0
Keep your long term vision!
Philip (BasicTrading)

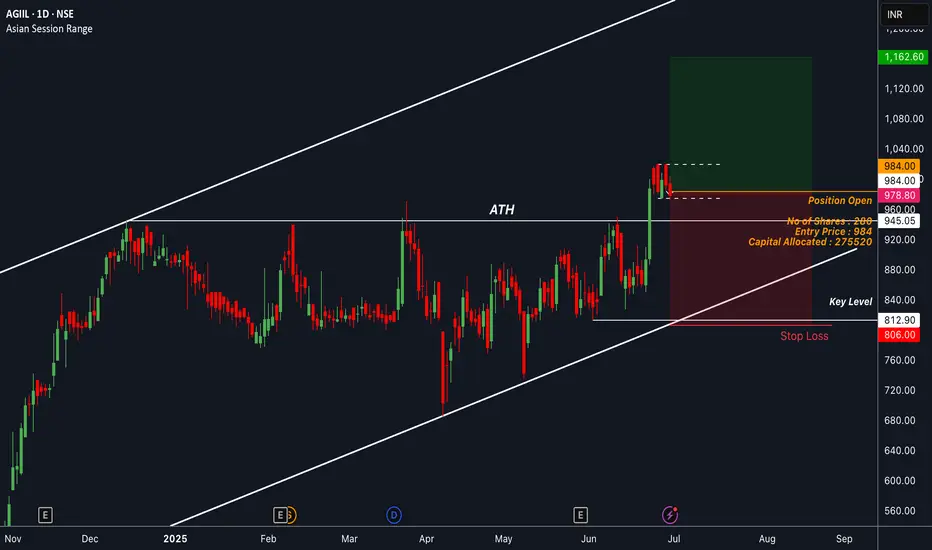
AGIIL : Sniped a Long with 1% Risk on the TableDecided to enter after the market consolidated post a strong ATH breakout. Looking for a rally toward the channel’s dynamic resistance from here.
📢📢📢
If my perspective changes or if I gather additional fundamental data that influences my views, I will provide updates accordingly.
Thank you for following along with this journey, and I remain committed to sharing insights and updates as my trading strategy evolves. As always, please feel free to reach out with any questions or comments.
Other posts related to this particular position and scrip, if any, will be attached underneath. Do check those out too.
Disclaimer : The analysis shared here is for informational purposes only and should not be considered as financial advice. Trading in all markets carries inherent risks, and past performance is not indicative of future results. It’s essential to conduct your own research and assess your risk tolerance before making any investment decisions. The views expressed in this analysis are solely mine. It’s important to note that I am not a SEBI registered analyst, so the analysis provided does not constitute formal investment advice under SEBI regulations.
GILLETTE : Took a long position with 1% riskEntered right after the close of the momentum candle that broke the ATH levels. Sl is kept underneath the most recent low. Will be managing the trade depending on the momentum of the market in the coming days.
📢📢📢
If my perspective changes or if I gather additional fundamental data that influences my views, I will provide updates accordingly.
Thank you for following along with this journey, and I remain committed to sharing insights and updates as my trading strategy evolves. As always, please feel free to reach out with any questions or comments.
Other posts related to this particular position and scrip, if any, will be attached underneath. Do check those out too.
Disclaimer : The analysis shared here is for informational purposes only and should not be considered as financial advice. Trading in all markets carries inherent risks, and past performance is not indicative of future results. It’s essential to conduct your own research and assess your risk tolerance before making any investment decisions. The views expressed in this analysis are solely mine. It’s important to note that I am not a SEBI registered analyst, so the analysis provided does not constitute formal investment advice under SEBI regulations.

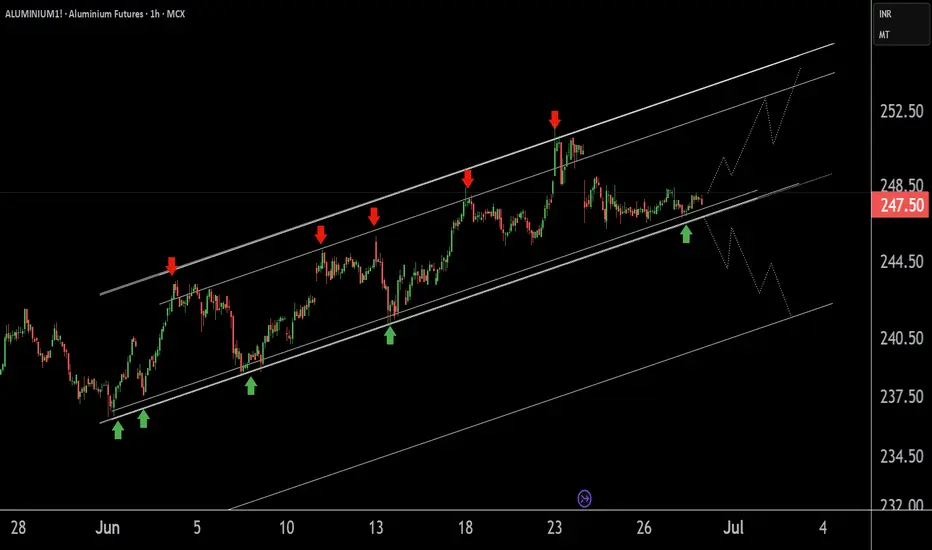
ALUMINIUM Futures at Best Support !!This is the 1 hour chart of Aluminium futures.
Aluminium is moving in well defined ascending parallel channel with Support at 245 level .
If this level is sustain , then we may see higher prices in the Aluminium Futures.
Thank you !!
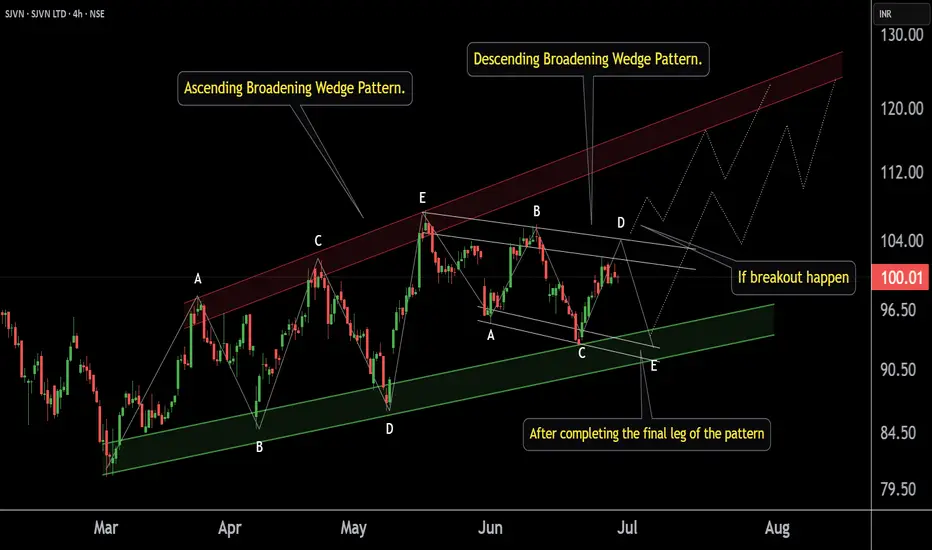
SJVN 's Key level for Swing .This is the 4 hour chart of SJVN.
SJVN is forming a broadening pattern with support near at 90 range.
SJVN is forming a descending broadening pattern within a larger ascending broadening structure with support at near 91 range.
If this level is sustain then ,we may see higher prices in SJVN.
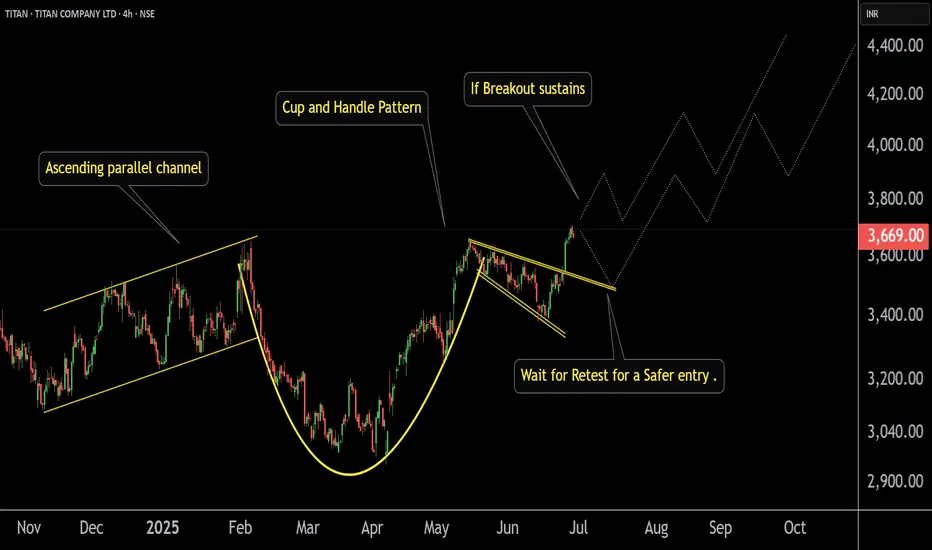
TITAN ' s Key Point | Breakout | Swing.This is the 4 hour Chart of the TITAN COMPANY.
Titan has formed a Cup and Handle pattern and given a breakout .
Two possible scenarios:
If the breakout sustains with volume, the rally may continue.
If it retests the breakout level, it would offer a safer entry before the next leg up.
If this level is sustain then we may see higher prices in Titan.