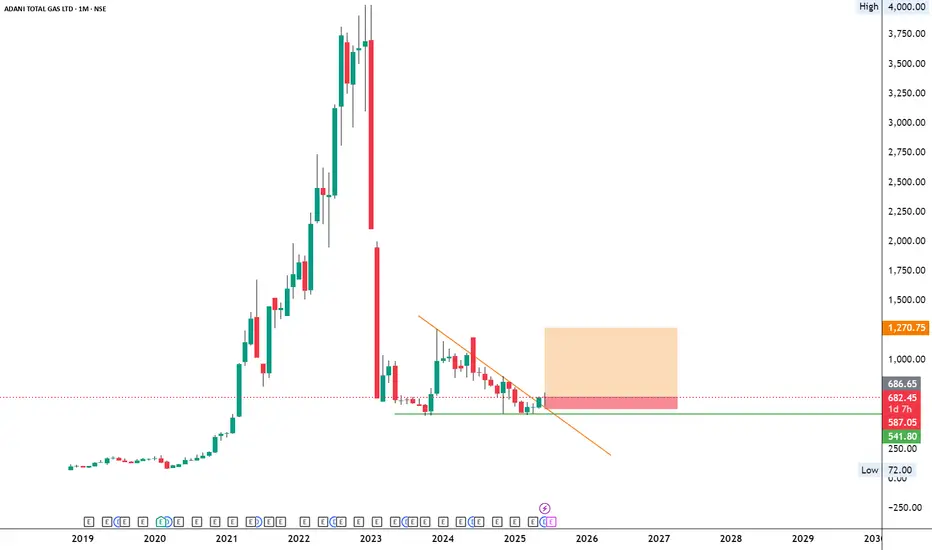
ATGLNSE:ATGL
Note :
1. One should go long with a Stop Loss, below the Trendline or the Previous Swing Low.
2. Risk :Reward ratio should be minimum 1:2.
3. Plan your trade as per the Money Management and Risk Appetite.
Disclaimer :
>You are responsible for your profits and loss.
>The idea shared here is purely for Educational purpose.
>Follow back, for more ideas and their notifications on your email.
>Support and Like incase the idea works for you.
Patterntrading
Broadcom - This was just the first all time high!Broadcom - NASDAQ:AVGO - just created new highs:
(click chart above to see the in depth analysis👆🏻)
Over the course of the past three months, Broadcom has been rallying an impressive +80%. However looking at market structure, all of the previous "dump and pump" was not unexpected. Following this recent bullish strength, Broadcom is likely to channel a lot higher.
Levels to watch: $250, $400
Keep your long term vision!
Philip (BasicTrading)

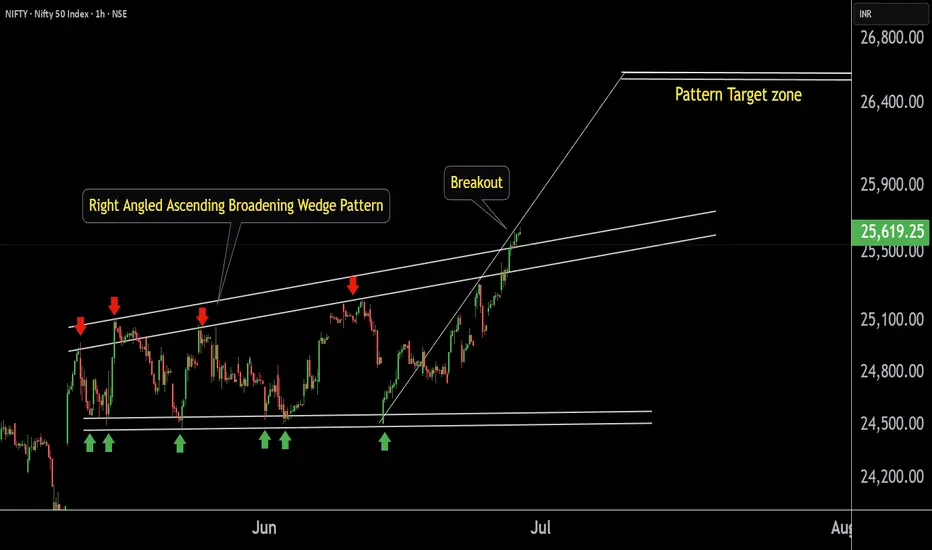
NIFTY 50 key level This is the 1 hour chart of NIFTY 50 .
NIFTY 50 has formed Right Angled Ascending Broadening Wedge Pattern.
Nifty 50 has given a breakout from its pattern.
If Nifty 50 sustains after a successful retest post-breakout, we may see higher prices in Nifty 50.
The target for this pattern is projected near the 26,600 level.
Thank You !!
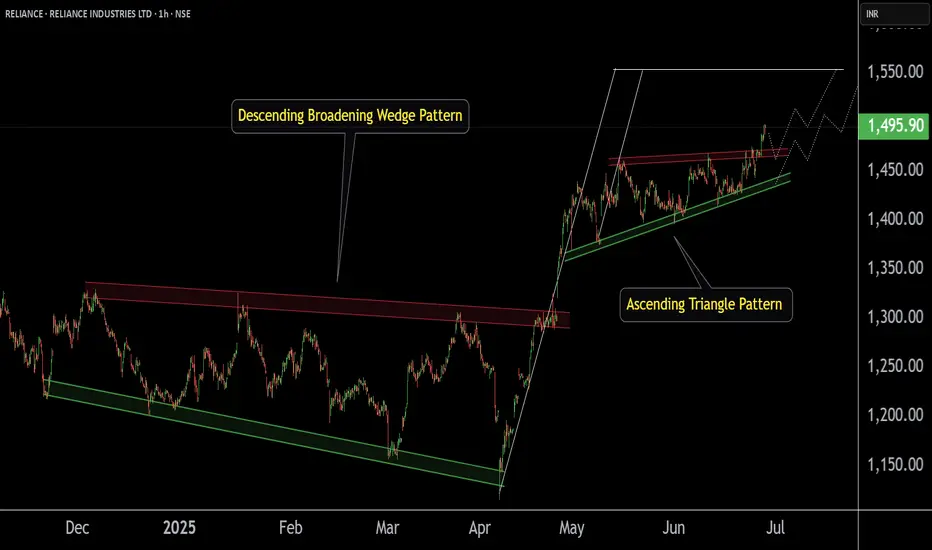
RELIANCE INDUSTRIES at Key Zone !!This is the 1 hour Chart of RELIANCE INDUSTRIES.
Stock has formed a large Broadening Wedge pattern, with a projected target around the 1560 range.
Stock has formed a ascending triangle patterrn with a projected target around the 1560 range.
stock has given a breakout at 1460 range. If it successfully retests and holds this level as support , then we may see higher prices in RELIANCE INDUSTRIES.
Thank you !!
25.06.25 Morning ForecastPairs on Watch -
FX:AUDUSD
FX:NZDUSD
FX:EURAUD
A short overview of the instruments I am looking at for today, multi-timeframe analysis down to what I will be looking at for an entry. Enjoy!

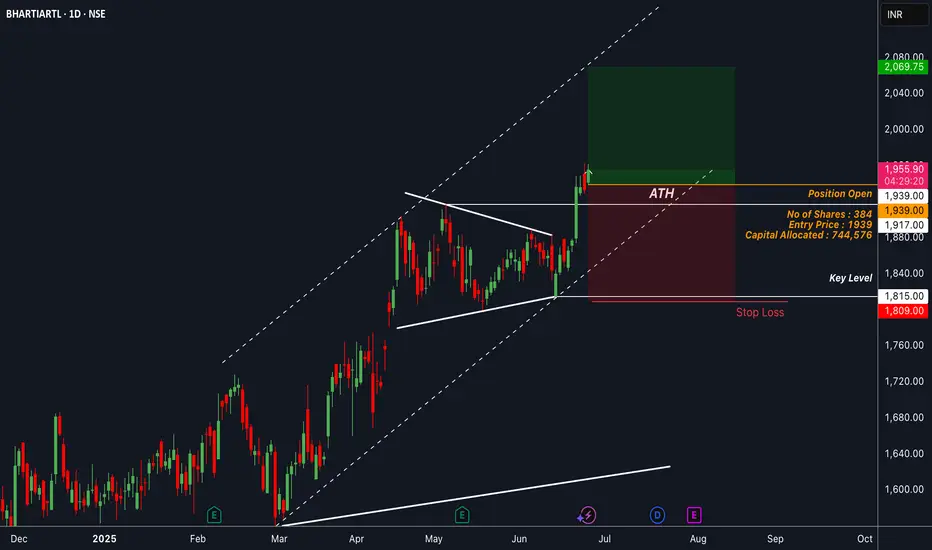
BHARTIARTL : Took a position for 1% riskEntered the position on a breakout above the all-time high, confirmed by a strong momentum candle and no immediate signs of retracement. The risk is of 1%.
📢📢📢
If my perspective changes or if I gather additional fundamental data that influences my views, I will provide updates accordingly.
Thank you for following along with this journey, and I remain committed to sharing insights and updates as my trading strategy evolves. As always, please feel free to reach out with any questions or comments.
Other posts related to this particular position and scrip, if any, will be attached underneath. Do check those out too.
Disclaimer : The analysis shared here is for informational purposes only and should not be considered as financial advice. Trading in all markets carries inherent risks, and past performance is not indicative of future results. It’s essential to conduct your own research and assess your risk tolerance before making any investment decisions. The views expressed in this analysis are solely mine. It’s important to note that I am not a SEBI registered analyst, so the analysis provided does not constitute formal investment advice under SEBI regulations.
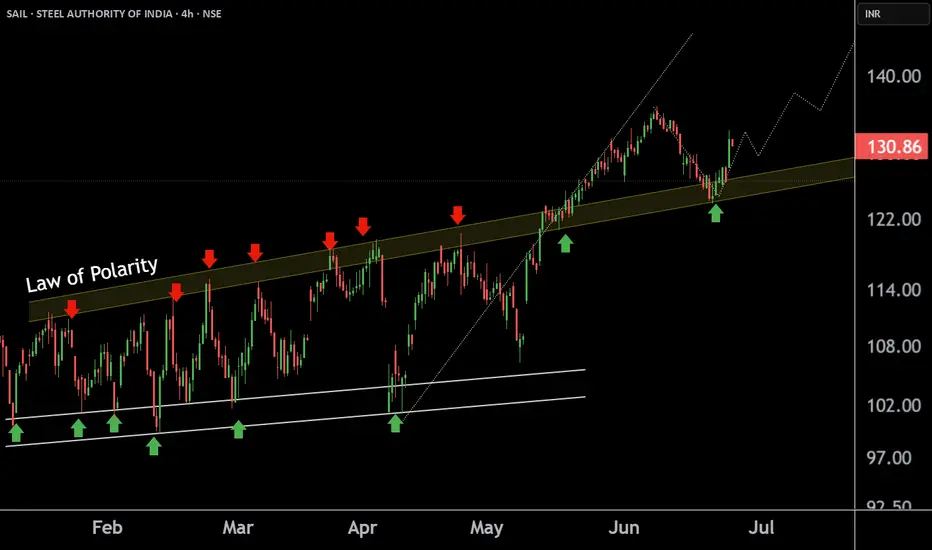
SAIL at Best Support !!This is the 4 hour Chart of STEEL AUTHORITY OF INDIA .
SAIL having a good law of polarity at 125 range .
SAIL has formed a broadening pattern indicating the uptrend.
if this level is sustain then we may see higher prices in SAIL.
Thank You !!
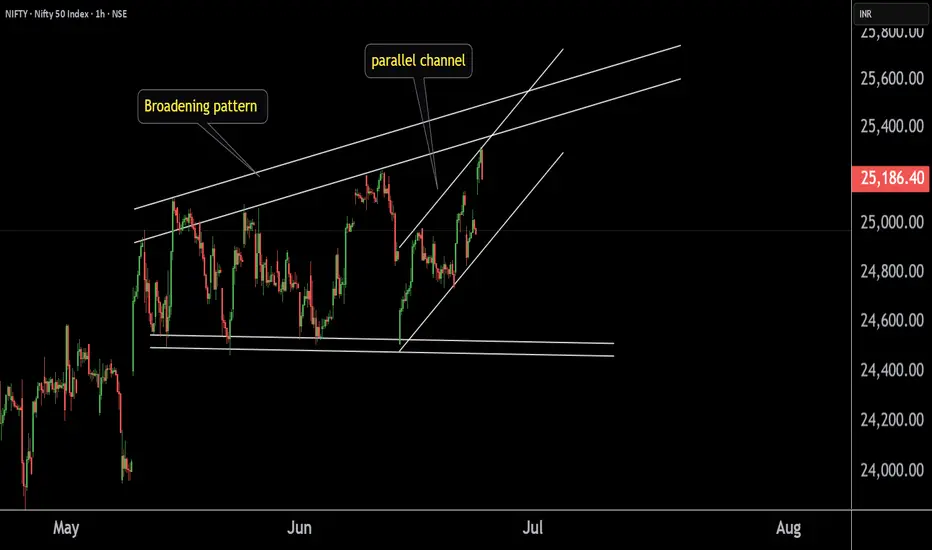
NIFTY at Best Resistance !!This is the 1 hour Chart of NIFTY 50.
NIFTY 50 is trading near it's Resistance zone at 24400 range.
NIFTY 50 is forming a broadening pattern; resistance lies near 24,500.
Nifty 50 is forming parallel channel inside the pattern ; resistance lies near 24350.
If this level is sustain, then we may see Lower prices in Nifty 50.
Thank You !!
24.06.25 Morning ForecastPairs on Watch -
FX:AUDNZD
FX:USDJPY
FX:EURCAD
A short overview of the instruments I am looking at for today, multi-timeframe analysis down to what I will be looking at for an entry. Enjoy!

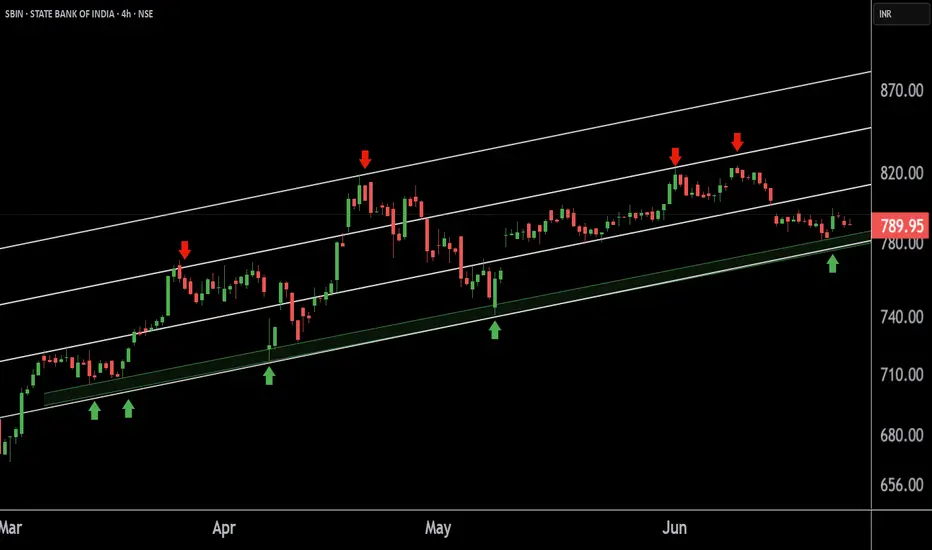
STATE BANK OF INDIA at Best Support !!This is the 4 hour Chart of STATE BANK OF INDIA.
SBIN is having good Support at 770 range.
SBIN is moving within an ascending channel, with a support zone in the range of 770–780.
If this level is Sustain ,then we may see higher prics in SBIN.
Thank You !!
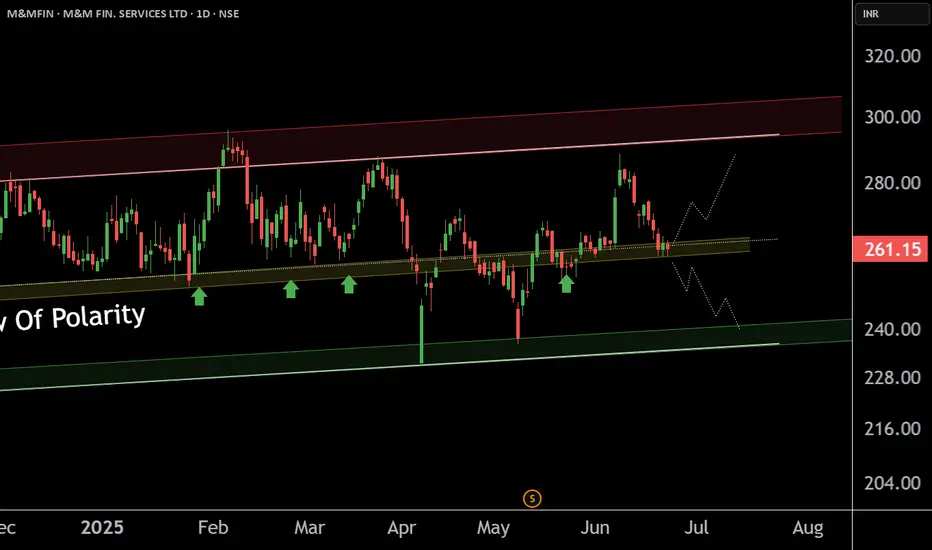
M&M FIN. SERVICE LTD at Key Zone this is the Daily chart of M&M FIN. SERVICE LTD
M&MFIN having a good law of polarity at 255-260 level .
If this level is sustain ,then we may see higher prices in M&MFIN and if stock sustain below this level then M&MFIN will touch it's support zone 240 level.
Thank you !!
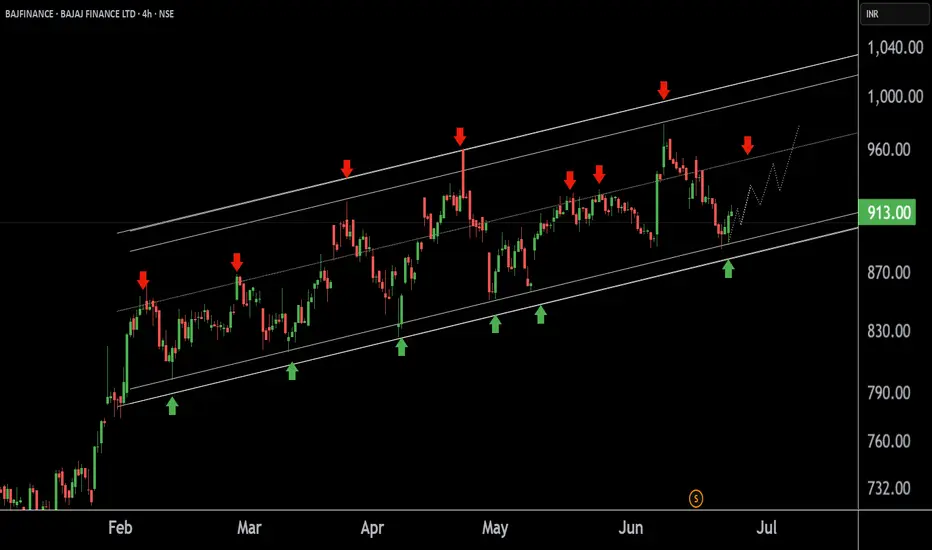
BAJAJ FINANCE LTD at Best Support !!This is the 4 hour Chart of BAJFINANCE.
BAJFINANCE having a good support at 880-900 range.
BAJFINANCE is currently trading within an ascending channel pattern, indicating a structure of higher highs and higher lows, which reflects a sustained uptrend.
If this level is sustain, then we may see higher prices again BAJFINANCE.
Thank You !!
23.06.25 Morning ForecastPairs on Watch -
FX:EURAUD
FX:EURNZD
FX:EURUSD
A short overview of the instruments I am looking at for today, multi-timeframe analysis down to what I will be looking at for an entry. Enjoy!

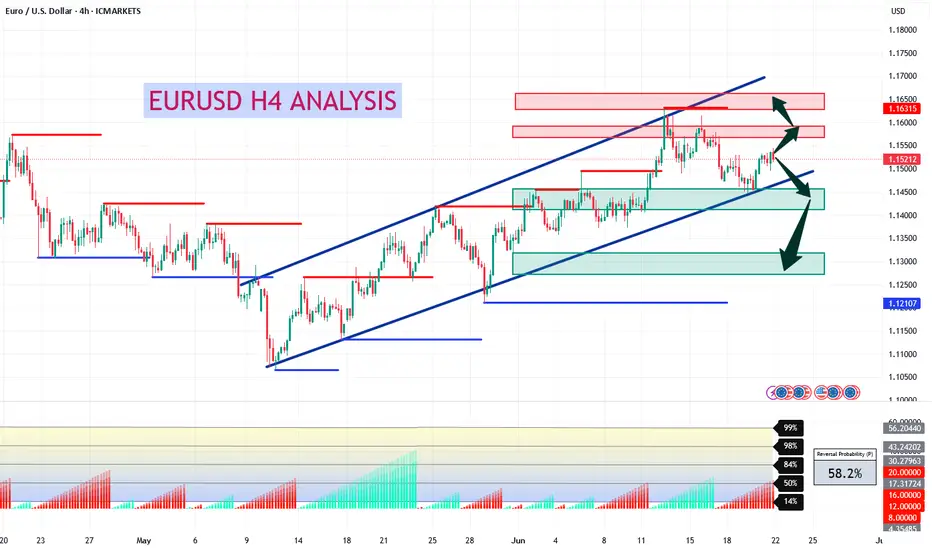
EURUSD H4 AnalysisEURUSD Showing a bullish Flag. If it breaks this zone above, Most probably can fly up to 1.15818 and higher to 1.16322. If no, Can rally between 1.14320, 1.13067 or even lower. Trading Analysis from 23-06-25 to 27-06-25. Take your risk under control and wait for market to break support or resistance on smaller time frame. Best of luck everyone and happy trading.🤗
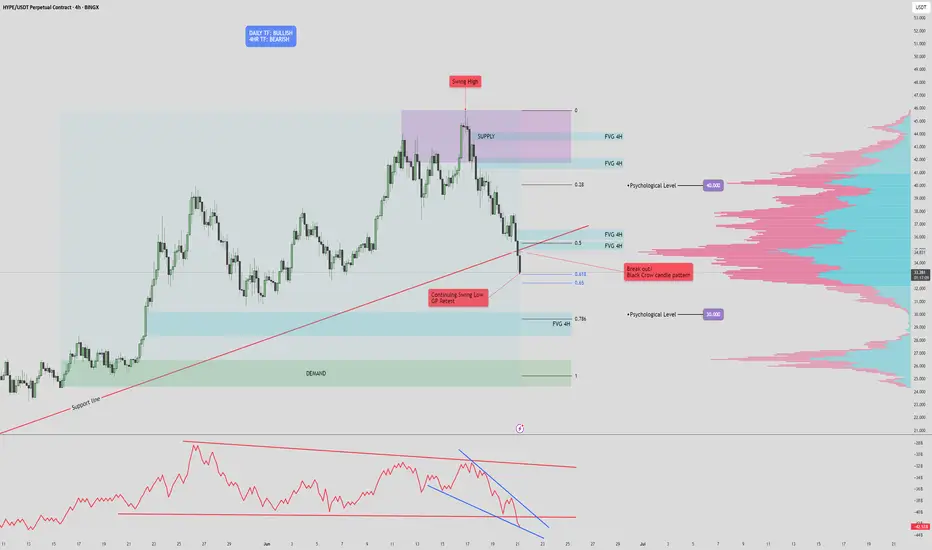
HYPE/USDT Technical Analysis (4H Chart)🔍 HYPE/USDT Technical Analysis (4H Chart)
High Time Frame (Daily): Bullish
Despite recent pullbacks, the overall trend remains bullish on the daily timeframe. However, current price action suggests a potential fakeout or legitimate breakdown, as we test key structural and volume-based supports.
Short-Term Time Frame (4H): Bearish
The 4-hour chart displays clear bearish pressure, confirmed by the Three Black Crows candlestick pattern. This signals sustained selling interest and supports the current downward move.
🧱 Key Zones
Supply Zone: $41.7 – $45.9
Strong resistance marked by prior selling pressure and overlapping FVGs.
Demand Zone: $24.4 – $26.3
Historical area of buying support, aligned with a low-volume node and an unfilled FVG.
📏 Fair Value Gaps (FVGs)
Above Price:
Four 4H FVGs act as upside inefficiencies, offering targets in a bullish recovery:
~$34.9
~$36.6
~$37.8
~$40.0 (psychological level & POC cluster)
Below Price:
One major 4H FVG remains unfilled, directly above the demand zone.
📐 Fibonacci Analysis
Price is testing the Golden Pocket (0.618–0.65) from the recent swing low to high.
A clean break below this area (with confirmation) targets the unfilled FVG around $30, and potentially the demand zone ($24.4–$26.3).
📉 Volume Profile Insight
Volume is clustered around $34–$37, indicating strong past market participation.
Very low volume between $29–$30, creating a volume void — if price loses support at the FVG and golden pocket, it could rapidly drop into the demand zone.
🔻 OBV Analysis (Volume Momentum)
OBV has broken below a larger rising wedge, confirming bearish divergence.
A falling wedge is now forming within OBV.
Break below this wedge: Confirms further price breakdown.
Reclaim of the larger wedge trendline: Suggests potential bullish reversal.
✅ Trade Scenarios
🔺 Bullish Scenario
Trigger: Bullish reversal pattern at the golden pocket (e.g., double bottom, falling wedge, inverse H&S) + OBV recovery.
Entry: Upon confirmation around $32.5.
Targets:
$34.9 (FVG)
$36.6 (FVG)
$37.8 (FVG)
$40.0 (psychological)
Stop: Below $30 or recent swing low (tight below FVG).
🔻 Bearish Scenario
Trigger : Confirmed breakdown of golden pocket & 4H FVG with OBV falling wedge breakdown.
Entry : Below $32.5 with confirmation (e.g., retest or strong momentum candle).
Targets:
$30.0 (psychological level)
$28.5 (FVG zone)
$26.3 → $24.4 (Demand zone)
Stop : Above golden pocket resistance (~$33.8–$34.2).
📝 Conclusion: The market is at a pivotal point. A confirmed break below $32.5 could accelerate selling due to the volume gap, while a strong bullish reaction from the golden pocket could drive a recovery toward $40. Always wait for confirmation before entering either scenario.
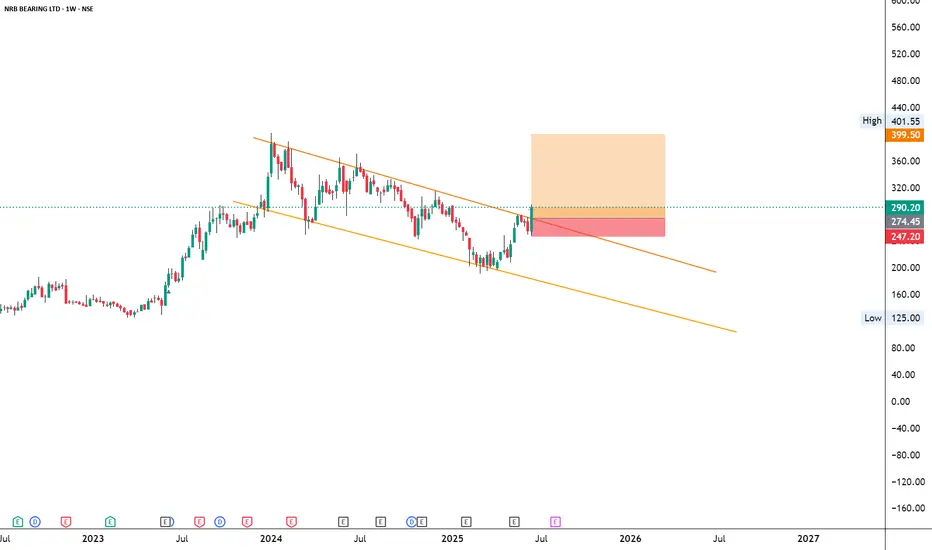
NRBBEARING
NSE:NRBBEARING
Note :
1. One should go long with a Stop Loss, below the Trendline or the Previous Swing Low.
2. Risk :Reward ratio should be minimum 1:2.
3. Plan your trade as per the Money Management and Risk Appetite.
Disclaimer :
>You are responsible for your profits and loss.
>The idea shared here is purely for Educational purpose.
>Follow back, for more ideas and their notifications on your email.
>Support and Like incase the idea works for you.
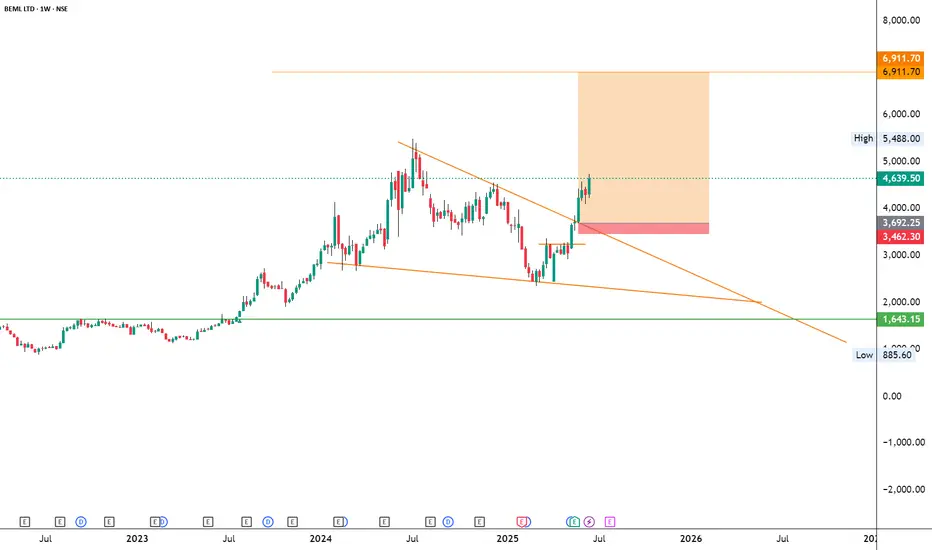
BEMLNSE:BEML
Note :
1. One should go long with a Stop Loss, below the Trendline or the Previous Swing Low.
2. Risk :Reward ratio should be minimum 1:2.
3. Plan your trade as per the Money Management and Risk Appetite.
Disclaimer :
>You are responsible for your profits and loss.
>The idea shared here is purely for Educational purpose.
>Follow back, for more ideas and their notifications on your email.
>Support and Like incase the idea works for you.
20.06.25 Morning ForecastPairs on Watch -
FX:EURJPY
FX:EURNZD
FX:EURUSD
A short overview of the instruments I am looking at for today, multi-timeframe analysis down to what I will be looking at for an entry. Enjoy!

19.06.25 Morning ForecastPairs on Watch -
FX:EURGBP
FX:EURAUD
FX:AUDNZD
A short overview of the instruments I am looking at for today, multi-timeframe analysis down to what I will be looking at for an entry. Enjoy!

18.06.25 Morning ForecastPairs on Watch -
FX:GBPJPY
FX:EURCAD
FX:CADJPY
A short overview of the instruments I am looking at for today, multi-timeframe analysis down to what I will be looking at for an entry. Enjoy!

17.06.25 Morning ForecastPairs on Watch -
FX:EURUSD
FX:CADCHF
OANDA:XAUUSD
A short overview of the instruments I am looking at for today, multi-timeframe analysis down to what I will be looking at for an entry. Enjoy!

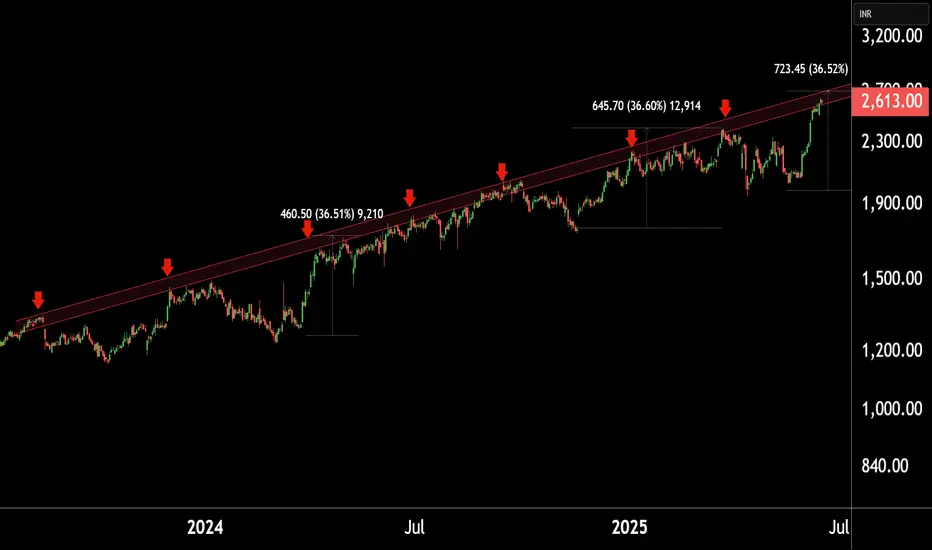
MUTHOOT FINANCE at Best Resistance !! This is the Daily Chart of MUTHOOT FINANCE .
MUTHOOTFIN is currently trading near its resistance range around the 2700 range.
MUTHOOTFIN has completed its upward move as per its natural price behavior, with the rise reaching up to the 2700 range.
If This level is sustain , then we may see lower prices in MUTHOOTFIN.
Thank You !!
PI INDUSTRIES LTD at Key Resistance !!This is the Weekly chart of PI INDUSTRIES LTD.
PIIND having good law of polarity at 4300-4400 range.
If this level is sustain , then we may see lower prices in PIIND.
Thank You !!
