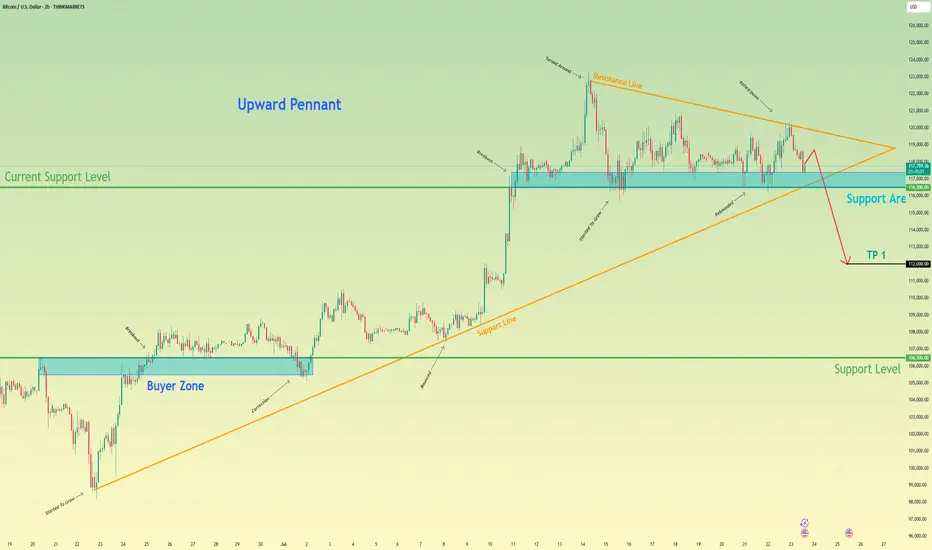
BITCOIN - Price can turn around and start to move upHi guys, this is my overview for BTCUSD, feel free to check it and write your feedback in comments👊
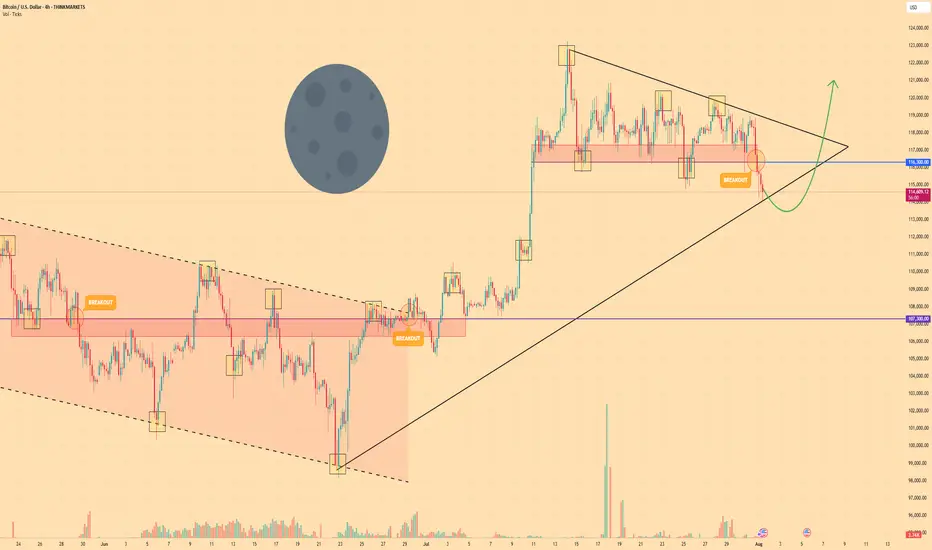
The price reversed its prior downtrend with a decisive breakout from a falling channel.
This breakout triggered a strong upward impulse, which then began to consolidate into a large symmetrical pennant.
However, the price recently failed to hold the lower support trendline of this pennant and broke to the downside.
The asset is currently trading just below this broken trendline, in what appears to be a liquidity grab.
To continue upwards, buyers must now overcome the immediate resistance located at the $116300 level.
I expect that this breakdown was a fakeout, and the price will soon reverse, break through the $116300 resistance, and continue its rally toward the $121000 target.
If this post is useful to you, you can support me with like/boost and advice in comments❤️
Disclaimer: As part of ThinkMarkets’ Influencer Program, I am sponsored to share and publish their charts in my analysis.
Pennant
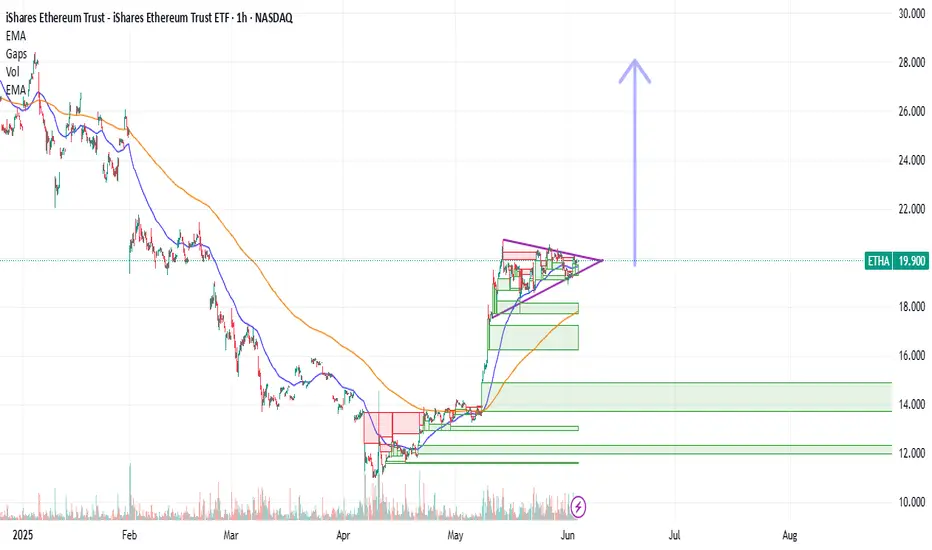
Ethereum Rally (?) : Strong Infusion with Volume RequiredEthereum can make a very strong rally of at least 35-40 percent.
And so the same goes for the Ishares Ethereum Trust ETF. (ETHA ETF)
But it needs to break the pennant.
And we need to observe strong volume.
Also, if we stay above the 50 and 200 period moving averages while this is happening, good things can happen.
Still, I am neutral until we break the pennant.
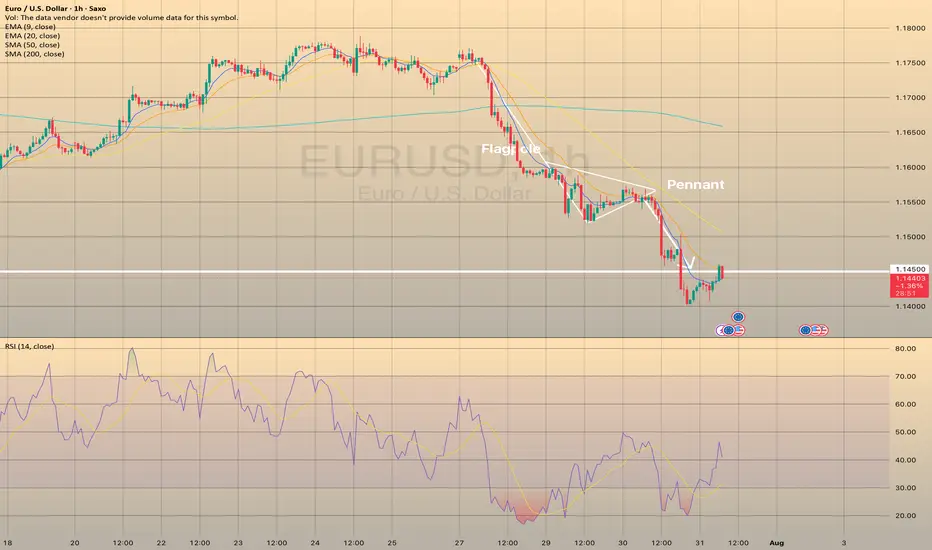
EURUSD REACHED THE TARGET.EURUSD REACHED THE TARGET.
EURUSD has reached the 1.14500 level and even broke it down. Currently the price consolidates slightly below this level. If the price forms a false breakout of 1.14500 level, this will mean the end of short-term decline in the pair. Stay cautious.
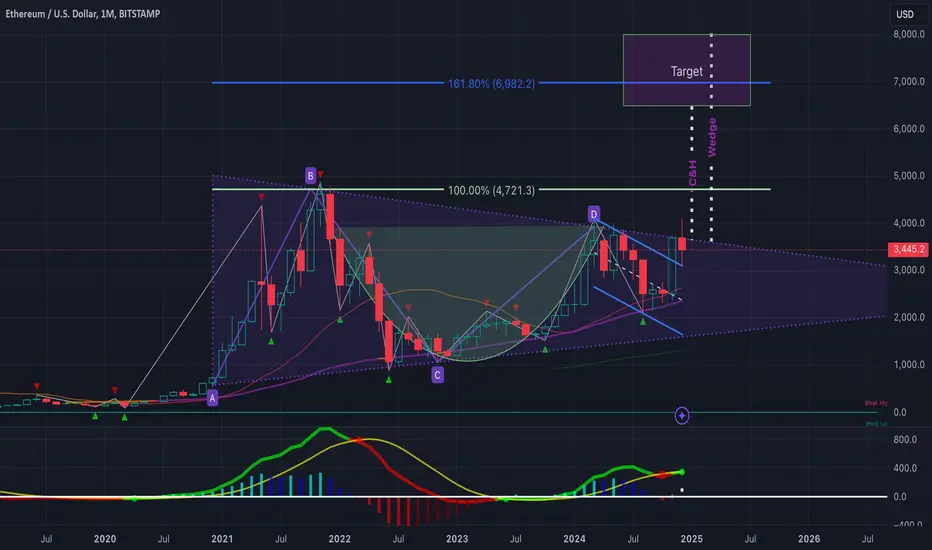
$ETH to $6.45k USD - 2024's Crescendo CRYPTOCAP:ETH is showing strong signs of an impending breakout to the $6.4k–$8k range, backed by two key technical indicators:
Cup & Handle Formation: ETH has recently broken out of a textbook cup and handle pattern, confirming the breakout with a solid retest over this past week of VOL. This is a classic bullish signal pointing to higher targets.
Bull Pennant: Since the 2021 rally, ETH has been consolidating within a massive bull pennant. This long-term structure suggests Ethereum is coiled and ready for a significant move upward.
1.618 Fib: Also layering in a Fibonacci retrace, if ETH is indeed heading for ATHs and price discovery, the 1.618 FIB is a common level that traders are very familiar with. It just so happens to be right in the middle of our target box at ~$7k!
Momentum is building— we will need to keep an eye on volume and follow-through for confirmation.
To boot, bearish sentiment for ETH is near all time highs. I think it might be time for a most-hated rally. I have a short term allocation in AMEX:ETHT to ride this momentum, NFA DYOR
FMC Corporation Quote | Chart & Forecast SummaryKey Indicators On Trade Set Up In General
1. Push Set Up
2. Range Set Up
3. Break & Retest Set Up
Notes On Session
# FMC Corporation Quote
- Double Formation
* (1st Entry Area)) - *70.00 USD | Completed Survey
* (A+ SIgnal)) - *Retest Feature | Subdivision 1
- Triple Formation
* (P1)) / (P2)) & (P3)) | Subdivision 2
* 119 bars, 165d, 1.5RR - Date Range Method | Subdivision 3
* Daily Time Frame | Trend Settings Condition
- (Hypothesis On Entry Bias)) | Regular Settings
- Position On A 1.5RR
* Stop Loss At 48.00 USD
* Entry At 41.00 USD
* Take Profit At 31.00 USD
* (Downtrend Argument)) & Pattern Confirmation
- Continuation Pattern | Valid
* Pennant Structure | Short Set Up
- Reversal Pattern | Not Valid
* Ongoing Entry & (Neutral Area))
Active Sessions On Relevant Range & Elemented Probabilities;
European-Session(Upwards) - East Coast-Session(Downwards) - Asian-Session(Ranging)
Conclusion | Trade Plan Execution & Risk Management On Demand;
Overall Consensus | Sell

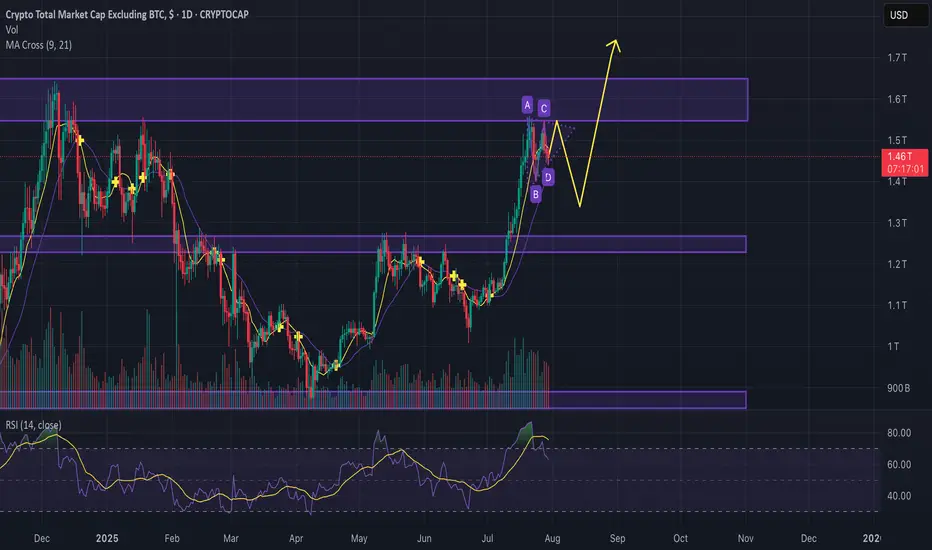
Is altcoin season over before it even started?Guys,
Gonna break down the situation on the chart to see where we can go next with the altcoins.
We see the key resistance levels and now we moving in kinda bullish pennant, but considering descending volumes we can easily test the support line and go back to the 1.25T. (maybe even lower)
After that, seems like we can try to go back and break the 1.64T resistance zone and previous ATH.
Anyway current market is going to be way more different from previous cycles, because huge institutions can feel nice only in hyper volatile, so divide your strategy between short, mid and long term investments to take profits.
Good trades and share your thoughts down to see what others think.
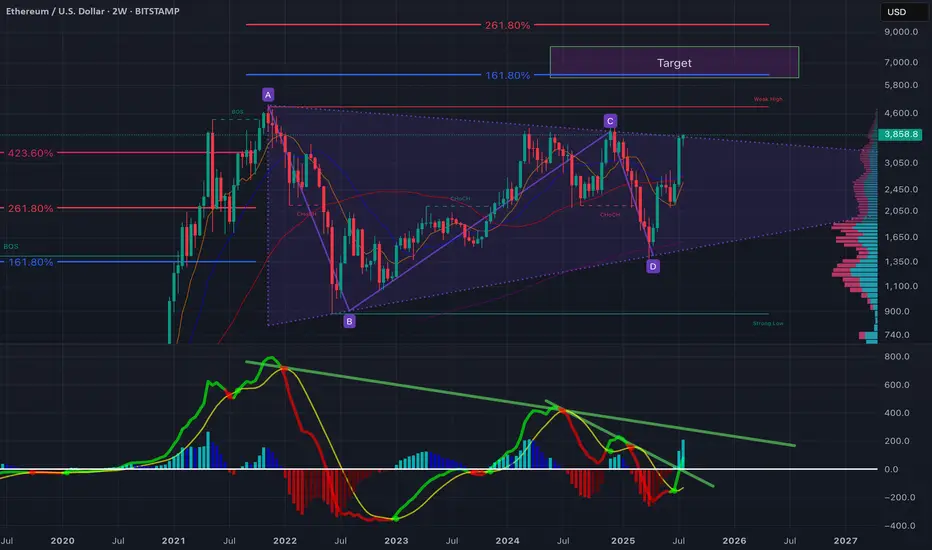
$ETH - Nothing has changedEthereum is showing a significant breakout setup after years of consolidation within a large symmetrical wedge structure (A–B–C–D pattern). The price has just tested the upper boundary of the wedge, and momentum indicators suggest a potential mid-term bullish continuation.
Key Observations:
ABCD Harmonic Structure: Price has respected the harmonic range with D forming a strong higher low near $1,500–$1,600, showing buyer absorption at key demand levels.
Fibonacci Confluence:
The 161.8% extension aligns with ~$5,800, forming the first major target.
A 261.8% extension pushes towards ~$7,000, aligning with the marked "Target" zone.
Volume Profile: Heavy accumulation between $1,500–$2,500 with low resistance above $4,000 suggests a breakout could accelerate quickly.
MACD/RSI Divergence: The momentum oscillator shows a triple bullish divergence (higher lows on momentum vs. lower lows on price), and the downtrend line on the MACD histogram has been broken—often a precursor to sustained upside.
Moving Averages: The 50/100 EMA crossover on the 2-week chart is imminent, historically a strong macro signal.
Bullish Scenario:
A clear close above $4,000 confirms wedge breakout.
Short-term targets: $4,600 (weak high) and $5,800 (Fib 161.8%).
Macro target: $7,000+ if bullish momentum holds through Q4.
Bearish Risk:
Failure to hold $3,500 could lead to retests of $2,500 or even $2,000 (mid-wedge support).
Watch for macroeconomic shocks (rate cuts, liquidity shifts) which have previously caused retracements in crypto markets.
What’s next?
ETH is approaching a make-or-break moment. If the breakout holds, this could be the start of the next major leg up. A strong weekly close above $4,000–$4,200 is critical for validation.
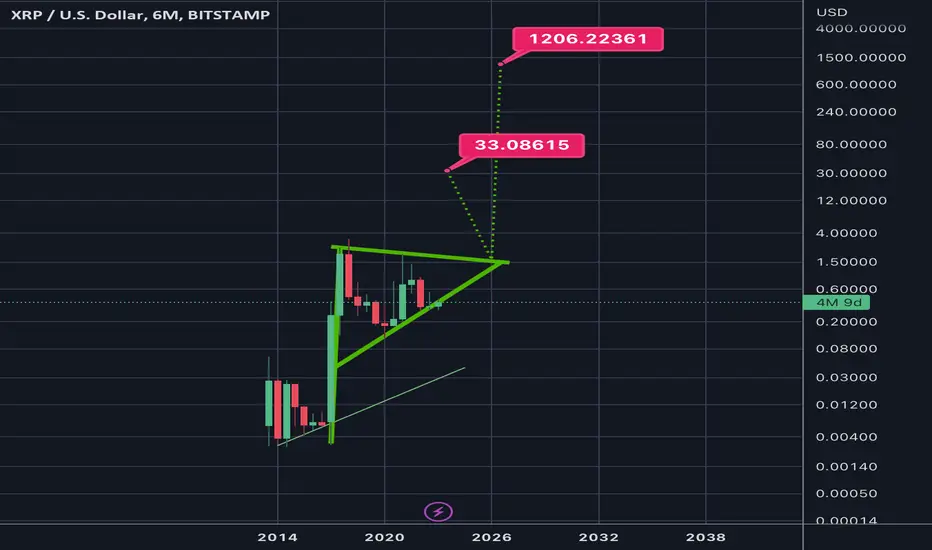
6month log chart on xrpusd suggests crazy potential targetsThe bull pennant we are in shown here on the 6month time frame seems to have a symmetrical triangle for its flag. The breakout target for just the symmetrical triangle is in the $33 range. Factor in the pole of the flag and the potential target skyrockets to 1.2k. Definitely not financial advice and certainly no guarantee it will hit either target as it’s still up in the air if log chart targets reach their full target as reliably as linear chart patterns do. Even if it does hit these targets you can see the apex of the pennant in its current trendline trajectories doesn’t occur until 2026. The only way I see price remaining inside this triangle for that long is indeed if the SEC ripple case is extended through appeal and taken to the Supreme Court. Hopefully not but it isnt impossible. If this were to occur I would simply keep dollar cost average accumulating until it was to break out from the triangle which would give me more opportunity to take some profit at the first target but then also hold onto some of the asset in case it does indeed reach the full bullflag breakout somehow all the way up at 1.2k. Simply posting this hear so I can see how well price action chooses to follow this pattern over the next year or few. Once again *not financial advice*
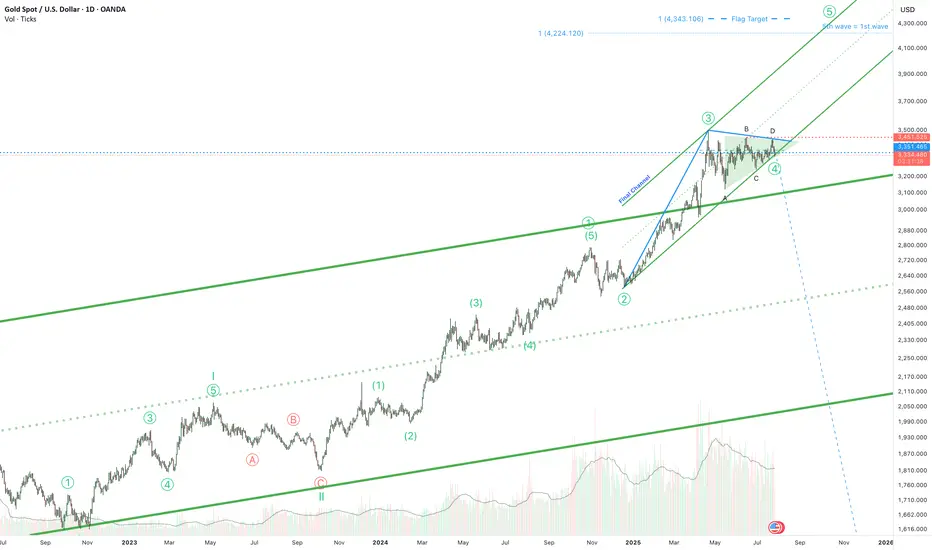
Gold is ready for the 5th wave!Hello! If you're following gold, here's some exciting news. The triangle correction phase that began in April is almost over. It's been a long journey, but we're almost there.
And guess what? The final phase is expected to reach around $4,300. But wait, there's more! The price is holding above the top of a long-term channel. This isn't just a random move; it could be a strong signal that the price could rise even higher than the $4,300 mark.
So, if you're following the gold market, keep your eyes peeled. Big moves could be just around the corner!
HelenP. I Bitcoin can fall to support zone and then start riseHi folks today I'm prepared for you Bitcoin analytics. If we look at the Bitcoin chart, the most prominent feature is the formation of a large bullish pennant following a strong upward impulse. This type of consolidation pattern typically suggests that the market is pausing to gather strength before continuing in the direction of the primary trend. The price is currently consolidating within the boundaries of this pennant, which are defined by an upper resistance line and a strong ascending trend line acting as the lower support. It is crucial to note the confluence of this ascending trend line with the horizontal support zone between 116000 and 116800, creating a powerful area of potential support. My analysis is based on the expectation that the price will make a final test of this key support confluence. I believe that a dip towards the 116000 - 116800 zone will be met with strong buying interest. A clear rejection from this area, confirming that buyers are defending both the horizontal and dynamic support, would be the critical condition validating a long position. A successful bounce should provide the catalyst for a bullish breakout from the top of the pennant, signaling the resumption of the uptrend. Therefore, I have set the primary goal for this subsequent upward move at the 122000 level, a logical target that would confirm the continuation of the bullish market structure. If you like my analytics you may support me with your like/comment ❤️
Disclaimer: As part of ThinkMarkets’ Influencer Program, I am sponsored to share and publish their charts in my analysis.

Bitcoin can start to decline and break support levelHello traders, I want share with you my opinion about Bitcoin. After completing a powerful upward impulse that originated from the buyer zone near 106500, the price action for BTC has transitioned into a corrective market phase. This consolidation has taken the form of an upward pennant, characterised by a narrowing trading range that suggests a significant directional move is forthcoming. Currently, the asset is undergoing a sequence of downward corrections within the pennant, exerting repeated pressure on the critical demand zone between 116500 and 117400. The importance of this zone is amplified by its confluence with the lower trend line of the formation itself. The primary working hypothesis is a bearish resolution, anticipating that persistent selling pressure will culminate in a decisive breakdown of this support. This event would act as a bearish breakout from the pennant, providing strong confirmation for the continuation of the downward impulsive momentum and shifting the local market structure. Therefore, the take-profit level is logically positioned at the 112000 mark. Please share this idea with your friends and click Boost 🚀
Disclaimer: As part of ThinkMarkets’ Influencer Program, I am sponsored to share and publish their charts in my analysis.
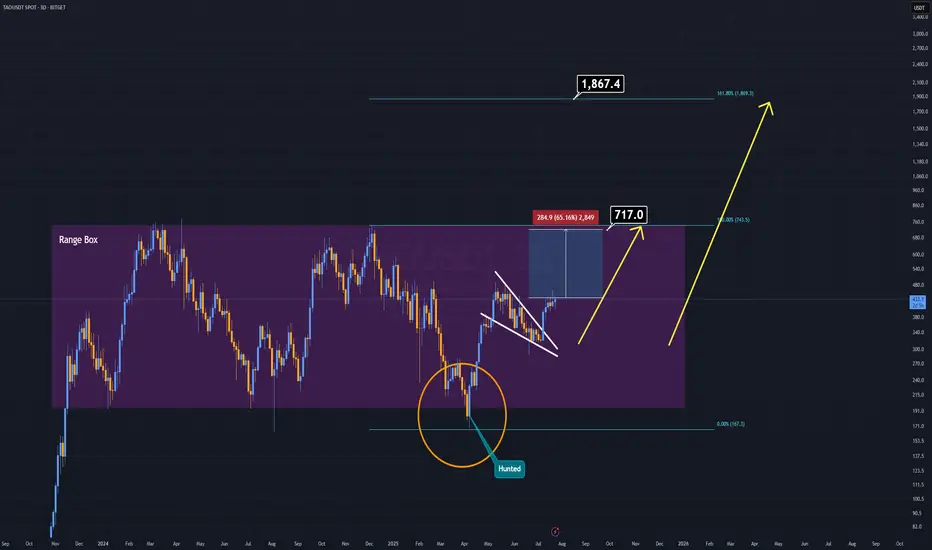
TAO Analysis (3D)Sometimes, there's no need for complex patterns or heavy indicators — and TAO is a perfect example of that.
For years, TAO has been consolidating inside a clearly defined accumulation box. Before the current bullish breakout, it liquidated all weak hands by sweeping the lows — convincing many that the project was dead.
Now, on the daily timeframe, we’re seeing a broken and active pennant formation, which is already being validated.
This structure alone is a strong technical buy signal.
With the upcoming AI-driven bull run, TAO has the potential to outperform many of its AI-sector peers.
This one might just fly ahead of the pack.
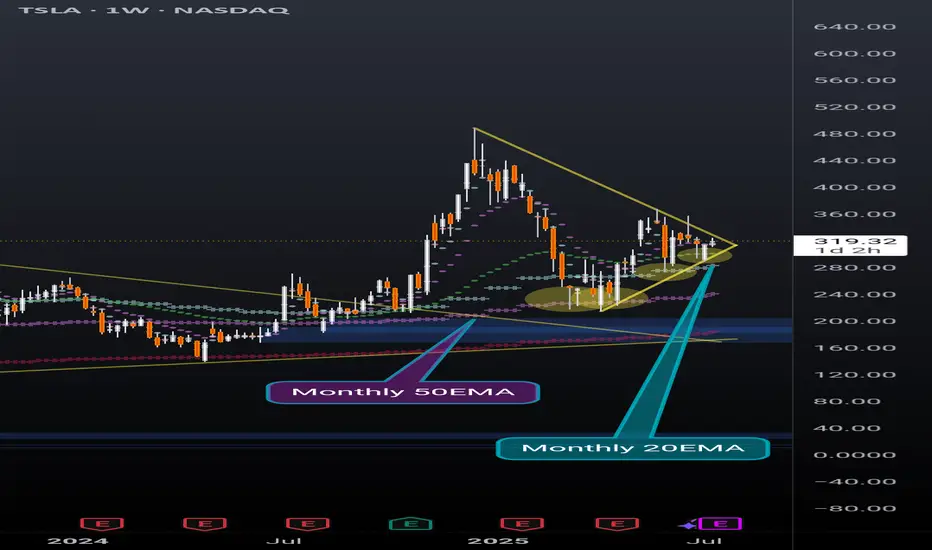
TSLA weekly coiling into something powerfulNever doubt the power of TSLA. Recently broke out of a huge pennant, and now nearing the end of another pennant while simultaneously holding support above the daily 20EMA(overlayed on this weekly chart).
Also recently found support off of the monthly 20EMA (overlayed on this weekly chart) and took 2 direct hits on the monthly 50EMA (overlayed on this weekly chart) before that and rallied up. It will take a lot to crush this setup but anything can happen. Possibly a longer pennant formation.
I'm just a cat not a financial advisor.
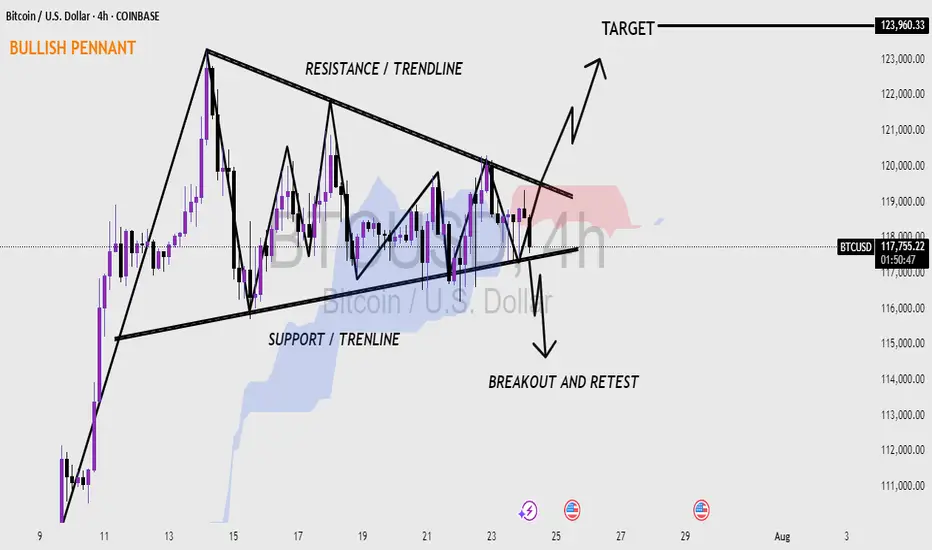
Bitcoin (BTC/USD) 4H CHART - BULLISH PENNANT PATTERN 📊 Bitcoin (BTC/USD) 4-Hour Chart – Bullish Pennant Formation
Bitcoin (BTC) forming a bullish pennant pattern on the 4-hour timeframe.
A bullish pennant often appears after a strong upward move, followed by a period of consolidation, and usually signals a continuation to the upside.
🔍 Key Highlights:
Pattern: Bullish Pennant – a continuation pattern that forms after a strong rally (flagpole), followed by a tightening price range.
Resistance Trendline: The upper black line showing lower highs — where price has repeatedly faced selling pressure.
Support Trendline: The lower black line showing higher lows — where buyers have been stepping in.
Breakout Zone: Price is nearing the apex of the pennant. A breakout above the resistance line would likely confirm the bullish move.
Target Projection: If the breakout is successful, the target is around $123,960, based on the height of the flagpole.
Breakout and Retest: The chart also shows a possible retest of the trendline after breakout, which is common and can offer a second entry point for traders.
Volume Watch: A valid breakout usually comes with increased volume. Monitoring this can help confirm the move.
📉 Downside Possibility:
If the price fails to break out and falls below the support trendline, it could invalidate the pattern and lead to a bearish move — possibly retesting the $110,000 area.
---
The market is at a decision point. If BTC breaks above the resistance and retests successfully, it could push toward $123K. However, traders should watch for both breakout confirmation and false moves.
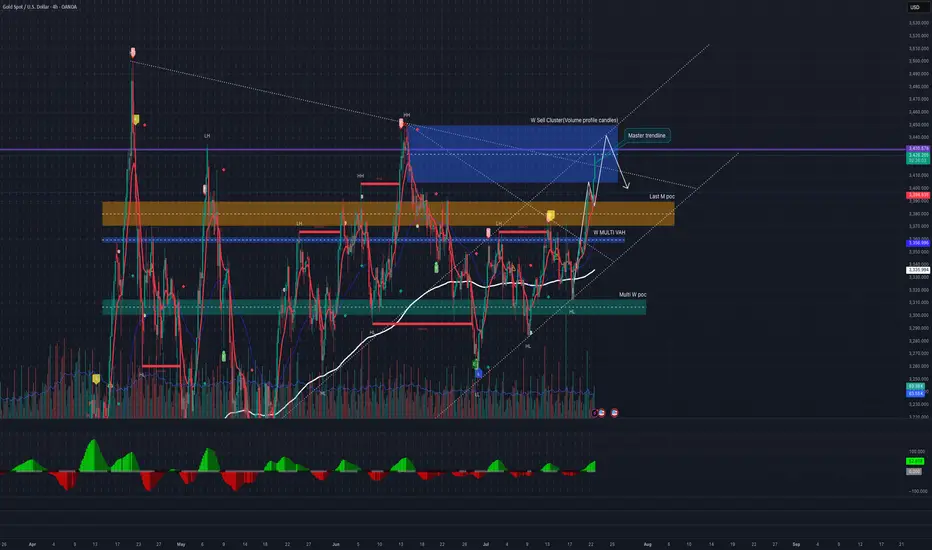
Short Idea possibleFollowing up from the recent run up to @ 3400, from a trend line POV there are still 2 targets that will be favourable for shorts.
These levels are 3400, 3420 to 3440.
The 3420 to 3440 range also confluences with weekly sell cluster, which means seller conviction in the past. As time went by, this level was protected by sellers, high probability they do this same this time
Looking for a slow rotation and Choch on 5 to 15 mins within the ranges of 3420 - 3440 for a strong pullback to @ 3370.
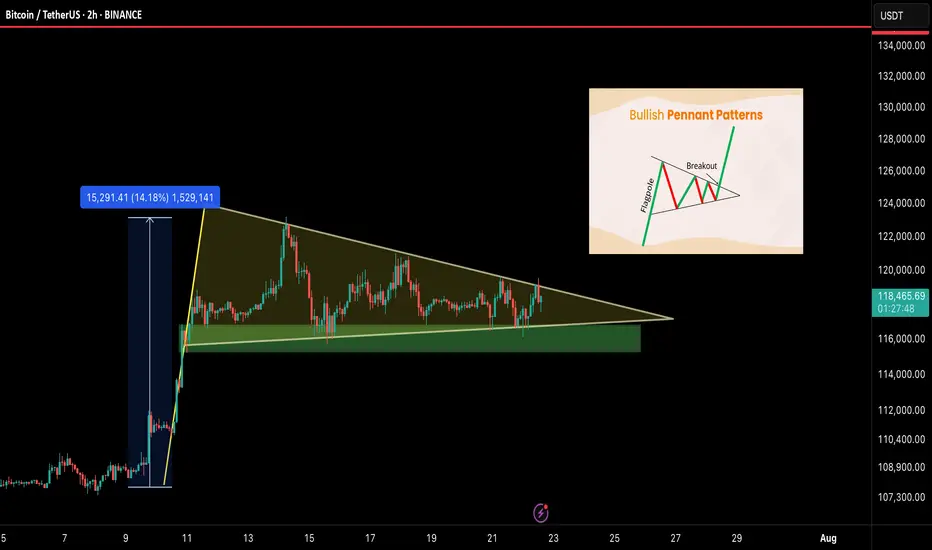
BTC/USDT – Bullish Pennant Setting Up for the Next Leg!Bitcoin is currently forming a bullish pennant — a classic continuation pattern — right after a strong 14% impulse move. This type of structure often leads to a breakout followed by another powerful rally. And it’s coiling up nicely.
🧠 Technical Breakdown:
🟢 Bullish pennant formation in progress
🔽 Support zone: $115.5K – $116.5K
📏 Flagpole projection targets $135K+ on breakout
⚠️ Currently consolidating with lower volatility — breakout could be near
🔍 What to Watch For:
Clean breakout above pennant = breakout confirmation
Daily close below $115K = invalidation zone
Volume spike will likely signal the next move
📢 Final Take:
BTC is showing healthy consolidation after a strong move, and this pennant could launch us toward $135K and beyond. Keep your eyes on the breakout and manage risk wisely.
💬 Share your thoughts below & smash that ❤️ if you’re watching this move!
Are you Ready for Next Leg Up BTC Breakout is done on 4H wait for retest and you can take long after confirmation
TP 128K 130K For now
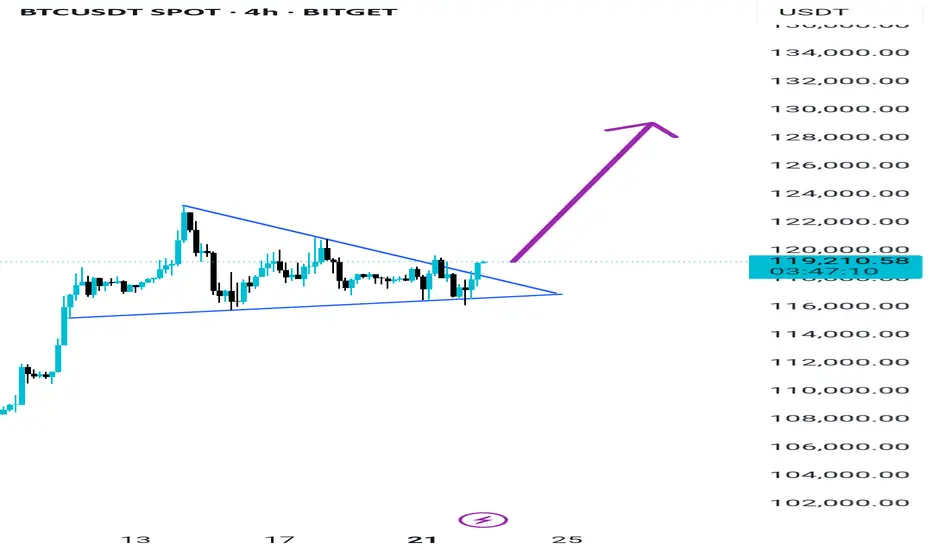
Bitcoin: Setup Builds for a Run Back Towards the HighsBitcoin is coiling within what resembles a bull pennant pattern, hinting at another bout of consolidation before the rally resumes. Trading near the lower end of the recent range, Monday’s pullback offers an appealing entry point, allowing longs to be established around current levels with a stop beneath the July 15 low for protection.
The downtrend from the record highs looms as the first hurdle, sitting around $119,700 today. A break above that level could prompt an accelerated move towards the current record high just above $123,000—an appropriate target for the trade.
Good luck!
DS

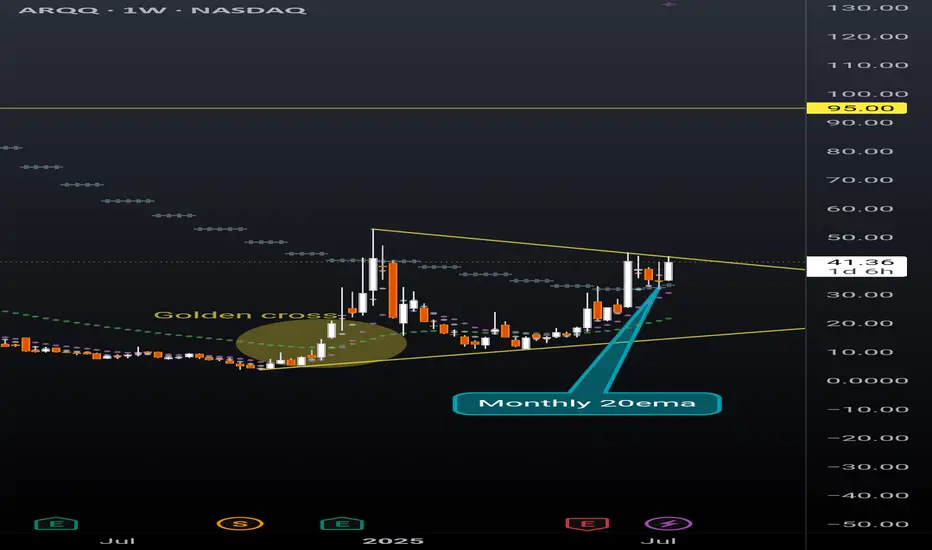
ARQQ weekly pennantBeautiful weekly pennant on ARQQ weekly timeframe. This chart is coiling nicely for a continuation. Still early in the process of reaching breakout but given the recent momentum in this sector a premature break to the upside can happen at any moment.
The ticker is currently sitting above the monthly 20ema (overlayed on this weekly chart), and just had a strong bounce off the daily 20ema (overlayed on this weekly chart). Golden cross is also highlighted that occurred in December 2024 with the daily 50ema retracing back to the daily 200ema and then continuing the uptrend earlier this spring.
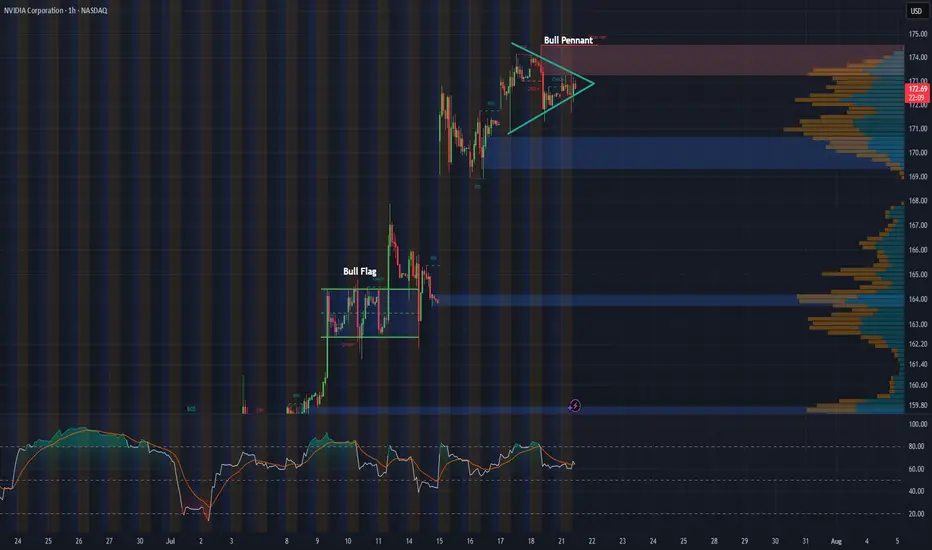
NVDA 1-Hour Chart UpdateHey everyone, just wanted to share a quick update on NVDA’s 1-hour chart. Following last week’s bull flag breakout, the stock appears to be consolidating into what looks like a solid bull pennant formation.
With major tech earnings on the horizon and the recent approval to sell H20 chips to China, this pattern could be setting the stage for another breakout. Will NVDA continue its impressive rally, or is this just a breather before the next move?
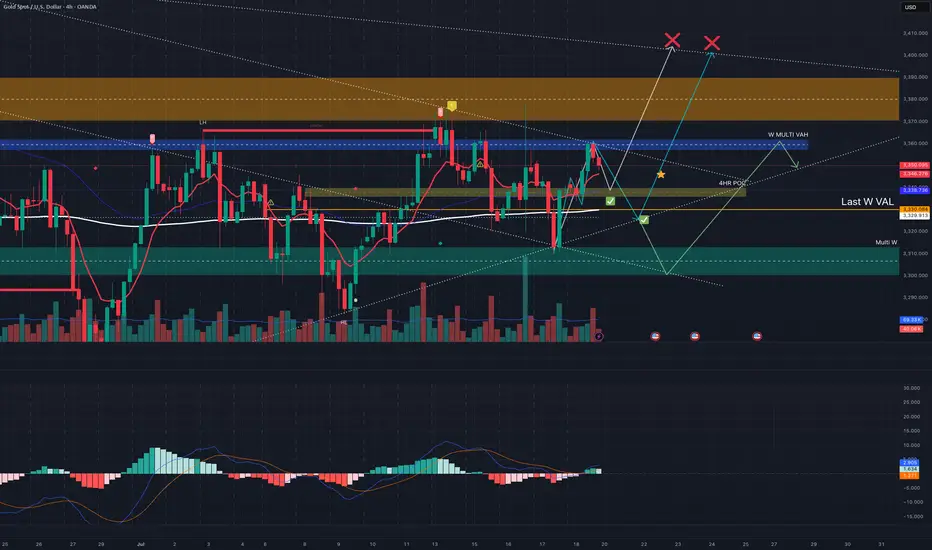
Trend breakout towards master(ATH) trend line Purely from a trend line POV and HTF (M, W,D) POCs, which have been tested multiple times confirming their validity, best case scenario is a retest of the upper trend line that originates from the all time high.
The lower trend line has been tested and defended @ 3311. The continuation of this leg has faced initial resistance from a level @3360 where price closed below decisively after news event.
Favourite scenario is a pull back to last weeks VAL where the weekly candle closed above signalling buyers were keen on such level @3300, clear support formed to confirm validity of the level and upside target to 3400
Is it finally time for a rally?Looking at NVIDIA (NVDA) on the weekly chart over the past two years, a significant gap up becomes apparent around April, which persisted for much of the year. Considering the recent news and the stock's pullbacks lately, this may be the moment for NVDA to resume its upward grind. The coming weeks will reveal its direction.
Additionally, it's worth noting the formation of a massive bull pennant on the weekly chart. If history repeats itself and this pattern holds, the next 2 to 6 weeks could prove to be a thrilling period for NVDA.

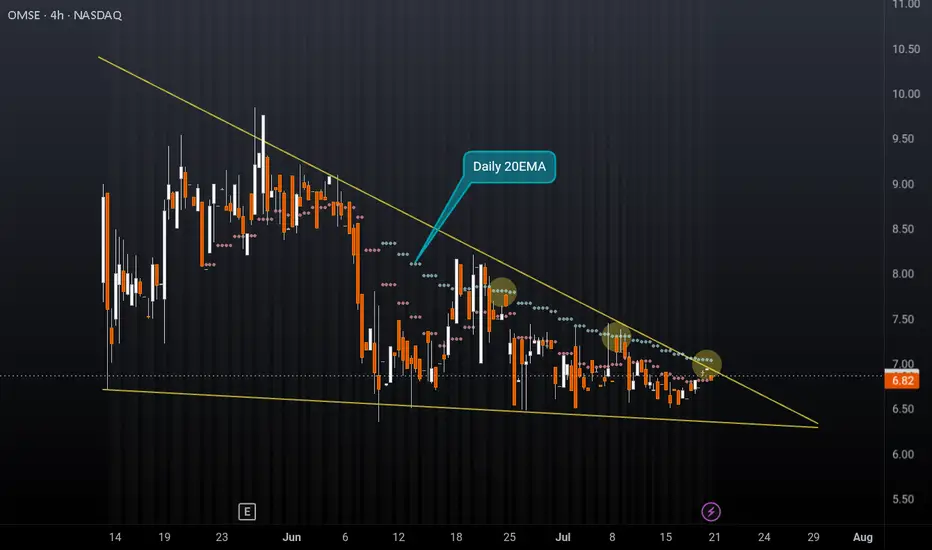
OMSE falling wedge after IPONeutral on OMSE, another relatively new ticker. Similar to my previous post on DVLT, this ticker is fundamentally strong but stuck in a falling wedge after IPO. Price is struggling to break the daily 20EMA (overlayed on this 4H chart) and has rejected multiple times. The company has strong financials, take the time to do some DD, however this pattern could break to the downside and hit new lows before we see any type of rally given the weakness in this sector at the moment. Set alerts and watch the price action play out, or don't bet your rent money on any direction if entering a position.
I'm just a cat not a financial advisor.