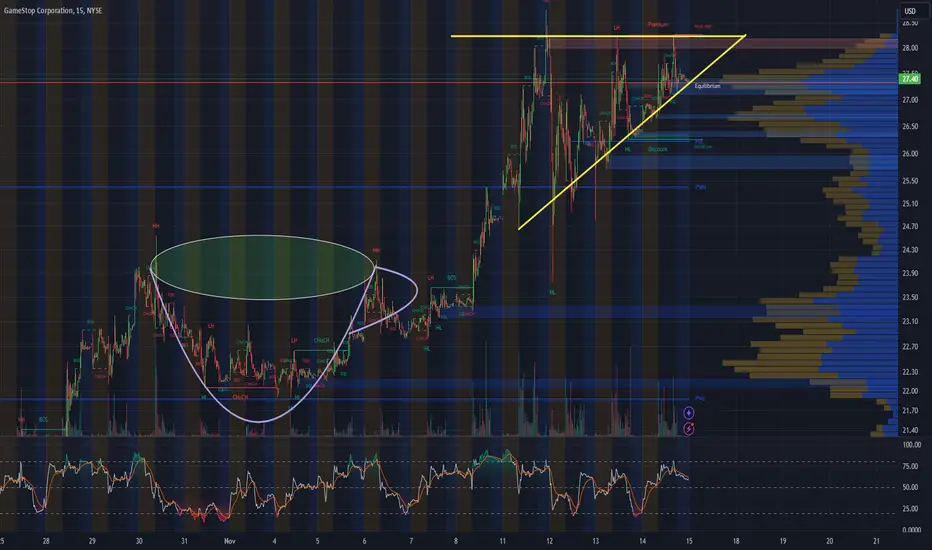
15 min Pennant has now transitioned into an Ascending Triangle! Hey everyone! Just wanted to give you an exciting update for those tracking the Bull Pennant on the 15-minute chart. As of today, it looks like the Pennant has transitioned into an absolute textbook Ascending Triangle!
Here's the breakdown of what we have across all timeframes as of today,
15-minute chart: Ascending Triangle, 4-hour chart: Bull Pennant, Daily chart: Cup & Handle, Weekly chart: Golden Cross
Bullish patterns are lighting up across all timeframes, perfectly aligning with the recent surge in institutional buying. Given all this, I've never been more bullish on GME than I am right now. We are on the brink of making history!
Pennant
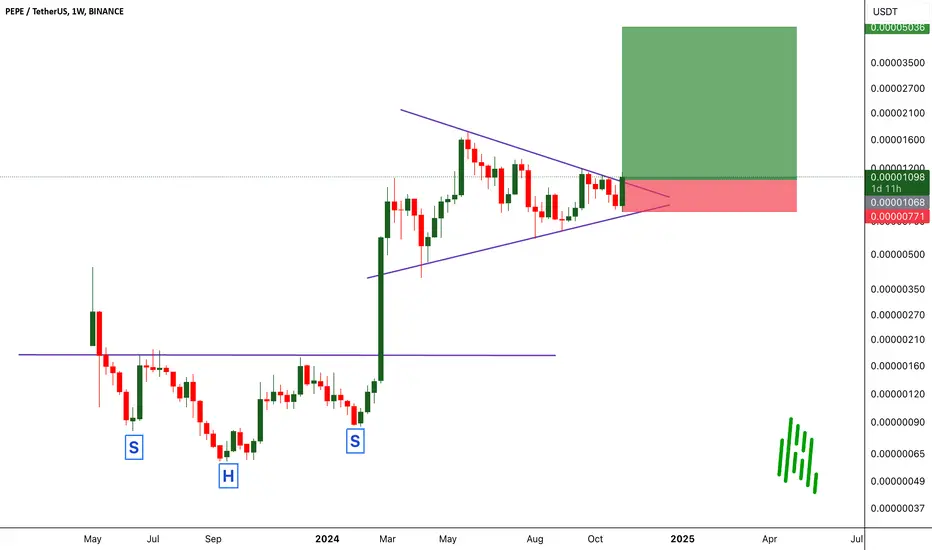
PEPEUSDT Pennant Breakout: Ready for Lift-Off? BINANCE:PEPEUSDT has just broken out of a bullish pennant formation, hinting at a potential strong upmove. Recently, it formed an inverse head and shoulders pattern that led to impressive gains, and now, with this breakout, we could see a similar rally. This setup mirrors BINANCE:DOGEUSDT ’s previous path, suggesting a possible bullish follow-through.
As always, trade with caution. Set your stop loss to manage risk and make the most of this opportunity safely. Trade smart, and let’s see where BINANCE:PEPEUSDT takes us!
OKX:PEPEUSDT.P trading at $0.000011
Buy level: Above $0.00001
Stop loss: Below $0.0000077
TP1: $0.000013
TP2: $0.000017
TP3: $0.000025
TP4: $0.00005
Max Leverage 2x
Follow Our Tradingview Account for More Technical Analysis Updates, | Like, Share and Comment Your thoughts
GME 15 min Bull Pennant Watching the 15 min on GME, and it seems that it has formed a pretty substantial Bull Pennant on the 15 min. This comes just after the Cup & Handle breakout earlier this week. We can also see that, the Ultimate RSI has Oversold, while setting a higher low withing the Pennant.
I believe that once this Pennant starts to breakout, GME is going to stretch into the 30s, and with no current supply above $29, this may very well see it's way into the $60s real quick. This is only the 15 mind you. We still have a much larger Pennant on the 4hr, another Cup & Handle on the 1 day, and a Golden Cross on the weekly. Pretty much every timeframe is showing a bullish pattern right now. If you ask me, I would say it's go time.
Remember, the last time GME broke out from a Golden Cross on the weekly, was back in July of 2020 and lasted until Jan of 2021. And we saw a 12,000 percent run over the span of 6 months.
If you're currently short, you better say a prayer. To everyone else, let the games begin! 🤙

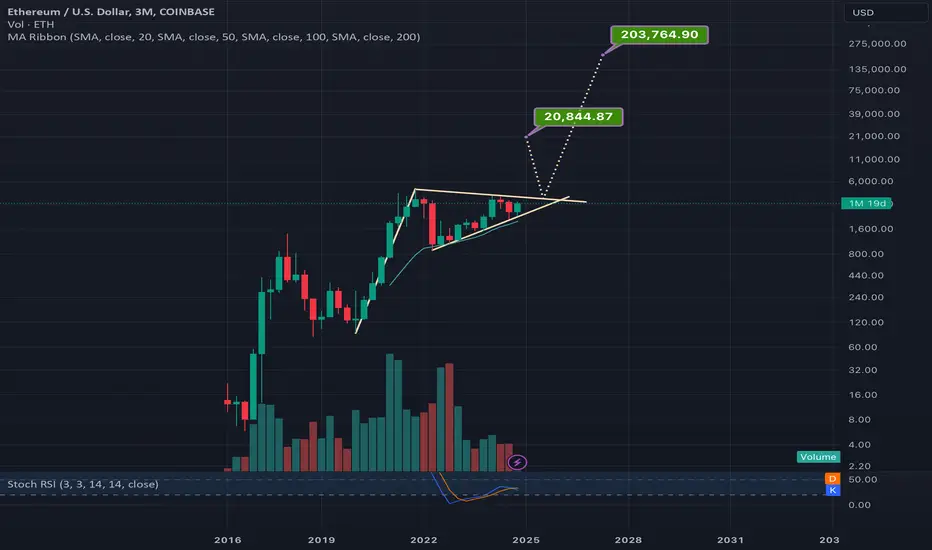
Bullpennant on 3month logchart for ETH has outlandish targetsIf we went just by the triangle portion of the pennant breakout target, that can take ethereum to 20k. This is potentially a possible target that can be hit during the current bullrun, the second higher target in the 200 thousands is for the entire pennants breakout target. Seems way less likely we can hit that target this bull run but is perhaps not improbable to reach by the bull run after this. Then again, if PlanB’s scenario for bitcoin to somehow reach a million before 2026 actually somehow came to fruition, then the full target of this pennant being reached this bull run would suddenly have some slight probability of happening. You can see here on this chart that to get to Ethereum’s current all time high we basically broke upward from a pennant prior to the current one we are in and the breakout target for that pennant’s triangle portion was just slightly lower than eth’s current all time high. The current pennant’s 20k target for it’s triangle portion only is actually very close to the previous pennant’s full pennant target…so essentially by reaching the current pennants triangle breakout target this bull run we would reach the full target of the the previous pennant breakout from last bull run, making it take 2 bull runs to reach the full target of the previous pennant. This makes me believe in order to reach the full 200k+ target of the current pennant we are in it will likely not occur until the next bull market after the current one. However if PlanB’s million dollar bitcoin before 2026 scenario were to actually play out that would be the one condition where we could see the current pennant reach its target in the current bull run. I know it sounds outlandish and highly unlikely so for now I’ll put that at a very low probability, but a low probability is still better than an impossibility. *not financial advice*
Solana’s Cup&handle, Bullpennant, & symmetrical triangle targetsSolana already with a strong green candle on the Daly right now as price action is currently above the brown rimline of the cup and handle. Will be interesting to see how quickly it is able to confirm the breakout, still not completely validated yet but looking promising on the daily chart(not shown here). Since these patterns seem most valid on the monthly time frame it is going to take more than just one bullish daily candle close to confirm the breakout most likely. *not financial advice*
HIMATSEIDE:- Will this be next multi bagger in 2025?Company produces home textiles for over 12 global brands, licensed and owned. It owns exclusive license rights of global iconic brands like Calvin Klein, Tommy Hilfiger, Kate Spade, Royal Velvet, Barbara Berry and Waverly.
It also entered into a licensing agreement with The Walt Disney company to manufacture and distribute a broad range of home textile products inspired by archives and characters from all its franchisee including Disney, Marvel, Pixar and Lucas to increase its presence in the European region.
Not a great earnings, but it has a potential to grow.
Lets see.. I am Investing in it any way..!!
Disclaimer
The information and publications are not meant to be, and do not constitute, financial, investment, trading, or other types of advice or recommendations supplied or endorsed by Me.

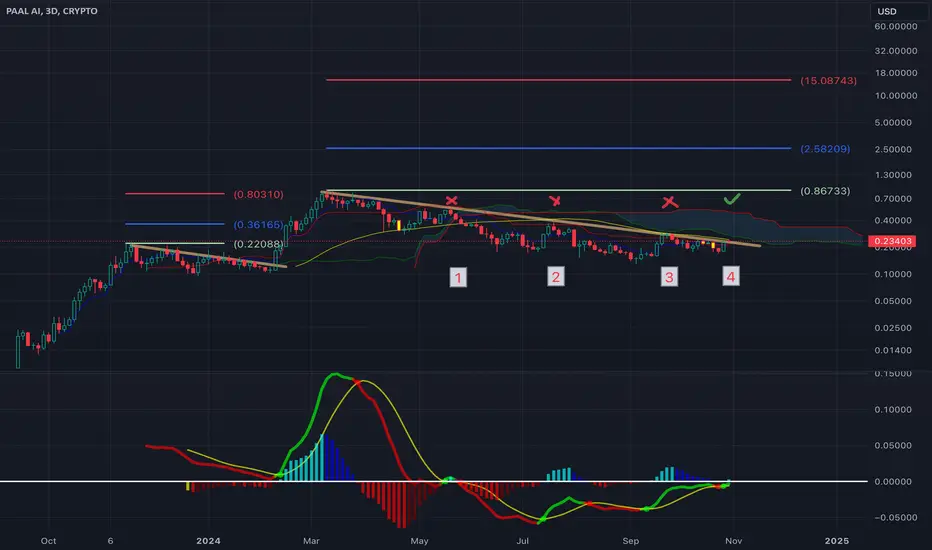
$PAAL Consolidation - Almost CompleteIt looks to me like the $PAAL token is bottomed out, and looks primed to continue ascending up!
$200m market cap right now, topped out at $600m before. If BTC gets and holds new ATHs alts will be sending-- get into your overlooked alts right now and prepare for takeoff :)
nfa dyor
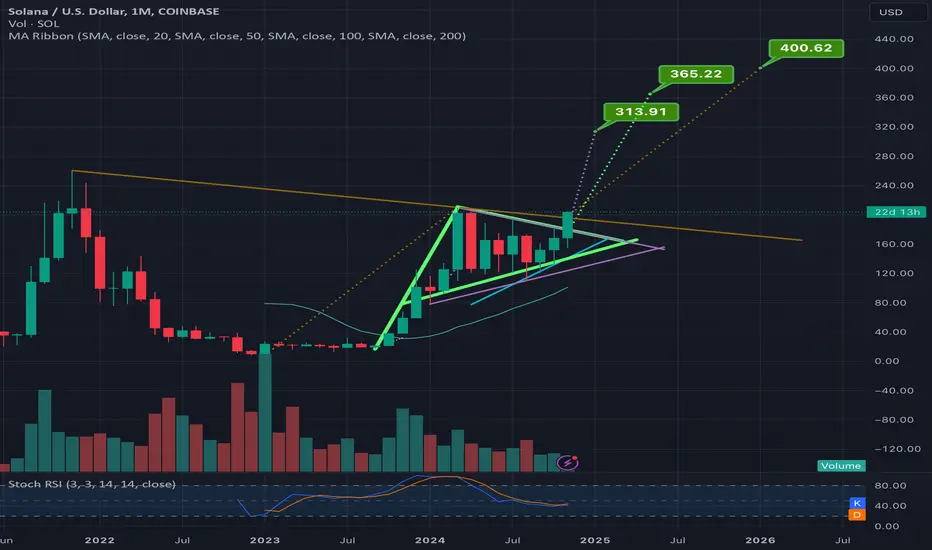
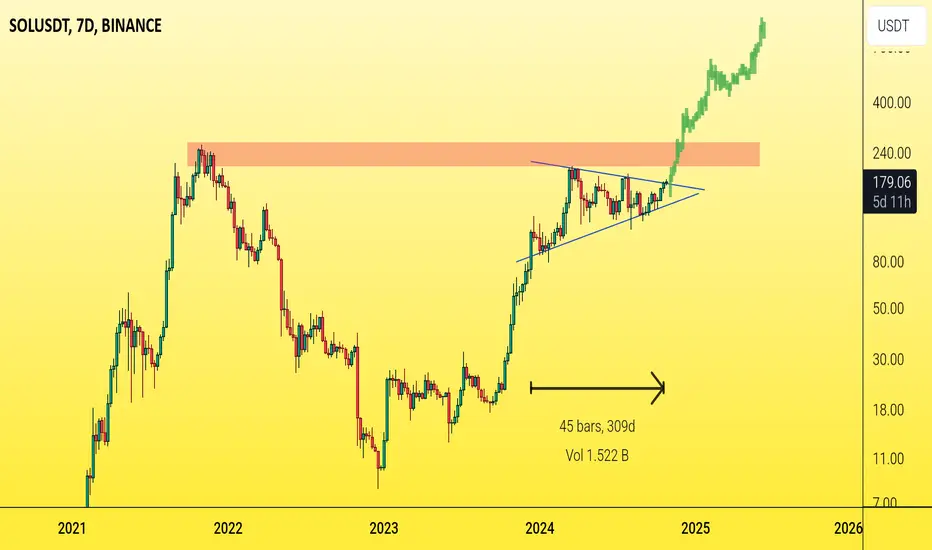
SOLUSDT - Buy high sell higher!More than 300 days trading above 125$
Take this whole time of consolidation to make a bullish pennant pattern in 7d chart
Sol looks bullish as BTC keep going high and higher
We are five days away from the weekly close
And it's obviously sol looking for breakout... successful breakout will take us to 400$ in midterm
Best regards Ceciliones 🎯
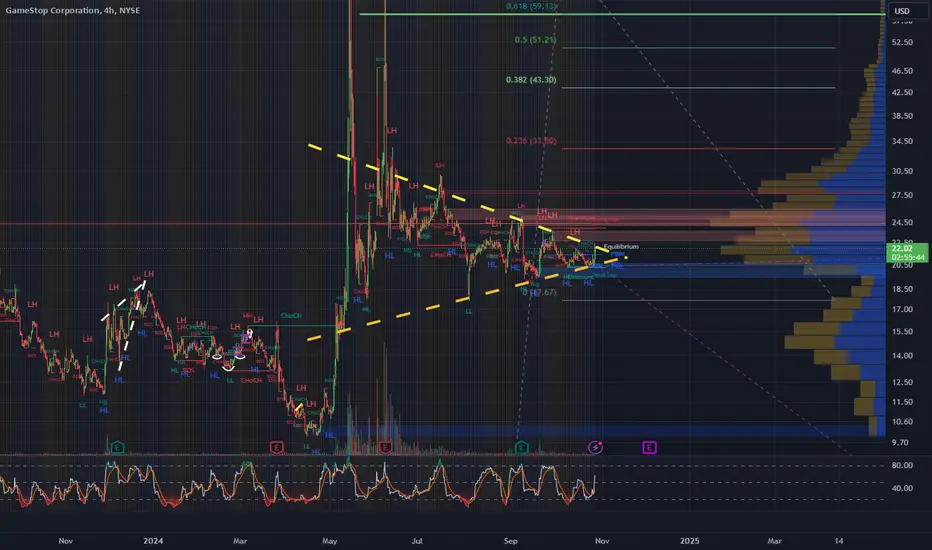
Bull Pennant on the 4hrTracking this monster Bull Pennant on the 4hr. Trend based Fib ext, is projecting a breakout to the $58-$60 range, with no current ceiling in place above the $28 mark on the 4hr. If GME breaks above $62 on the daily, the next stop will be $87... Stay tuned.
SOLUSD: Bullish Pennant Pattern on 1-Hour ChartSOLUSDT Technical analysis update
SOLUSDT is forming a bullish pennant pattern on the 1-hour chart, with the price now moving toward the breakout. Once the breakout occurs, we can expect a bullish continuation in SOL
Pennant formed inside the flag pattern, we posted flag pattern analysis in the previous idea.

Bitcoin Analysis ==>> Bearish Pennant Pattern!!!Bitcoin ( BINANCE:BTCUSDT ) moved and filled the CME Gap as ✅I expected from the previous post .
Bitcoin was able to move itself below the Important Resistance Line and Resistance zone($70,080- $68,250) .
Regarding Elliott wave theory , Bitcoin seems to have completed the main wave 5 as I expected with the Ending Diagonal . Currently, Bitcoin has completed 5 bearish (small) waves and is completing corrective waves .
In terms of Classical Technical Analysis , Bitcoin has the ability to form a Bearish Pennant Pattern or Head and Shoulders Pattern . ( I drew the pattern separately for you so that the chart is not busy .)👇
I expect Bitcoin to continue its decline to at least $65,500 , and if the Support zone($66,500- $64,480) is broken, we should expect more Bitcoin declines .
⚠️Note: If Bitcoin can break the Resistance zone($70,080-$68,250) and Resistance lines, we should wait for a new All-Time High(ATH) for Bitcoin.⚠️
Bitcoin Analyze (BTCUSDT), 1-hour time frame⏰.
🔔Be sure to follow the updated ideas.🔔
Do not forget to put Stop loss for your positions (For every position you want to open).
Please follow your strategy and updates; this is just my Idea, and I will gladly see your ideas in this post.
Please do not forget the ✅' like '✅ button 🙏😊 & Share it with your friends; thanks, and Trade safe.

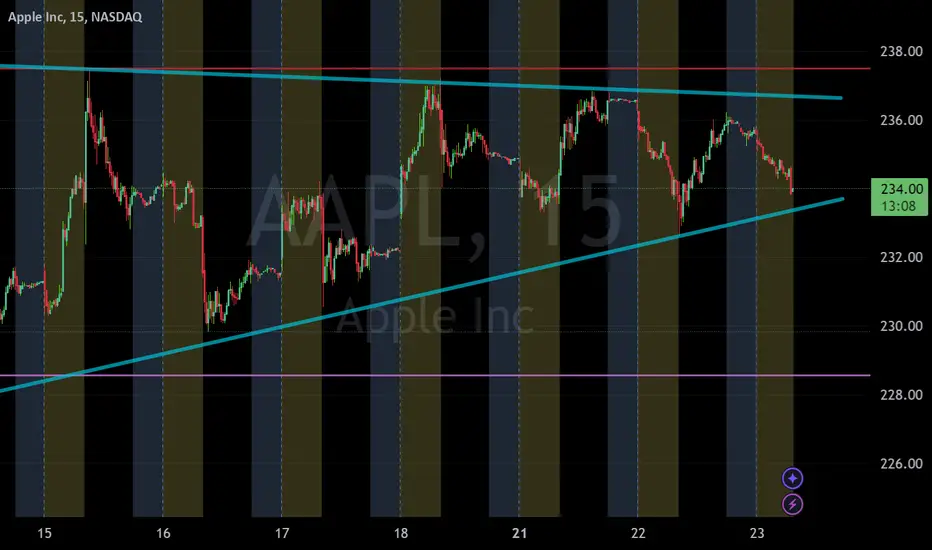
AAPL Apple Inc. Ascending Triangle NASDAQ:AAPL AAPL Apple Inc. Ascending Triangle Look, it looks like it might break to the upside depending on market conditions. Looking at next week's 237.5 calls. Not financial advice could easily see a pull back, AAPL like NVDA loves to close very close to strike prices making options worthless.
Bitcoin can rebound up from pennant to 71K pointsHello traders, I want share with you my opinion about Bitcoin. Observing the chart, we can see that the price rose to the current support level, which coincided with the support zone. After it reached this level, it some time traded near and even entered the support area, but then dropped to the buyer zone. Also, the price started to trades inside the pennant, where later, BTC rebounded from the buyer zone and started to grow. Soon, the price turned around and made a correction movement to support line of the pennant. After this, BTC turned around and made impulse up, making a fake breakout of the 60800 level. In a short time later, the price reached the current support level, broke it, and made a retest. Then it continued to grow until reached the resistance line of the pennant, after which, a not long time ago, it rolled down. So, at the moment, I think that the price can decline to support line and then rebound up, exiting from the pennant pattern. After this, I think BTC can continue to grow, for this case, I set my TP at 71000 points. Please share this idea with your friends and click Boost 🚀

AGLD/USDT Bullish Breakout: Two Resistance TargetsAGLD/USDT has formed a bullish pennant pattern, and we’ve already seen a breakout. My first target is the pink zone, which acts as the initial resistance. If the price continues upward, my second target is the next pink resistance zone. Additionally, if the price reaches this second resistance, there could be an opportunity to short, depending on how the price reacts to this key level.

Rising wedge breakdownLiterally no ne will see this on TradingView, but I'm still going to post it.
Bookmark this: it's over.
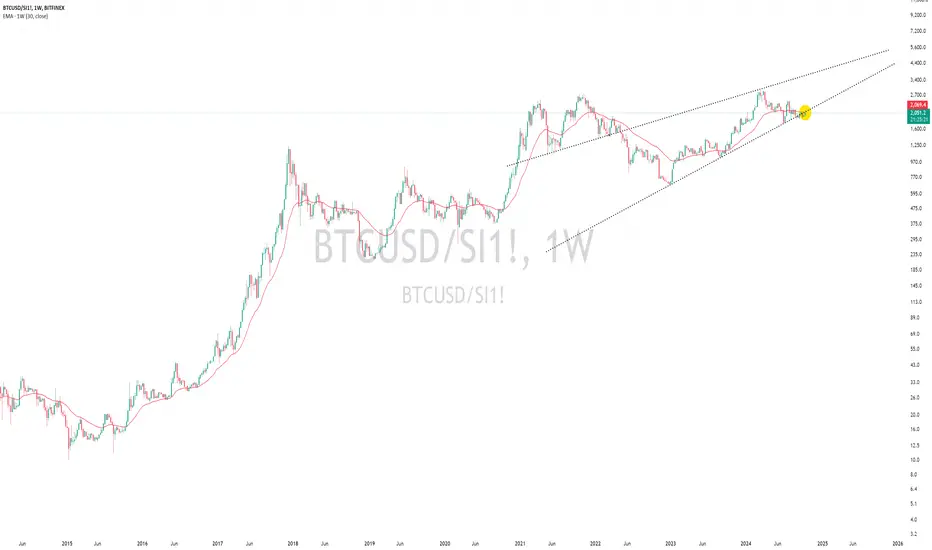
Precious metals alpha is taking over the reigns from sh*tcoin beta (bitcoin).'
Massive rising wedge breakdown at the same time as weekly EMA30.
Bullish Pennant breakout for Hive! $39 CAD price target.Hive appears to be trading in multiple bullish patterns.
Noticeably the stock is creating higher lows and higher highs forming a bullish pennant & a crude bull flag pattern.
Hive has bounced off the upward sloping support of the pattern 4-5 times, displaying strong support for the bulls.
Considering Hive is correlated to the price of Bitcoin & Ethereum we should see some volatile price action over the upcoming months heading into the US presidential elections..
Bullish cross on the KST
Also, the halving will start being priced into bitcoin as a supply shock is on the verge of occurring near term.

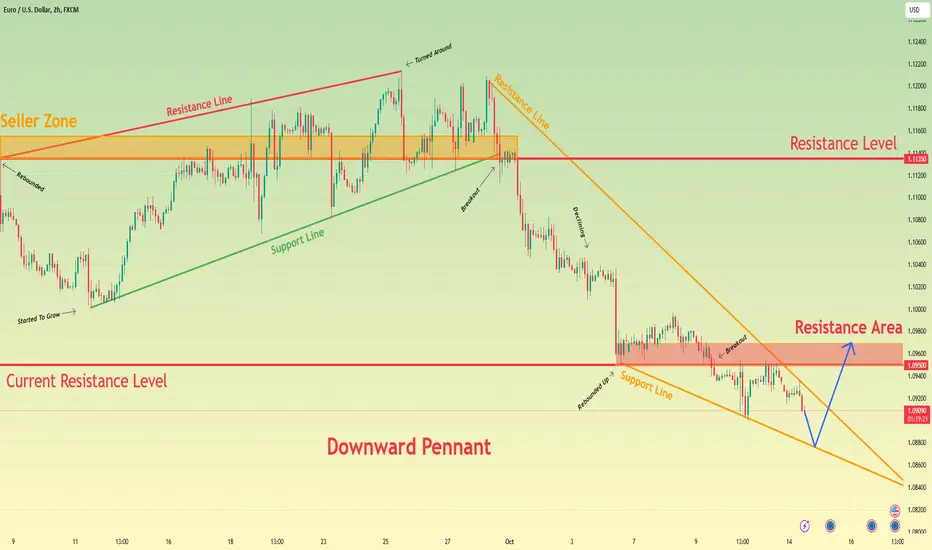
Euro can little correct and then bounce up to resistance areaHello traders, I want share with you my opinion about Euro. Looking at the chart, we can see how the price rebounded from the resistance line, and fell to the support line, breaking the 1.1135 resistance level, which coincided with the seller zone. After this, the price bounced from the support line and started to grow to this level. When it reached it, EUR some time traded between the 1.1135 level and later finally broke it and reached the resistance line. But then the price turned around and fell to the 1.1135 level, after which tried to grow but failed and continued to decline inside the pennant. Euro first broke the 1.1135 level and dropped to the support line of the pennant, which coincided with the current resistance level and resistance area. Price some time traded inside this area and soon broke the 1.0950 level and fell to the support line of the pennant pattern. Also, the Euro tried to back up, but failed and at the moment it continues to decline near the resistance line of the pennant. In my opinion, the price can decline to the support line and then rebound up to the resistance area, thereby exiting from the pennant and breaking the resistance level. For this reason, my TP (1.0950) is located inside the resistance area. Please share this idea with your friends and click Boost 🚀
$SOL Breakout 200DMA Now RetestSolana broke out and is testing support on the 200DMA
CRYPTOCAP:SOL might see a little more downwards pressure ~$145 to retest the lower region of support, but should be blue skies ahead with a close above ~$163.
Look for the Golden Cross for confirmation.

The Monthly has a bullish pennant with an even higher targetThe same bullflag on the weekly chart that has a 99k breakout target morphs into a bullish pennant with an even longer flagpole on the monthly chart. If the bullish pennant were to confirm a breakout in the zone price action currently resides in, the breakout target for this monthly bullish pennant is around 115.9k! *not financial advice*

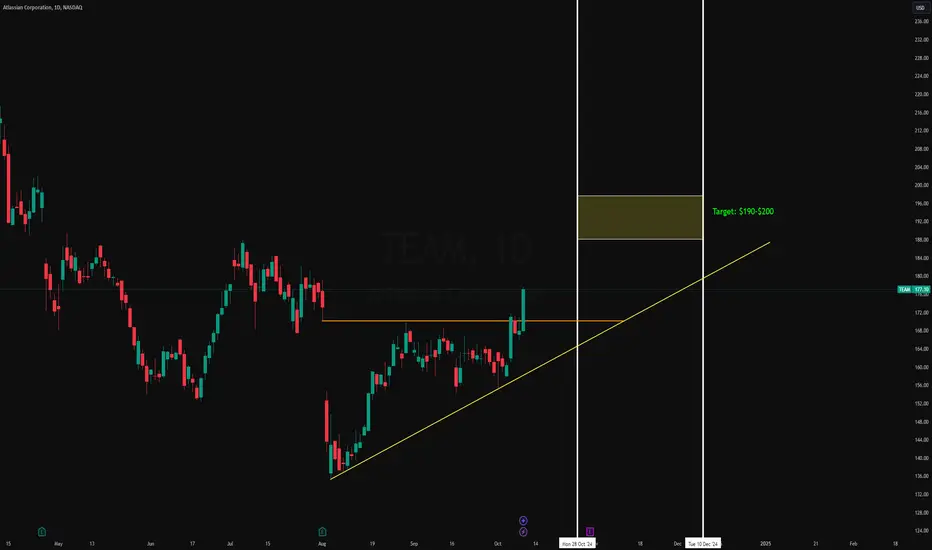
Atlassian Corporation (TEAM) -Ascending Triangle Breakout TargetOverview: Atlassian Corporation (NASDAQ: TEAM) has been forming an ascending triangle pattern, which typically signals a bullish continuation. The stock has broken through a key resistance level at approximately $165, indicating potential further upside.
Technical Setup:
Pattern: Ascending Triangle
Breakout Level: ~$165
Target Zone: $190 - $200 (as shown in the highlighted area on the chart)
Trendline Support: The upward trendline has been acting as a consistent support, guiding the stock higher since mid-August.
Earnings Catalyst: With earnings approaching, the release could act as a potential catalyst to expedite the completion of this pattern, either causing a breakdown below the neckline or a temporary rebound before further selling pressure.
Price Action:
The recent breakout above the horizontal resistance around $165 signals the possibility of a bullish move toward the target zone of $190 to $200.
The breakout is confirmed by the price action breaking above the consolidation range and holding above the previous resistance.
Key Dates:
Short-term Target Date: Potentially reaching the target by December 2024, with further continuation into 2025 depending on market conditions.
Risk Management:
A breakdown below the trendline support (~$160) would invalidate the setup and may suggest a reassessment of the position.
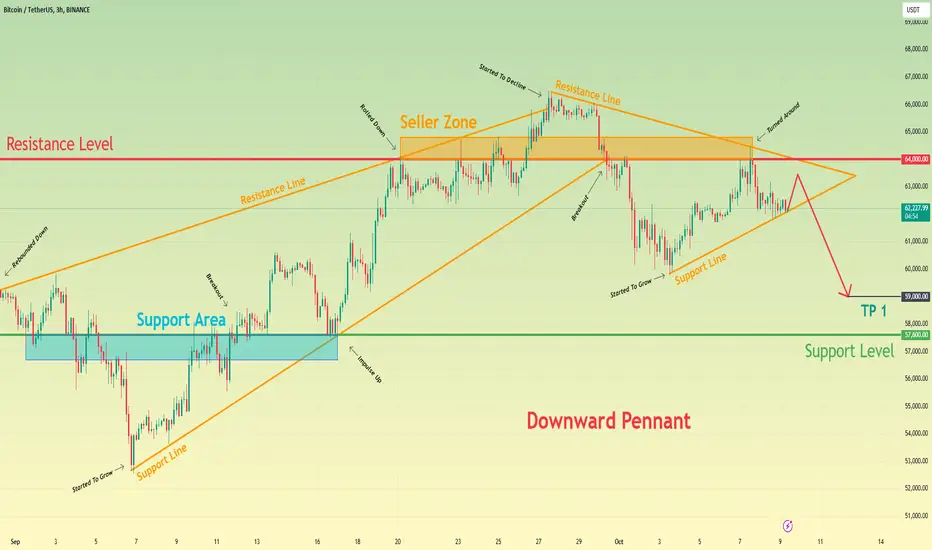
Bitcoin will exit from pennant and continue to fall to 59KHello traders, I want share with you my opinion about Bitcoin. By observing the chart, we can see that the price some days ago entered to wedge, where it at once rebounded from the resistance line and fell to the support line, breaking the support level. After this movement, BTC started to grow and soon reached 57600, which coincided with the support area, broke it, and made a retest. Then it a little, after which made a correction to the support level and then made an impulse up to the resistance line of the wedge, which coincided with the 64000 level with the seller zone. Bitcoin some time traded near this level and later broke it, after which even exited from the wedge, but then it started to decline inside the downward pennant. Later price broke the 64000 level and dropped to the support line of the wedge, turned around and in a short time rose to the resistance level, but a not long time ago it turned around and fell to the support line. Now, the price trades near this line and I think it can rise a little and then continue to decline, thereby exiting from the pennant. For this case, I set my TP at 59000 points. Please share this idea with your friends and click Boost 🚀
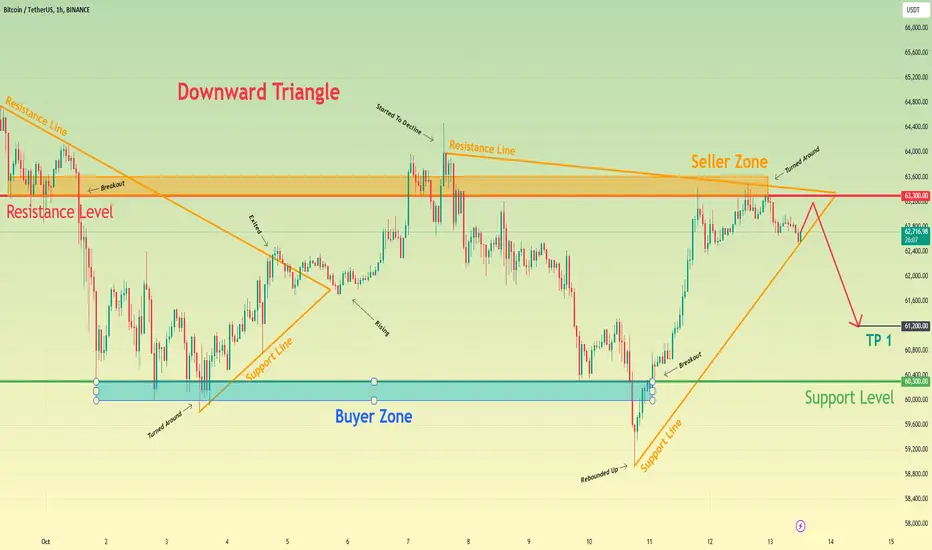
Bitcoin can exit from triangle and continue to declineHello traders, I want share with you my opinion about Bitcoin. Observing the chart, we can see that the price a few moments ago entered a downward pennant, where it soon declined to the resistance level, which coincided with the seller zone and broke it. Then the price dropped to the support level, and even later entered the buyer zone, where it reached the support line and at once turned around and started to grow. In a short time later BTC reached the resistance line of the pennant, exited, and then made the correction. After this, the price rose to the 63300 resistance level, broke it, and even rose higher than the seller zone, but soon turned around and started to decline inside the downward triangle. Price broke the 63300 level and fell to the support level, where some time traded near and later dropped to the support line of the triangle. Soon, BTC turned around and broke the support level one more time and grew to a resistance level, but a not long time ago it turned around and fell to the support line of the triangle. So, in my opinion, BTC can rise a little and then rebound down, thereby exiting from the triangle. Also then it can continue to decline, therefore I set my TP at 61200 points. Please share this idea with your friends and click Boost 🚀
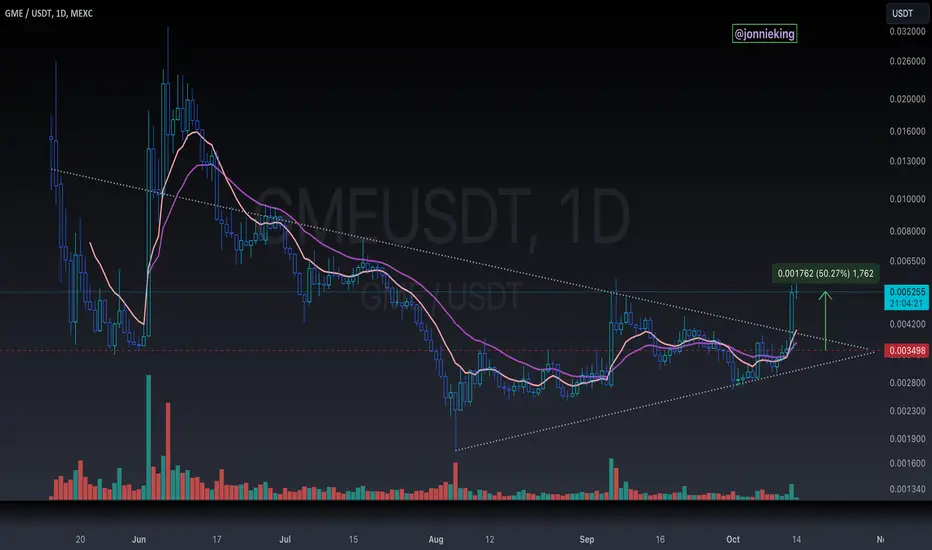
$GME Memecoin Massive Breakout!Massive breakout for NYSE:GME on the Daily with the 9/21 EMA crossover.
Daily close 50% on the day.
Any reason for this pump other than it being MASSIVELY undervalued?