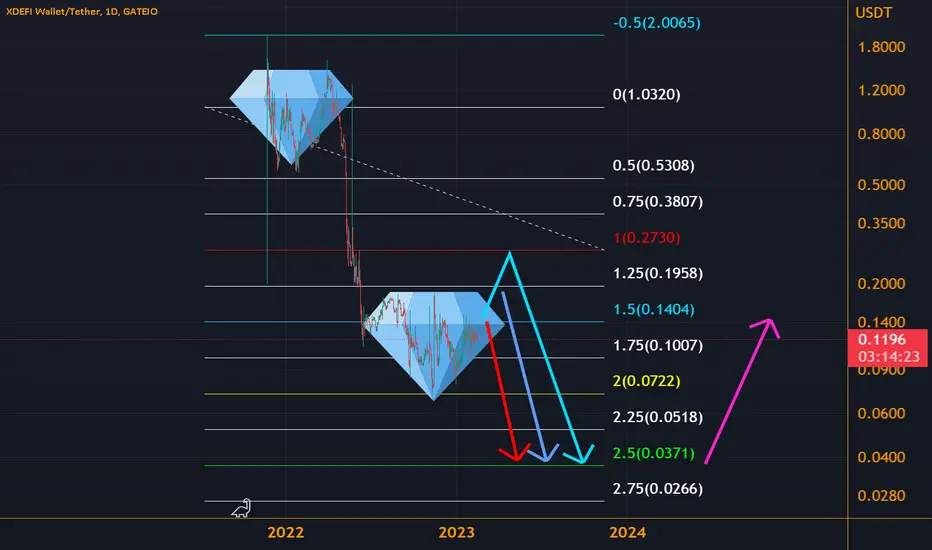
XDefi Wallet Second DiamondGATEIO:XDEFIUSDT
⏰ TimeFrame 1Day
👉 💎 Diamond reversal❓ or continuation❓
👉0,031-0,044
✔️Logarithmic (Log) Chart
Pennant
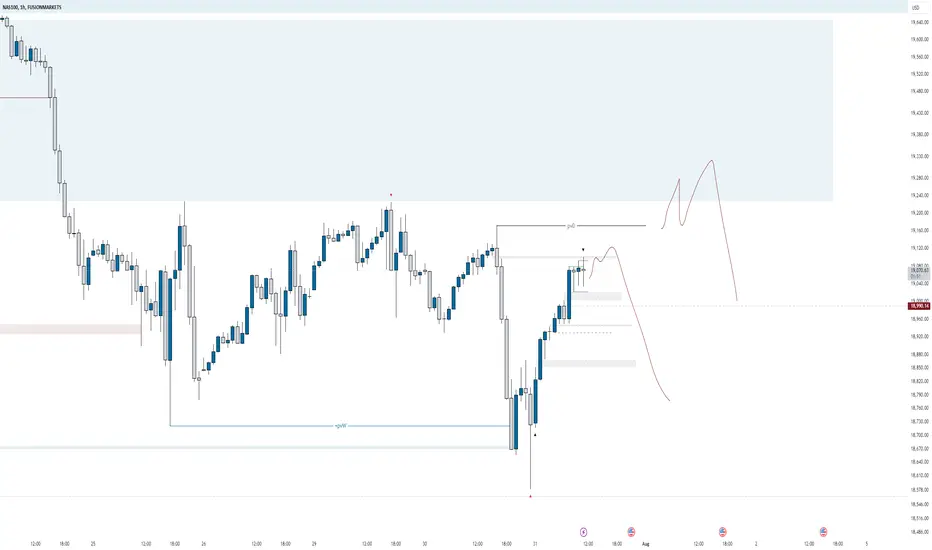
nas100 Identifying Key Levels
The chart highlights several significant levels and zones that influence the current market behavior:
• PMH & PML: Previous Month High and Low, serving as significant resistance and support levels.
• PWH & PWL: Previous Week High and Low, indicating recent market highs and lows.
• PDH & PDL: Previous Day High and Low, indicating recent market highs and lows
• Daily FVG: Daily Fair Value Gap, indicating areas of market imbalance.
• BSL: Buy-side Liquidity, areas where buy orders are placed.
• SSL: Sell-side Liquidity, areas where buy orders are placed.
• Always wait for confirmation
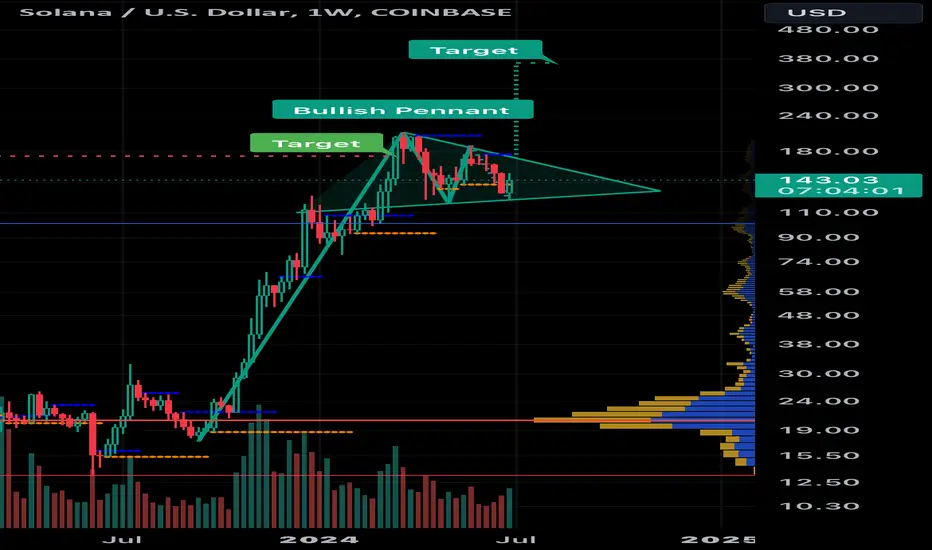
Solana weekly bull pennant. This is what I see. I am long Solana and will hold until etf is approved. Happy trading.
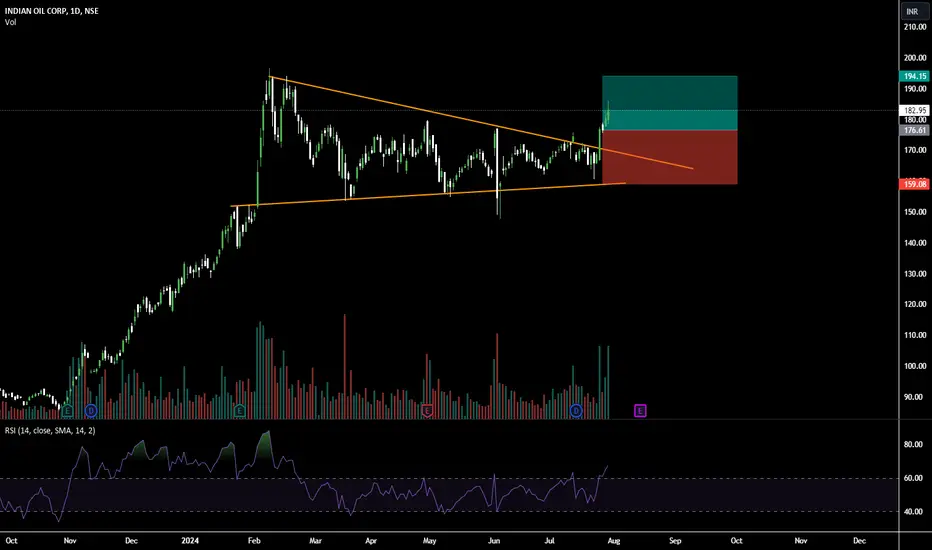
IOC, Bull PennantPotential breakout from the Pennant,
Target at 194, Stoploss at 159
Disclaimer : I am a aspiring swing trader, i have only started to learn to catch the pattern. So, please take this only as a idea
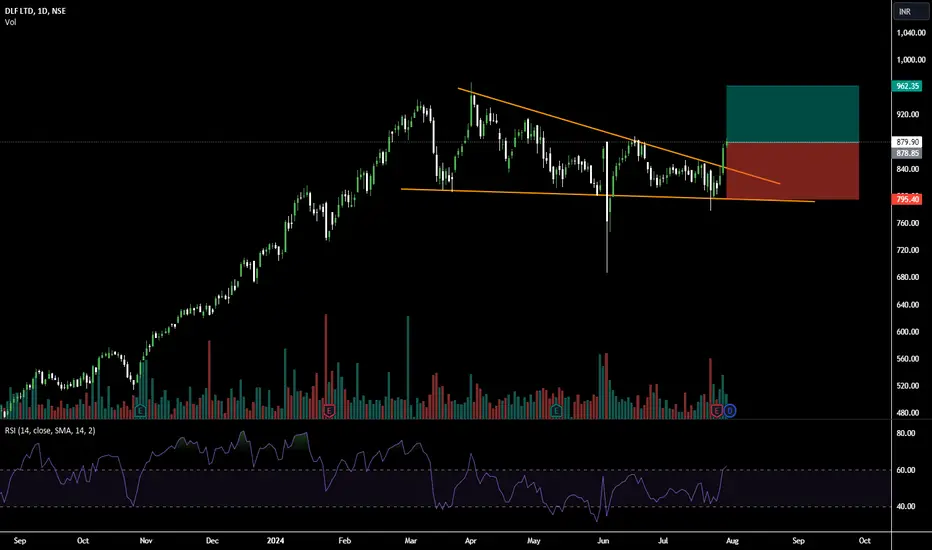
DLF, Bull PennantPotential breakout from the Pennant,
Target at 962, Stoploss at 795
Disclaimer : I am a aspiring swing trader, i have only started to learn to catch the pattern. So, please take this only as a idea
After exiting of pennant, Gold can make retest and continue riseHello traders, I want share with you my opinion about Gold. By observing the chart, we can see that the price started to grow inside the upward channel, where it rebounded from the support line at once and quickly rose to the resistance line. Then XAU made a correction to the support line, after which continued to grow inside the channel to the resistance level, which coincided with the seller zone. Soon, Gold broke the 2430 level and rose higher than the resistance line, thereby exiting from the upward channel. Next, the price entered to pennant, where it at once turned around and started to decline. In a short time, the price dropped lower 2430 level, breaking it, after which tried to grow but failed and declined more. Gold fell firstly to the 2375 support level, which coincided with the buyer zone, and soon broke it and fell until to the support line of the pennant. But then, the price started to grow from this line and in a short time rose higher than the 2375 level, breaking it and recently exited from the pennant also. At the moment, I think Gold can make a retest, after exiting from pennant and then continue to grow to the 2430 resistance level, therefore I set my TP at this level. Please share this idea with your friends and click Boost 🚀

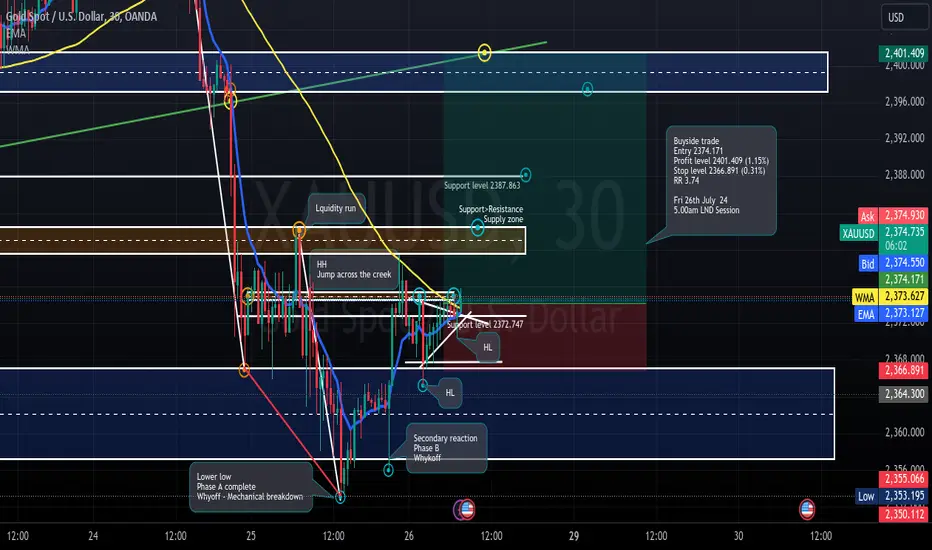
Long trade
Pair XAUUSD
Buyside trade
Entry 2374.171
Profit level 2401.409 (1.15%)
Stop level 2366.891 (0.31%)
RR 3.74
Fri 26th July 24
5.00am LND Session
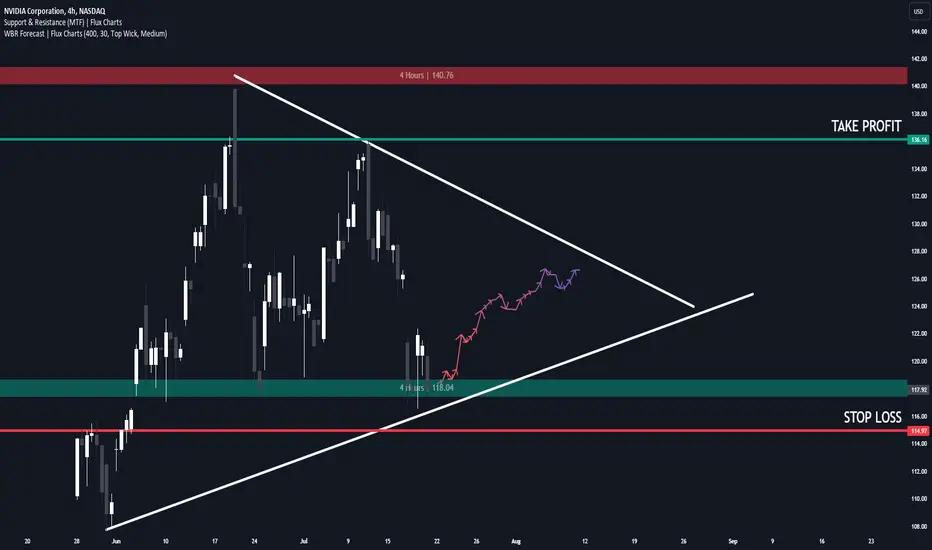
LONGING $NVDAWhy I am bullish on NASDAQ:NVDA
On the 4 hour timeframe:
- Retesting support zone
- Bottom of bullish pennant chart pattern
- Wick-to-body forecast is bullish
My personal trade:
Stop Loss / Take Profits:
- Entry: $118.00
- Take Profit: $136.16
- Stop Loss: $114.97
FETUSDT Bullish PennantFETUSDT technical analysis update
FET price has formed a pennant pattern on the 4H chart. It's a bullish continuation pattern. Once the price breaks the pennant pattern, we can expect a bullish continuation in FET.
Buy once the price breaks the pennant resistance line.
Stop Loss: 1.40

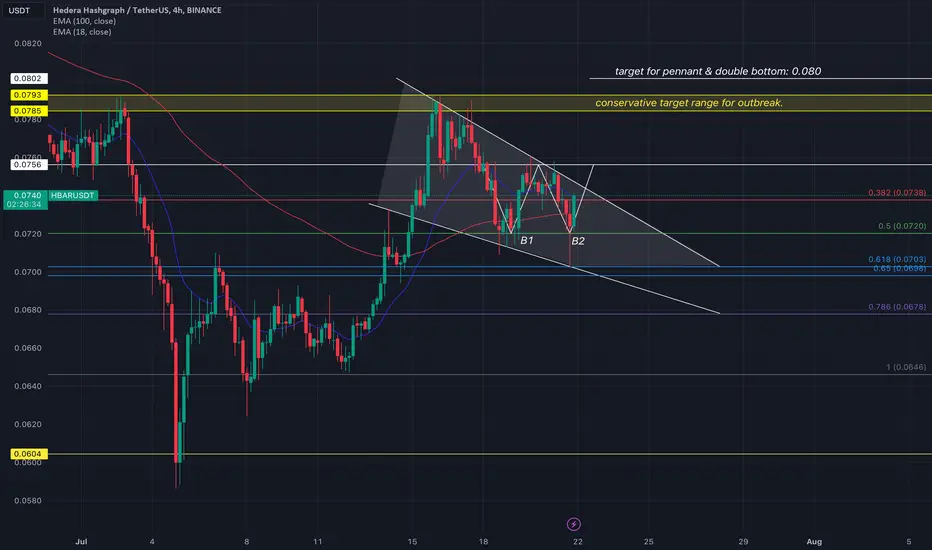
|| HBARUSD || BREAKOUT PATTERN INCOMING!Current market sentiment has been fairly bullish resulting in a great week for the top 10 crypto assets, however, we are still to see a snowball effect onto assets outside of the T10.
Today I shall be discussing my perspective on the current Hbar market structure and why I feel it will be caught by the snowball to come.
At the time of writing this report, Hedera is sitting at 0.0737, which is also a strong level of resistance depicted by the fib retracement I have placed (38.2%)
Patterns: Let me start off with the defending bullish pennant we are currently in. This pattern although a good confluence alone, has been suppressed by the fib retracement 50% ($0.0720) which has in turn created a double bottom suppression breakout formation.
Both the pennant and double bottom patterns have targets set at 0.080, however, there is a level of resistance as my conservative target at 0.0785-93.
I expect price to break to the baseline of my DB formation at 0.0756 before completing the pennant formation by converting the pattern resistance into support before continuing. this action will add confluence to my projections.
Slightly bearish yet healthy alternative would be if price was to fall below 0.0720 (50% fib) to the golden ratio set at 0.0703-698. This movement would of course void the existing double bottom, however, would add additional confluence in the bullish pennant narrative.
Price range to watch over in the following days are between 0.0756 (resistance + baseline of DB) and 0.0720. A break from either levels will result in a fairly impulsive move to our conservative target (0.0785-93) or to our golden ratio (0.0703-698)
Thank you for your interest in my report. I truly hope you were able to receive some informative insights on the current Hbar market that is able to aid your pre-existing perspective on the Hbar price structure.
THIS IS NOT FINANCIAL ADVICE!
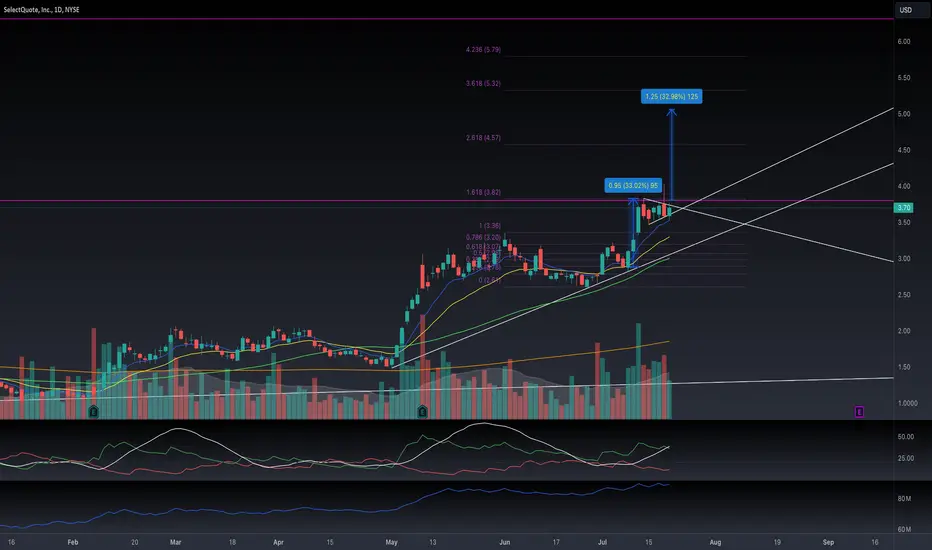
SLQT Bullish Pennant SLQT appears to be forming a bullish pennant near resistance which also coincides with the 1.618 fibonacci level.
The pennant is forming with increasing volume with the ADX signalling a strong trend with a value of 38. OBV confirms the uptrend.
Targeting the length of the "flag pole" from the breakout point for target 1 with target 2 at the gap fill level.
Target 1: $5.06
Target 2: $6.31
Stop: $3.46
Lightbridge Corporation - 50% return incoming?Lightbridge Corporation has repeatedly posted explosive gains when breaking above defined resistance levels. The nuclear fuel technology provider is up 60% over the past two weeks, but analysis suggests there are still more gains to come.

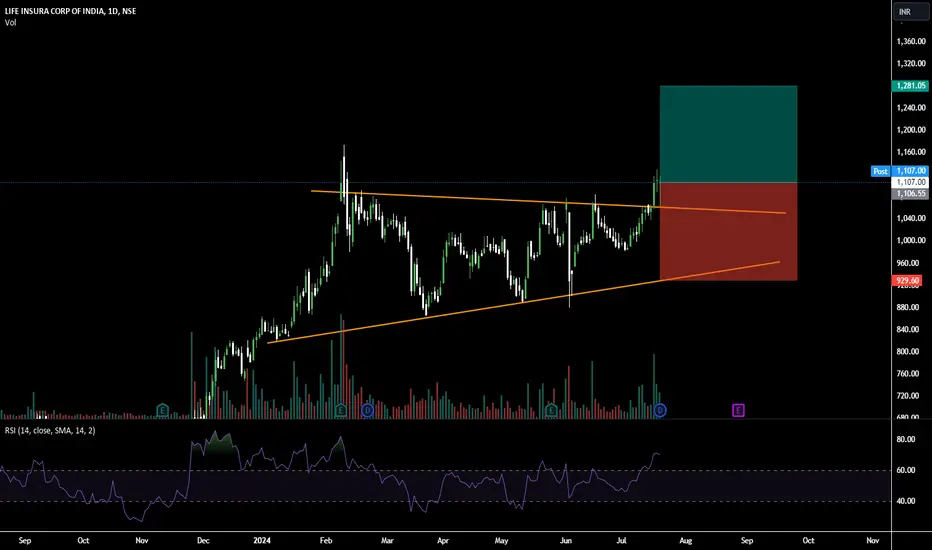
LIC, Bull PennantPotential breakout from the Pennant,
Target at 1281, Stoploss at 929
Disclaimer : I am a aspiring swing trader, i have only started to learn to catch the pattern. So, please take this only as a idea
SOL ANALYSIS🚀#SOL Analysis :
🔮#SOL is making bullish pennant pattern on the weekly timeframe💁♂️
The breakout of the bullish pennant pattern suggests a potential bullish move📈
Expect a bullish wave of around 30% in the coming weeks
🔰Current Price: $156.50
🎯 Target Price: $203.45
⚡️What to do ?
👀Keep an eye on #SOL price action. We can trade according to the chart and make some profits⚡️⚡️
#SOL #Cryptocurrency #TechnicalAnalysis #DYOR

NZD USD possible buyWe can see a bullish break of structure beginning to form. If the structure stands, we expect bulls

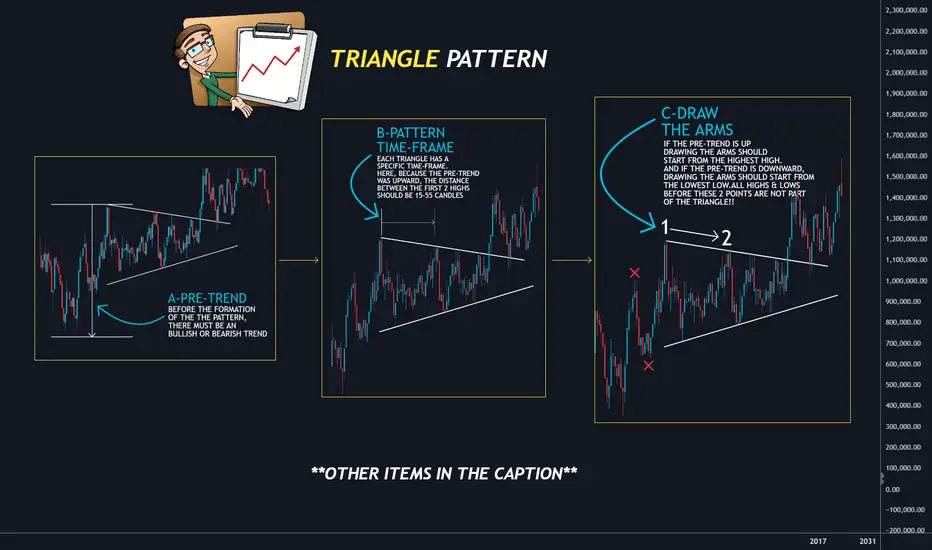
MASTERING SYMMETRICAL TRIANGLES: A GUIDE FOR TRADERS👀See the first 3 items on the chart👆
🔰Other details:
⭐D:
⭐E:
⭐F:
⭐G:
🔰Additional Considerations for Triangles:
⭐H: Number of Points: To construct a triangle, we need at least two HIGHS and two LOWS. Occasionally, triangles are formed using six points instead of the usual four.
⭐I: Validity Criterion: The BREAKOUT point (exit point) of a triangle should not be too close to the intersection of its upper and lower sides; otherwise, the triangle loses its validity.
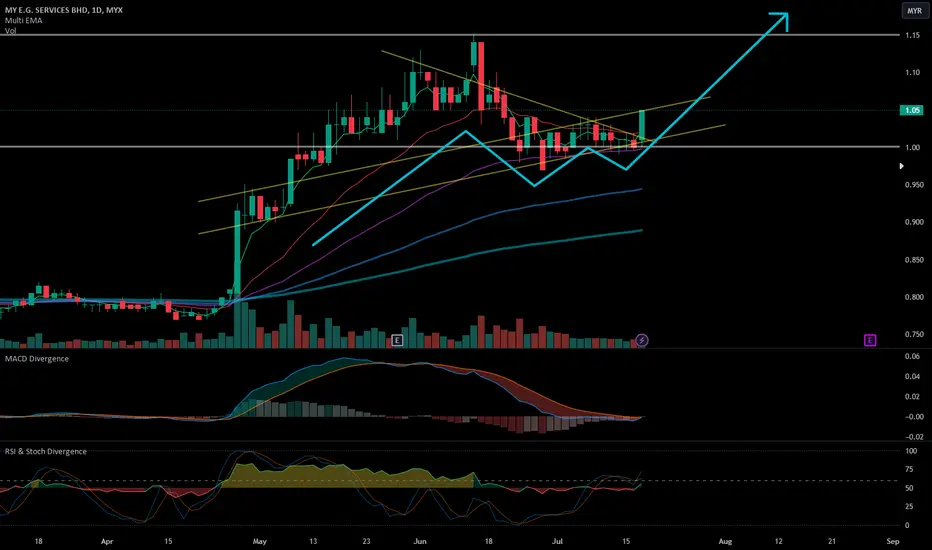
MYEG - Pennant Pattern, Rebound at RM1.00 Major SupportIn process of breaking out from Pennant Pattern.
Upward trend continuouation with price constantly trading above EMA 50/100/200.
MACD, RSI, and Stochastic indicator are showing sign of trend reversal.
Major support at RM1.00 and major resistance at RM1.15
$SOL - Super BullishSOL looks like forming a Bullish Pennat formation and this is a Bullish Pattern.
I have possibiity for this formation and will be bullish if breakout from this formation.
The closest target for this formation is $322.
I feel very bullish for CRYPTOCAP:SOL , especially if the CRYPTOCAP:SOL ETF is approved and goes live... Just imagine that 🚨🚨
You can do Spot or Futures, just manage your own risk !!
Please DYOR before take a position and make a decision.

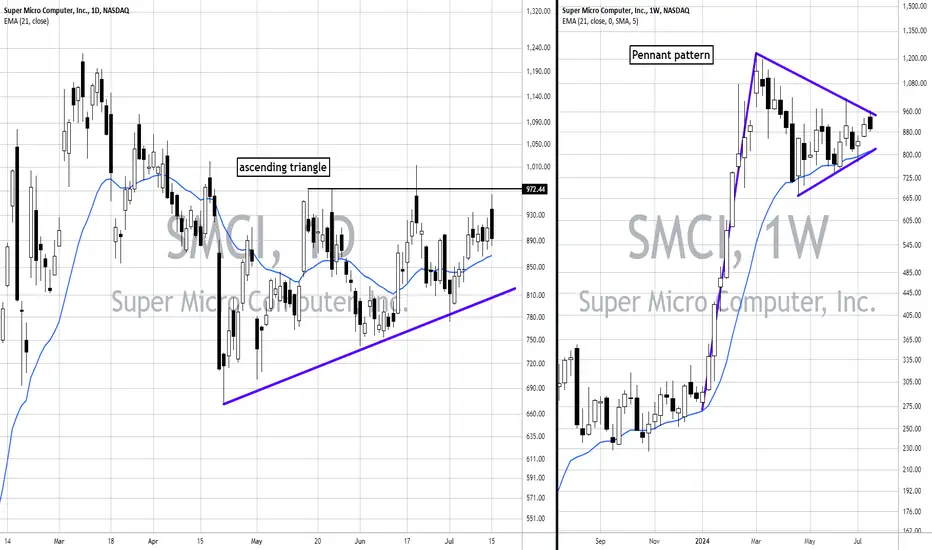
SMCI: The trigger for the next rally! (D&W charts)The SMCI chart presents a compelling case for bullish potential, highlighted by significant bullish patterns on both the daily and weekly timeframes. On the daily chart, SMCI is forming an ascending triangle, a bullish continuation pattern. This pattern is characterized by rising lows supported by an ascending trendline, while the price faces resistance at $972.44, which is its most important resistance level. The consistent formation of higher lows suggests increasing buying pressure. Recently, the price has closed near this resistance level, indicating a potential breakout. If the price successfully breaks and closes above $972.44, it would signal a strong bullish continuation. However, a fall below the ascending trendline could indicate a possible reversal or a phase of consolidation.
On the weekly chart, SMCI exhibits a pennant pattern, another bullish continuation signal that forms after a significant price move. This pattern is marked by a period of consolidation with decreasing volatility, bounded by converging trendlines. The price action is currently testing the upper boundary of this pennant, suggesting a potential breakout. A break above this pattern would confirm the continuation of the bullish trend, likely leading to a substantial price increase. Conversely, failure to break above the upper trendline and a drop below the lower boundary could indicate a more pronounced pullback or extended consolidation phase.
Overall, SMCI shows strong bullish tendencies supported by the ascending triangle on the daily chart and the pennant pattern on the weekly chart. Both patterns suggest further upward movement if key resistance levels are broken. Traders should monitor these levels closely for a confirmed breakout to validate the bullish outlook. Failure to break these resistance points might lead to short-term consolidation or pullbacks to support levels.
For more detailed technical analyses and insights like this, be sure to follow my account. Your support helps me continue providing valuable content to help you make informed trading decisions.
Remember, real trading is reactive, not predictive, so let's stay focused on the key points described above and only trade when there is confirmation.
“To anticipate the market is to gamble. To be patient and react only when the market gives the signal is to speculate.” — Jesse Lauriston Livermore
All the best,
Nathan.
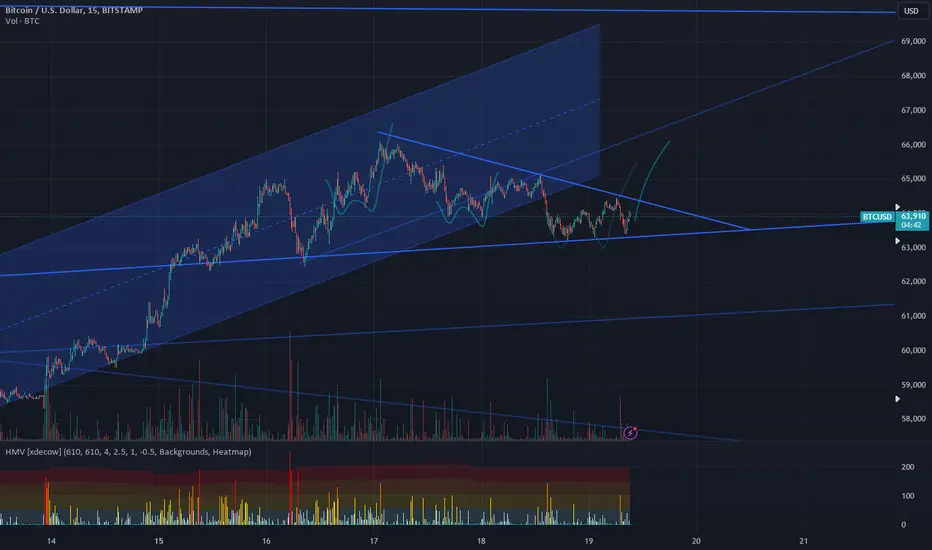
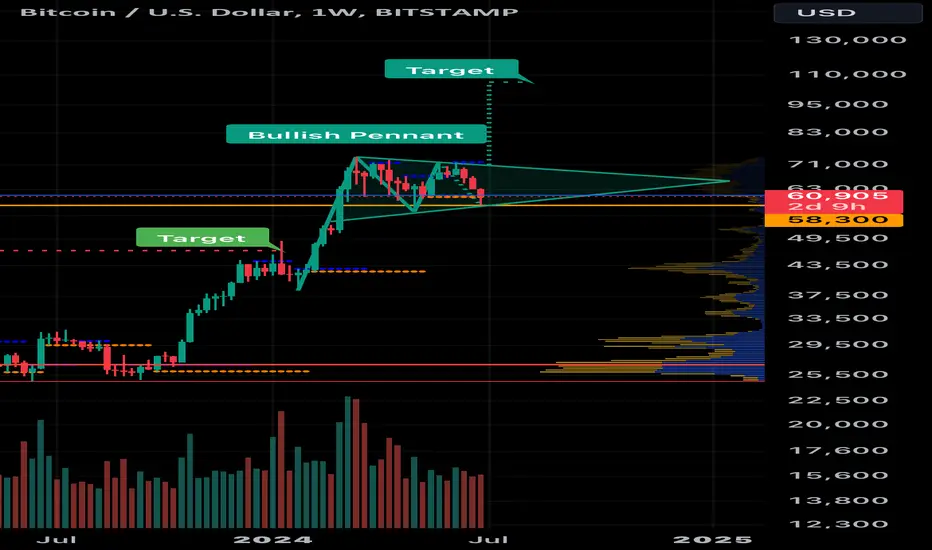
Contrarian or Bear?Bullish Pennant: A pennant on the BTC/USD weekly chart suggests a potential continuation of the uptrend after a consolidation period. This could be bullish.
Bearish Market Sentiment: However, the overall crypto market sentiment is bearish, which can create conflicting signals.
Buying Opportunity?: Traditionally, a pennant breakout during a bearish market can be a good buying opportunity for contrarian investors who believe the sentiment is overly pessimistic.
Target and Risks:
Target: The pennant's target could potentially reach $100,000.
Risk: If the pennant pattern fails, Bitcoin could revisit the low $50,000 area, which is a significant downside risk.
Here are some additional points to consider:
Technical Analysis Limitations: Technical analysis is not a perfect science, and past performance doesn't guarantee future results.
Market Volatility: The cryptocurrency market is highly volatile, and prices can fluctuate rapidly.
Fundamental Analysis: Consider fundamental factors that might influence Bitcoin's price, such as upcoming regulations, adoption rates, and technological advancements.
Overall:
The situation presents a potential opportunity with some calculated risk. Here's what you can do:
Do Your Research: Analyze the pennant pattern, market sentiment, and relevant news affecting Bitcoin.
Consider Risk Tolerance: Only invest what you can afford to lose, given the potential downside.
Diversification: Don't put all your eggs in one basket. Consider diversifying your crypto portfolio.
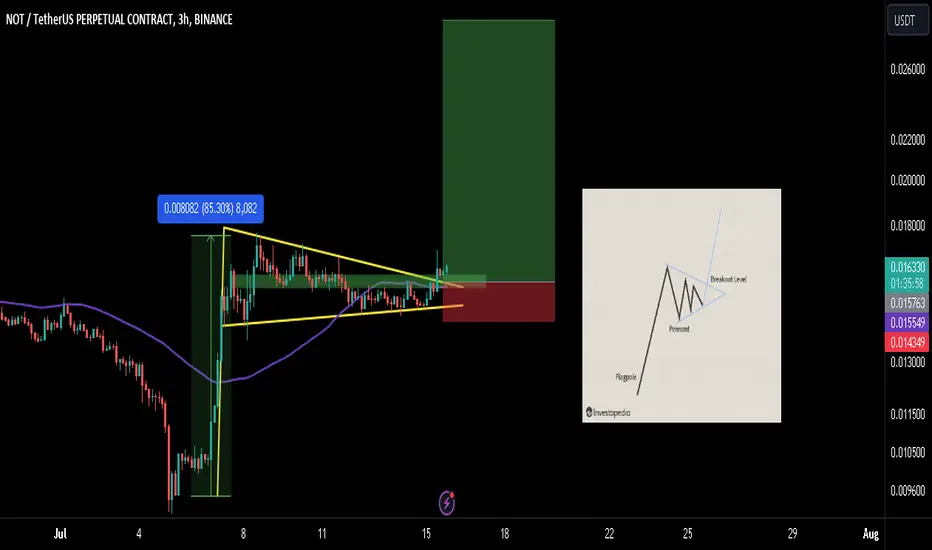
NOT/USDT: POTENTIAL BULL PENNANT!!Hey everyone!
If you're enjoying this analysis, a thumbs up and follow would be greatly appreciated!
NOT/USDT looks good here. Forming a bull pennant-like stricture here. It breaks out and a retest is also done. Buy some here and add more in the dip.
Entry range:- $0.0155-$0.0165
Target:- 80-90%
SL:- $0.014
Lev:- 2x-4x
Gold can rebound from resistance line of wedge and start declineHello traders, I want share with you my opinion about Gold. Observing the chart, we can see that the price not long time ago price traded between the support level, which coincided with the buyer zone, and then made a strong impulse up to the resistance level. When the price reached the 2415 level, it broke it and rose a little higher than the seller zone, but soon turned around and quickly declined lower that the 2415 level, breaking it, inside the pennant pattern. Price some time traded in the pennant and then rose until to the resistance line of the pennant and then bounced down to the support line. After this movement, the price in a short time rose from the support line to the resistance line and exited from the pennant pattern. Next, Gold entered to wedge pattern, where it at once made a correction from the resistance line to the support line, after which turned around and started to grow. In a short time later price reached the resistance level, and tried to break it, but failed and now trades below. In my opinion, Gold can enter to seller zone, where it reaches the resistance line of the wedge and then rebound down to the support line of this pattern. As well, the price can break this line and continue to decline, exiting from the wedge. For this case, I set my TP at 2360 points. Please share this idea with your friends and click Boost 🚀
