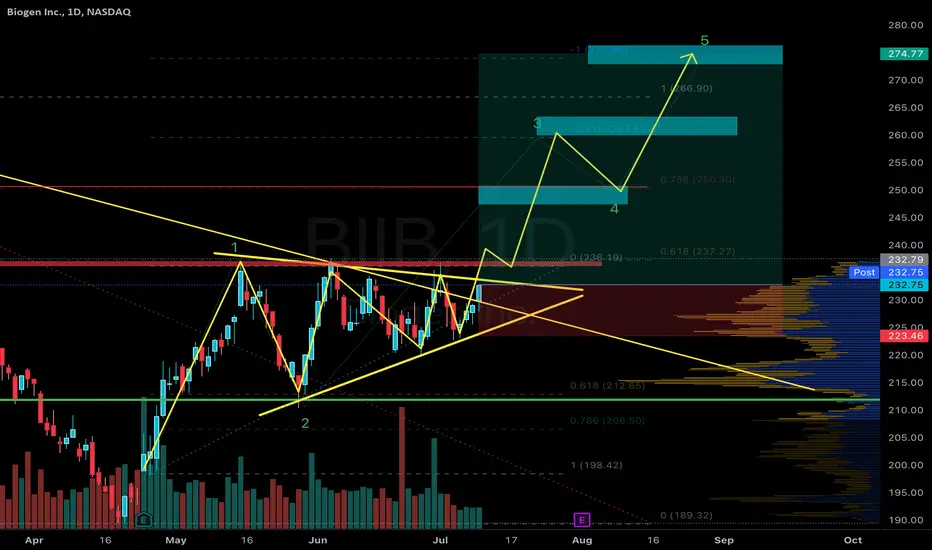
BIIB - Breakout soonBIIB is forming a tight pennant setup. Either this gonna breakout here and rally or Fakeout and crash. Let’s see..!
Long anywhere here.
Target #1 - 250
Target #2 - 260
Target #3 - 275
Stop loss - 225
Pennant
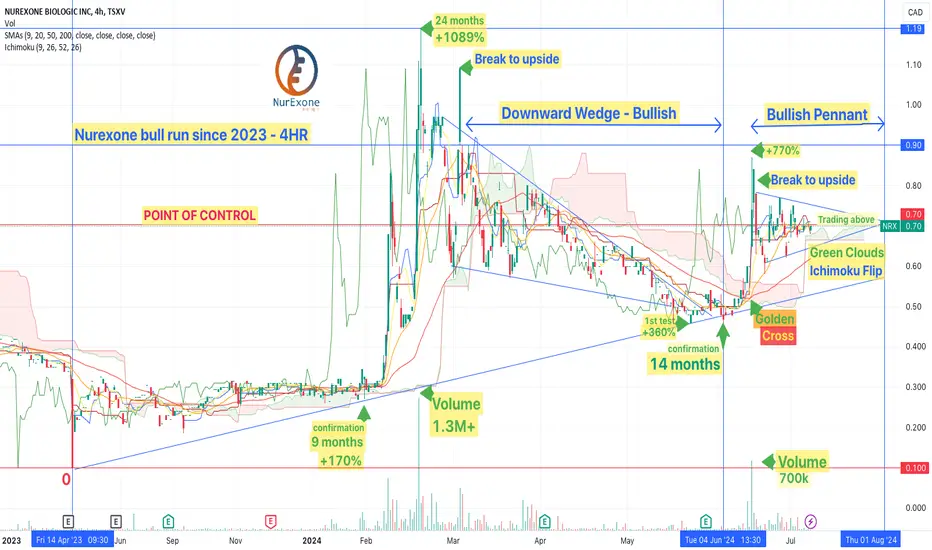
NRX - Nurexone trend analysis since bull run commencing in 2023Having a look at Nurexone trends alongside Point of Control & Ichimoku Cloud indicators. Current bullish pennant formation detected following a successful Downward Wedge.
*Next move: Trace Fibonacci retracement, indicate loss % between ATH and support levels, future projections
Triangle will resolve soonNot long to go. See which way it resolves and make a decision.
Not financial advice

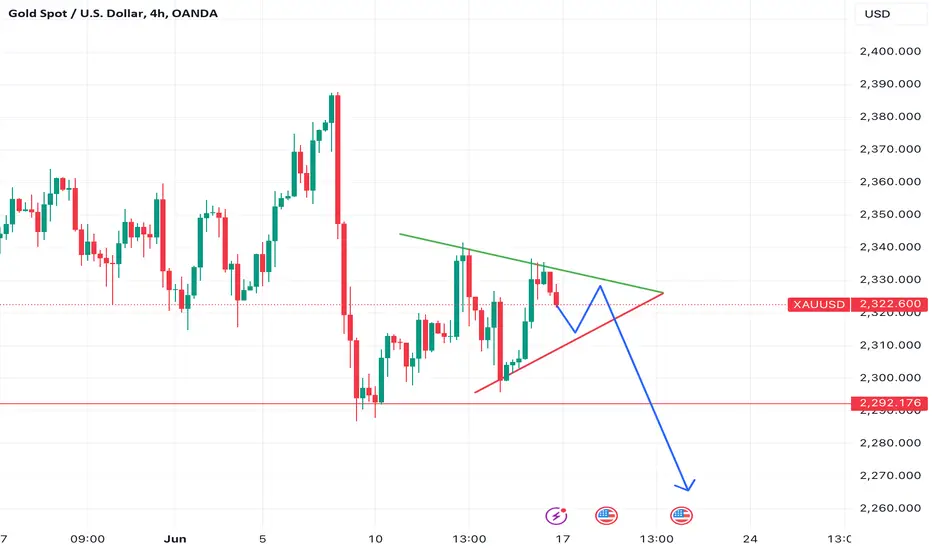
Gold can break support level and fall to support line of channelHello traders, I want share with you my opinion about Gold. By observing the chart, we can see that the price made impulse down from the resistance line of the pennant lower than the current support level, which coincided with the support area, thereby breaking it. After this, the price some time traded and then rose back to the support area, where it reached the resistance line of the pennant and then rebounded down to the support line, breaking the 2310 level, but soon Gold rose higher this level, breaking it one more time. Then it in a short time rose to the resistance line of the pennant, turned around, and fell to the support line, after which the price exited from the pennant pattern and declined to lower the 2310 level again. But then Gold started to grow inside the upward channel, making a fake breakout of the support level, which coincided with the buyer zone and later it rose to the current support level. A not long time ago, XAU broke this level and now it trades very close to the 2390 level, near the resistance line of the channel. For this case, I think that the price can make a small correction movement, and then reach the resistance line, after which starts to decline to the support line of the channel, breaking the support level. So, that's why I set my TP at 2360 points, which coincided with the support line of the channel. Please share this idea with your friends and click Boost 🚀

Pennant formation on PATELENGPATELENG formed a Pennant chart pattern on daily chart. Multiple support and resistance were tested before the breakout. On the breakout day there was above average volume pushing the price higher. Looking at the current price level seems ideal time to enter with stop loss just below the breakout candle and target the width of the Pennant. This trade offers ideal risk reward of 1:2 or probably higher depending on how the trade moves. Would be good if you have a trailing stop loss based on where price takes support next.
Hope you like this idea. If you like, please boost this idea or leave a comment below on what you think. Otherwise, happy trading :-).

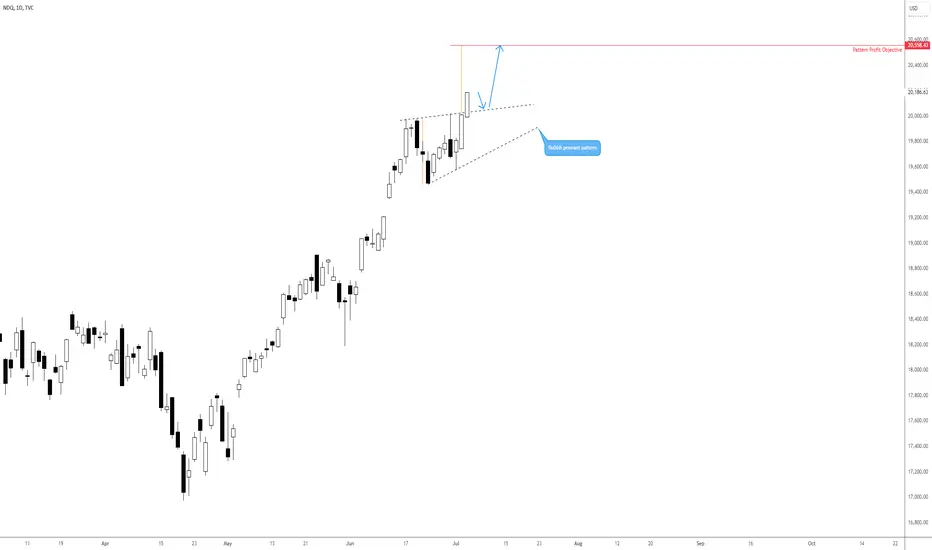
Nasdaq 100 at All-Time Highs
Following the completion of a bullish pennant pattern, taken from 19,977 and 19,472, the Nasdaq 100 ended Wednesday’s session refreshing record highs of 20,186. Bullish pennant patterns CAN form in the direction of the underlying trend in strong upward markets (this is not a rising wedge as these are typically longer-term structures).
While a retest of the recently breached upper boundary could be seen (arrows), the current pattern formation and the underlying strength of the trend in this market suggest further buying could take place towards the bullish pennant pattern’s profit objective at 20,558.
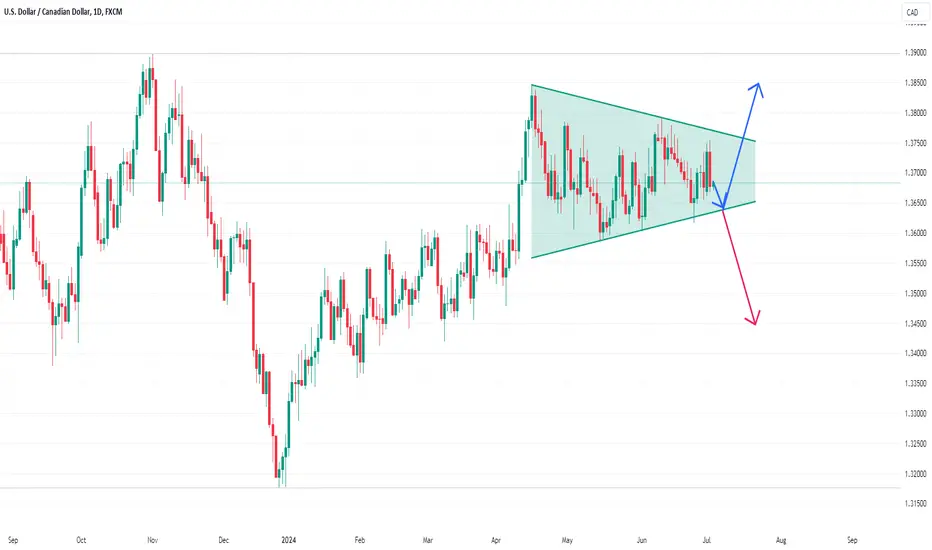
USDCAD is moving in a pennant patternOn the daily chart, USDCAD is currently running in a pennant pattern. Currently, we can pay attention to the support near 1.3650 below. If it falls back and stabilizes, we can consider going long. The upper resistance is around 1.376. If it breaks through, it will continue to rise, and the upward target is around 1.385. If the price breaks down, it will go to the support near 1.345.
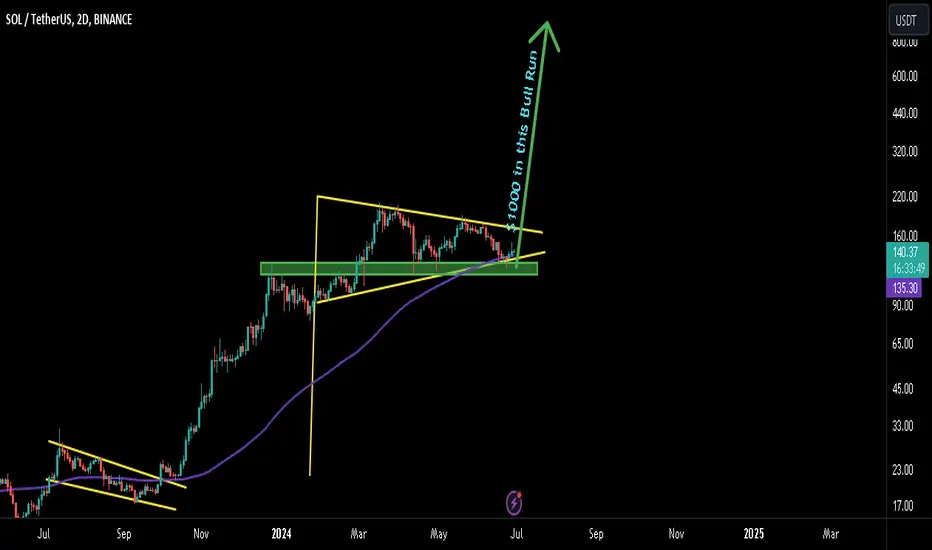
CAN SOLANA HIT $1000 IN THIS BULL RUN!!Hey everyone! If you're enjoying this analysis, a thumbs up and follow would be much appreciated!
Why SOLANA can hit $1000 in this bull run?
Many analysts are optimistic about SOL's potential in the current market cycle. Here's a look at some factors to consider:
Technical Analysis (T.A.)
Bull Pennant (Possible): The 2-day timeframe suggests a potential bull pennant pattern. A clean breakout above the upper trendline could signal a significant price increase. However, confirmation is needed.
Fundamental Analysis (F.A.)
ETF Race: The recent filing for SOL ETFs could attract institutional investment, potentially boosting demand.
Buy some SOL now and add more in the dip.
The strong buy zone is in the $115-$125 range.
What are your thoughts on SOL's current price action? Do you see a bullish pattern? Share your analysis in the comments below!
Thanks!
BTC Bullish Pennant (Aug or Nov breakout)
This is the BTC 1 Day chart I drew the zig zag lines using the same time frame it took to make the initial bars.
What is interesting about this formation is it lines up with the 200 days or so of sideways chop we always experience after a halving - along with a Nov breakout (which would fall in line of the USA election dates).
Bullish Pennant on 1D chart est price opinion for. 20th Aug $70,1K / 06th Oct 62.5K / 12th Nov end of Pennant breakout.... (Possibly Aug - if we are lucky)
Target: $106K

Eur/usdTrade Idea:
📍 Entry: 🎯 Target: ⛔ Stop Loss: (MARKED IN CHART)
💡 RISK REWARD 1 : 3
💰 Risk 1% of your trading capital.
⚠️ Markets can be unpredictable; research before trading.Disclaimer: This trade idea is based on Elliott Wave analysis and is for informational purposes only. Trading involves risks; seek professional advice before making any financial decisions.Informational onLY !!!!
Gold can correct to support level and then start to move upHello traders, I want share with you my opinion about Gold. By observing the chart, we can see that the price declined to the support line, thereby breaking the support level, which coincided with the buyer zone, but at once rebounded and started to grow. In a short time price rose higher than the 2310 level, breaking it again, and then rose to the resistance level, which coincided with the seller zone. Soon, GOLD broke this level, made a retest, and rose to 2442 points, after which turned around and started to decline. Price quickly declined lower than the resistance level with the support line, thereby breaking it. After this movement, the price some time traded in range and then reached the resistance level again, but at once rebounded and made impulse down lower than the 2310 level, to support line of the pennant. Next, Gold in a short time rose to the resistance line of the pennant, after which rebounded back to the support line. But a not long time ago it bounced up and now trades near the support level. In my opinion, the price can decline to the support level and then start to grow to the resistance line of the pennant. After this, Gold can break this line, thereby exiting from the pennant, and then continue to grow, therefore I set my TP at 2360 points. Please share this idea with your friends and click Boost 🚀

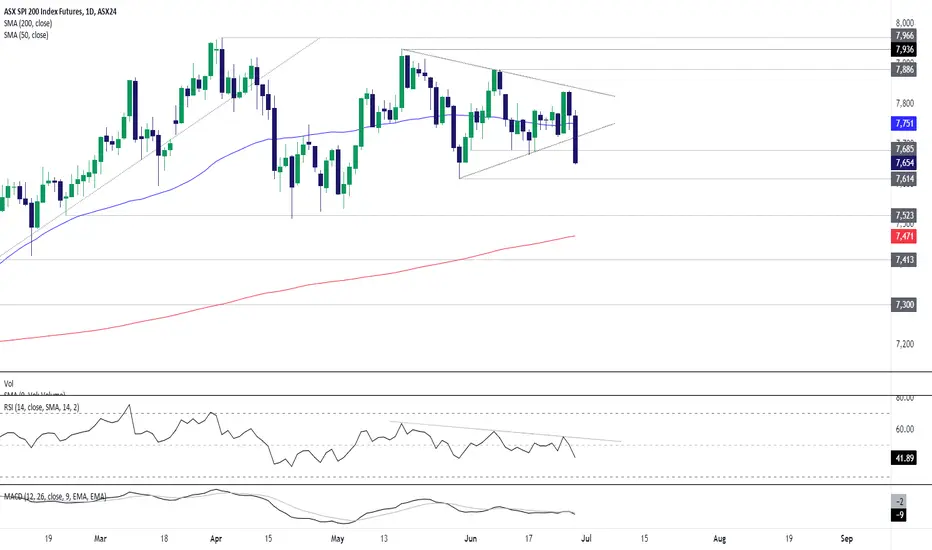
Bearish breaks in ASX 200 SPI futures often don’t stickDips below 7685 in Australian ASX 200 SPI futures have made for good buying in June. Will the latest be any different?
Yes, the price action looks terrible having broken out of the pennant in the overnight session, so I’m not rushing the buy the dip. But if we see the move stall during the session, there are grounds for a cheeky long with a stop below the session lows for protection. I expect Chinese stock indices may be influential today given the quiet data calendar.
7685 would be the initial target with the 50-day moving average the next after that. If the trade were to move in your favour, consider lifting your stop to entry level to provide a free shot on upside.
Selling the break right now comes across as a low probability setup. But if SPI were to sink back to 7615, that will provide far better setups depending on how the price interacts with the level.
DS
TRX ANALYSIS🚀#TRX Analysis :
🔮#TRX has broken out of a symmetrical triangle pattern on the 3D timeframe💁♂️
The breakout of the bullish pennant pattern suggests a potential bullish move📈
Expect a bullish wave of around 15% in the coming weeks
🔰Current Price: $0.12300
🎯 Target Price: $0.14100
⚡️What to do ?
👀Keep an eye on #TRX price action. We can trade according to the chart and make some profits⚡️⚡️
#TRX #Cryptocurrency #TechnicalAnalysis #DYOR

Breakout on GBPUSD for a quick 40pip tradePrice broke out of a pennant continuation pattern giving a good opportunity for a long trade. The breakout occurred on a strong 1H and 4H candle which is good confirmation

Bitcoin can turn around from support area and start to growHello traders, I want share with you my opinion about Bitcoin. By observing the chart, we can see that the price started to trades inside the upward pennant, where it broke the 60700 level and then reached the resistance line of this pattern. After this movement, BTC turned around and started to decline to the support level, which coincided with the support line of the pennant, and then the price made an upward impulse, thereby exiting from this pattern and soon broke the 66700 level too. Next, the price made a retest and started to trades inside the range, where it at once rose to part of the consolidation and then made a correction movement to the current support level, which coincided with the support area. Price some time traded near this level a little more and later rebounded up to the seller zone, where it at once turned around and in a short time fell back to the current support level. At the moment, it continues to trades near the 66700 level, which coincides with the support area and bottom part of the range. For this case, I think that BTC can fall to the support area and then turn around and start to grow to the seller zone. So, that's why I set my target at the 71000 points. Please share this idea with your friends and click Boost 🚀

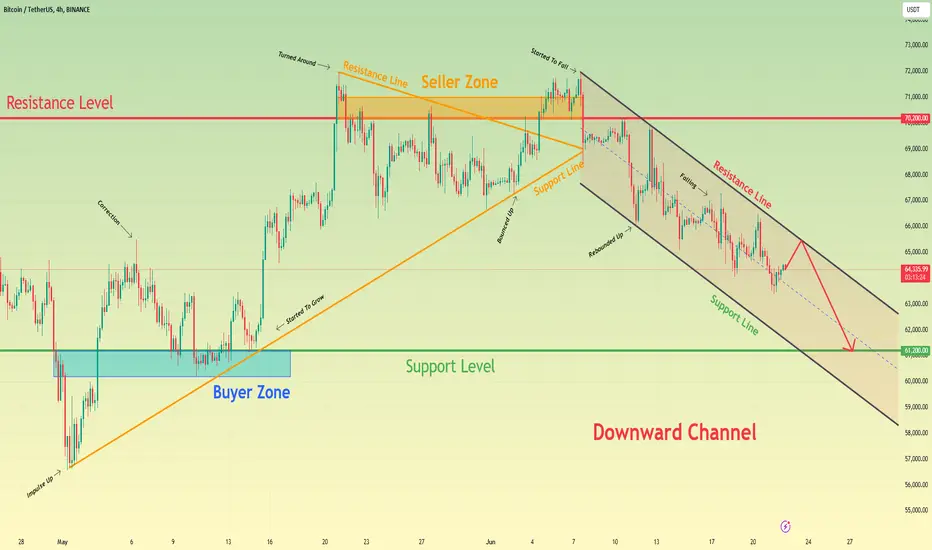
Bitcoin can rise a little and then continue fall inside channelHello traders, I want share with you my opinion about Bitcoin. By observing the chart, we can see that the price some days ago declined lower than the support level, which coincided with the buyer zone, after which it entered to the pennant, where at once made impulse up, breaking 61200 again. Then the price made correction to the support level and then started to grow to the resistance line of the pennant pattern, after which turned around and fell to the support line. Next, the price bounced up, exiting from this pattern, and also rose higher than the 70200 resistance level, which coincided with the seller zone, but soon turned around and started to decline inside the downward channel. In the channel, BTC broke the resistance level one more time and fell to the support line of the channel, after which rebounded up, and tried to grow, but soon price continued to decline. Now, BITCOIN continues to decline inside the downward channel, so, in my opinion, the price can grow to the resistance line of the downward channel and then it will continue to decline to the support level. For this case, I set my TP at the 61200 support level. Please share this idea with your friends and click Boost 🚀
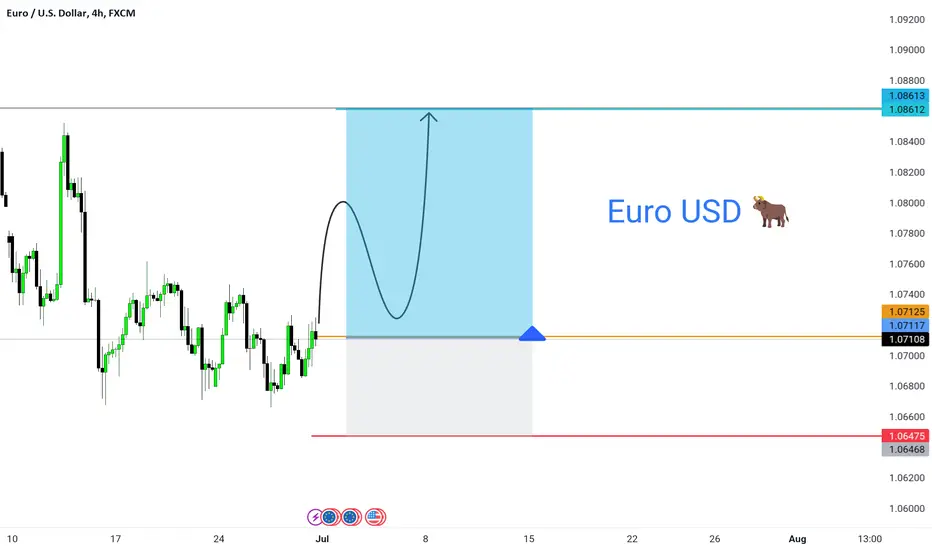
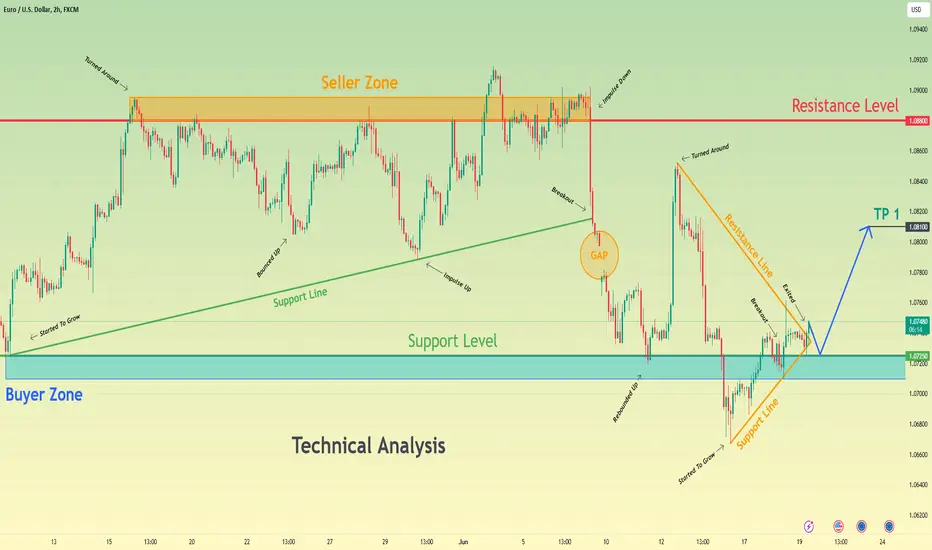
Euro can make correction to support level and then start to growHello traders, I want share with you my opinion about Euro. By observing the chart, we can see that the price some time ago started to grow from the support line and soon reached the seller zone, which coincided with the resistance level, after which made small movement down. Next, the price reached the resistance level again and then fell to the support line, after which EUR made an impulse from this line higher than the 1.0880 level, breaking it and some time trading between this level. After this, the EUR made an impulse down to the support level, which coincided with the buyer zone, breaking the support line and also forming a gap. Then the price rebounded from the 1.0725 level and rose to 1.0850 points, after which started to decline inside a downward pennant, where it fell lower than the 1.0725 support level, breaking it. But a not long time ago, the price started to grow from the support line of this pattern and quickly backed up and even exited from the pennant. At the moment, I think that the price can make a correction movement to the support level and then start to grow. For this case, I set my TP at 1.0810 points. Please share this idea with your friends and click Boost 🚀
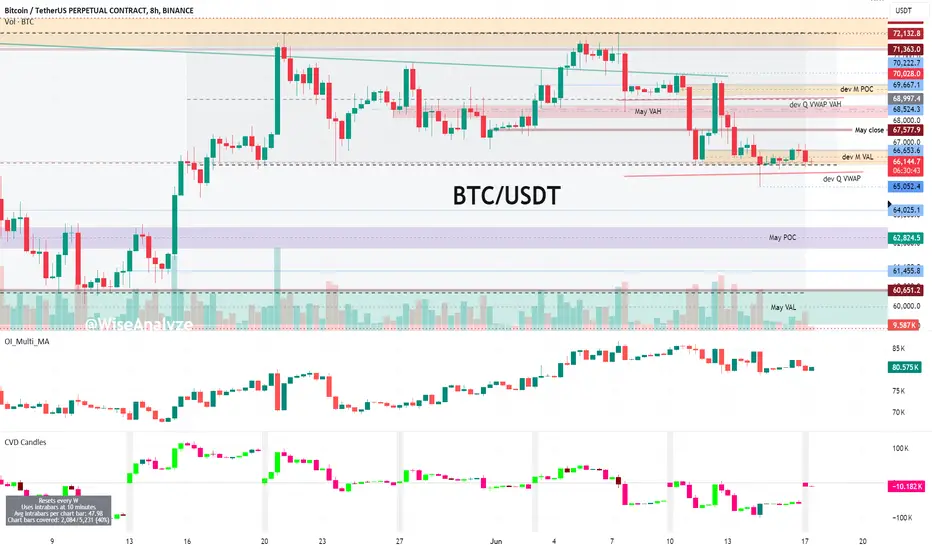
BTC at HTF range middle 📉 Bitcoin Daily 📈
Bitcoin closed week at 66653. That was above higher timeframe range middle and above developing quarter VWAP. Can't say this price action looks bullish, but at least it hasn't yet completely wiped out all the bulls. In short term perspectives there is still a chance for a bounce to May close this week.
Higher timeframe picture and conditions remain the same. Acceptance below 66k will lead to BTC drop down to 63-64k and possible dips down to 59k (HTF range bottom). Last week close gives me bearish vibes - even if this week close above range middle chances to see those dips are close to "guaranteed".
Nearest liquidity pools:
above - 67260 / 67720 / 69195 / 70290
below - 65675 / 64885 / 64220 / 63080
Lines on the chart:
🔸72132 - May high
🔸71363 - March close
🔸69667 - week close
🔸68540 - week close (May)
🔸67577 - May close
🔸66653 - week close
🔸64025 - last April week close
Trend: D ▶️ W 🔼 M 🔼
🤑 F&G: 71 < 71 < 74 < 74 < 70
XAUUSD SHORTGreat opportunity to short gold. Waiting for the break of bottom red trendline for a nice entry.
Looking at this chart on 4HR/DAILY candles. I think gold still has more room to the downside.
Any opinions? :)
Bearish Pennant Pattern and Support Breakout in MDTUSDT CoinAnalysis:
Chart Pattern: MDT/USDT is showing a Bearish Pennant pattern below the support level, indicating potential for further downward movement.
Support Breakout: The coin has broken below a key support level, suggesting increased selling pressure.
Target Price: Estimate target prices based on the height of the pennant.
Cautionary Note:
Be careful, as trading cryptocurrencies involves significant risks. Ensure to assess your financial situation and investment goals before making any decisions.
Stop-Loss: Set a stop-loss slightly above the pennant's upper boundary to manage risk.

Gold can correct to support level and then rebound up to 2345Hello traders, I want share with you my opinion about Gold. Observing the chart, we can see that the price some days ago price started to trades inside an upward pennant, where it at once made a strong impulse up from the support line to the resistance line, which coincided with the seller zone, breaking 2285 and 2415 levels. Soon, the price turned around and in a short time declined to the support level, which coincided with the support area, after which started to grow to a resistance line. When the price reached this line, it two times tried to break it, and on the second try, Gold broke the resistance line, thereby exiting from the pennant and continuing to move up to the seller zone. After the price entered to seller zone, it soon turned around and in a short time declined lower the 2415 resistance level, making a fake breakout of it. After this, the price rose to the resistance line, after which rebounded down to the support level, but a not long time ago it bounced and started to grow. In my opinion, the price can correct to the support level, after which Gold turns around and rebounds up to the resistance line. For this case, I set my target at 2345 points, which coincided with this line. Please share this idea with your friends and click Boost 🚀

DXY Update...
AronnoFX will not accept any liability for loss or damage as a result of
reliance on the information contained within this channel including
data, quotes, charts and buy/sell signals.
If you like this idea, do not forget to support with a like and follow.
Traders, if you like this idea or have your own opinion, please feel free command me.

Pennant on WOCKPHARMAWOCKPHARMA formed a Pennant formation on daily chart. Multiple support and resistance were tested and price broke out of resistance. Price also successfully tested it and bounced back. Volume was above average on the day of breakout. Looking at the way of bullish formation on this stock, I believe it has got good potential. Stop loss can be held just below the swing with target the width of the pendent. Entry can be just above the breakout candle.
Hope you like this idea. If you like, please boost this idea or leave a comment below on what you think. Otherwise, happy trading :-).
