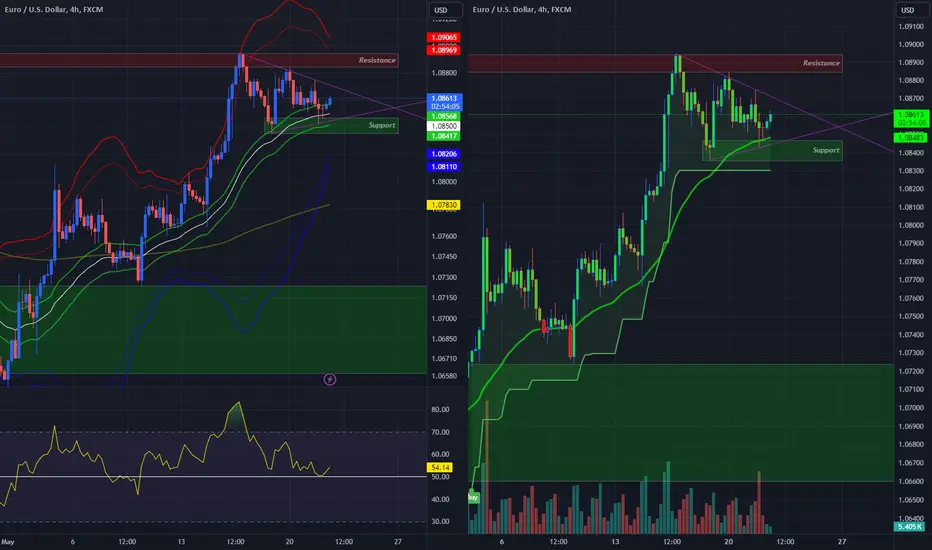
Pennant - EUHere I have EUR/USD on the 4 Hr Chart!
Price made a good push to the Upside surpassing the Highs earlier this month but then getting caught up by the Highs of April
Currently Price is bouncing back and forth between the Falling Resistance and Rising Support.
Potential False Break zones for both Resistance and Support are marked by the High and Low Points starting the pattern!
Pennants are patterns where the fight between Bears and Bulls is equal and eventually one will win out the other, this will be followed by a STRONG, CONVINCING Break of Pattern and Close to Validate the movement.
Fundamentally this week for both EUR and USD will be Flash Manufacturing & Services PMI being released Thursday!
As Indicators go:
-Above 200 EMA
-DSR Assist
-Above 50 RSI
-Super Nova Layout +3
Pennant
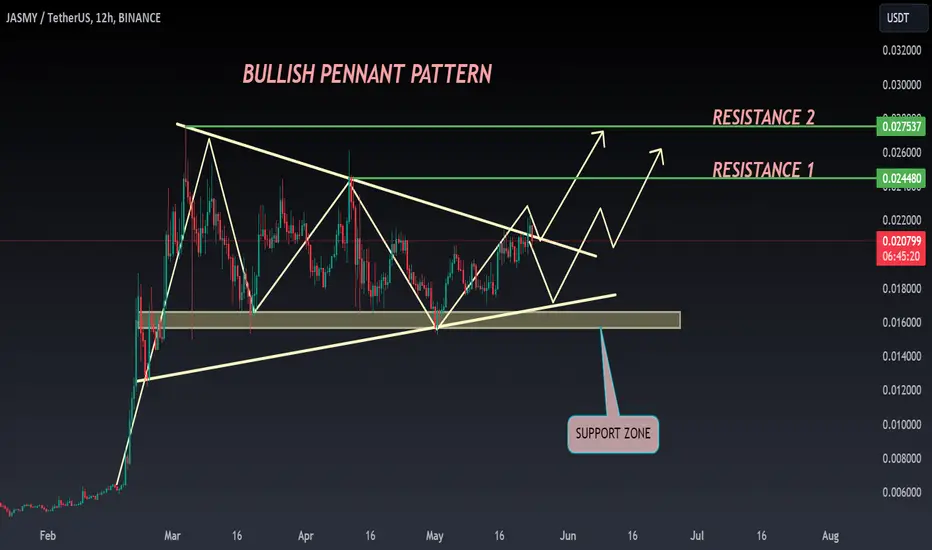
JASMY ANALYSIS🔴 #JASMY Analysis : ❓❓
🔮There is a formation of "Bullish Pennant Pattern" in #JASMY in daily time frame. We can expect around $0.02750 bullish move if the price perfectly retests the level📈📈
🔰 Current Price: $0.02081
🎯 Target Price: $0.02750
⚡️What to do ?
👀Keep an eye on #JASMY price action. We can trade according to the chart and make some profits. ⚡️⚡️
#JASMY #Cryptocurrency #Breakout #DYOR
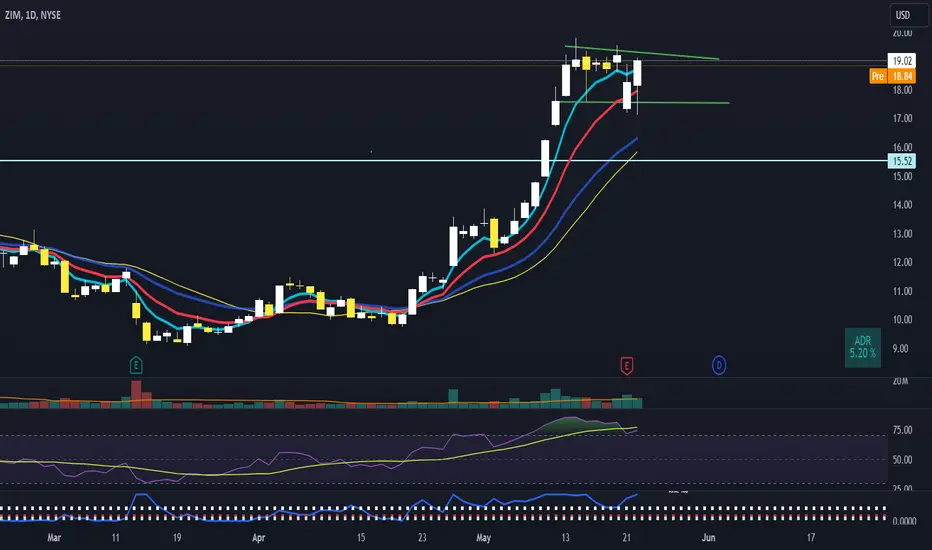
ZIM - Setting Up NicelyShipping stocks been in favour recently.
ZIM is setting up nicely, I would like it to rest for this week and early next week would love to a break on huge volume. It is being bought up on any down bars.
Might happen today as well so keenly monitoring this stock.
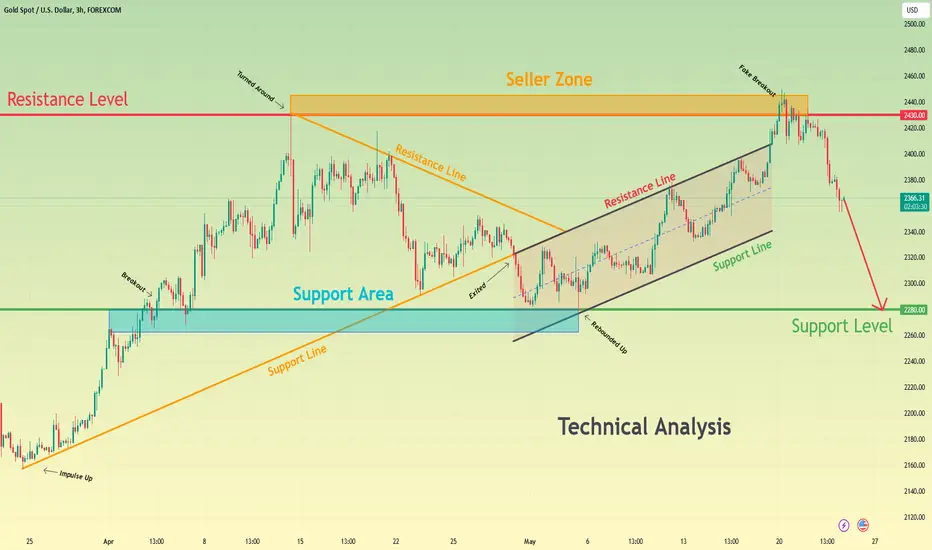
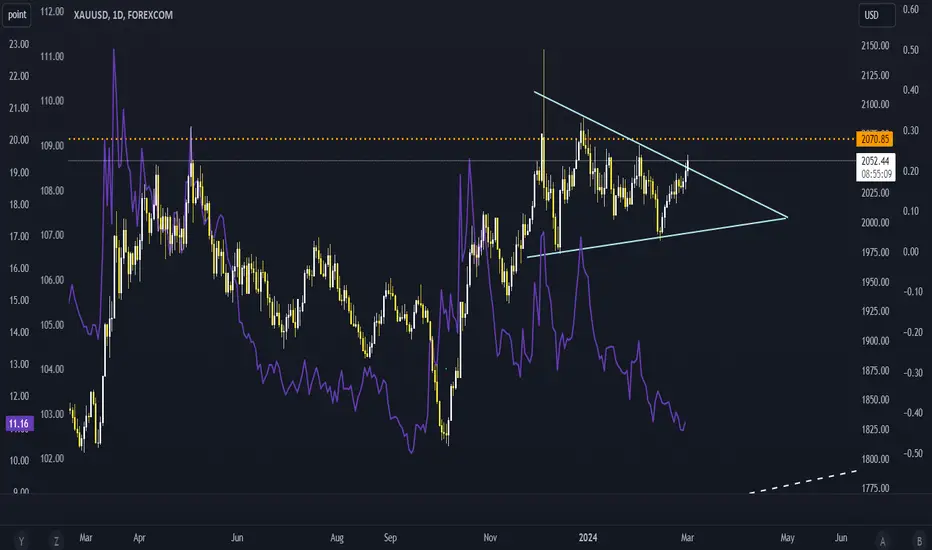
Gold can continue to decline to support levelHello traders, I want share with you my opinion about Gold. Observing the chart, we can see that the price some time ago declined to 2157 points, but at once turned around and started to grow inside the upward pennant, where it soon reached the 2280 support level, which coincided with the support area. Soon, Gold broke this level and continued to grow to the resistance line of the pennant, which coincided with the resistance level with the seller zone too, but at once rebounded, after reaching this line, and made a correction movement to support line of the pennant pattern. Next, the price exited from this pattern and fell almost to the support level, where it turned around and started to rise inside the upward channel. In this channel, in a short time rose to a resistance level, and even entered to seller zone, leaving the channel. But a not long time ago Gold turned around and made a strong downward move from the seller zone, making a fake breakout of 2430 level. Now, in my opinion, the price can continue to decline to the 2280 support level, therefore I set my target at this level. Please share this idea with your friends and click Boost 🚀
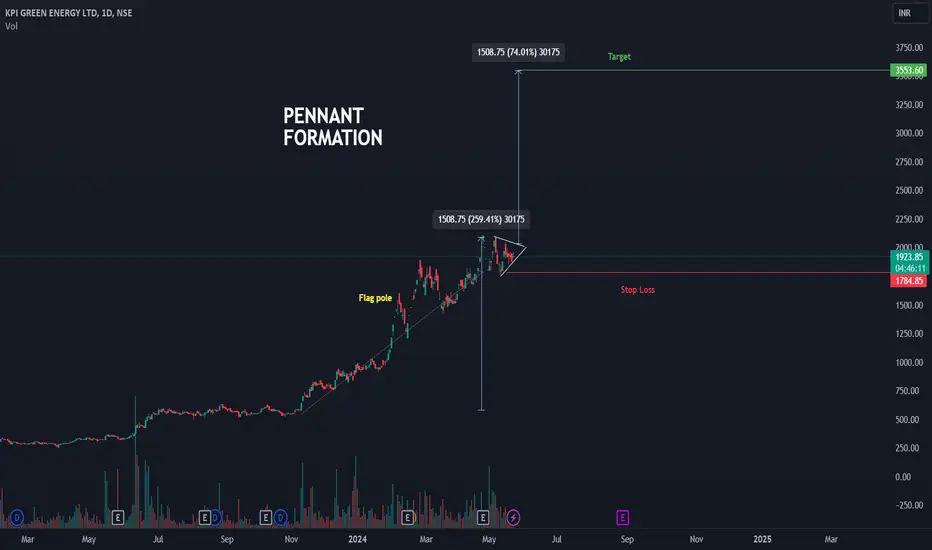
KPIGREEN : PENNANT FORMATIONNSE:KPIGREEN has recently experienced a significant bullish run, pushing its stock prices to new highs. Following this surge, the stock appears to be forming a classic pennant pattern, which is a continuation pattern often indicating that the prior trend will resume after a period of consolidation.
Breakout Potential: If NSE:KPIGREEN breaks above the upper trendline of the pennant with increased volume, it could signal the continuation of the bullish trend. Traders might look for a breakout above the resistance level as a buy signal.
Target Price: The height of the initial flagpole (the previous uptrend before consolidation) can be projected from the breakout point to estimate the potential upside target.
Stop Loss: To manage risk, consider placing a stop-loss order just below the lower trendline of the pennant. This helps protect against downside risk if the pattern fails and the price breaks below support. As always, proper risk management and due diligence are essential when trading pattern formations.
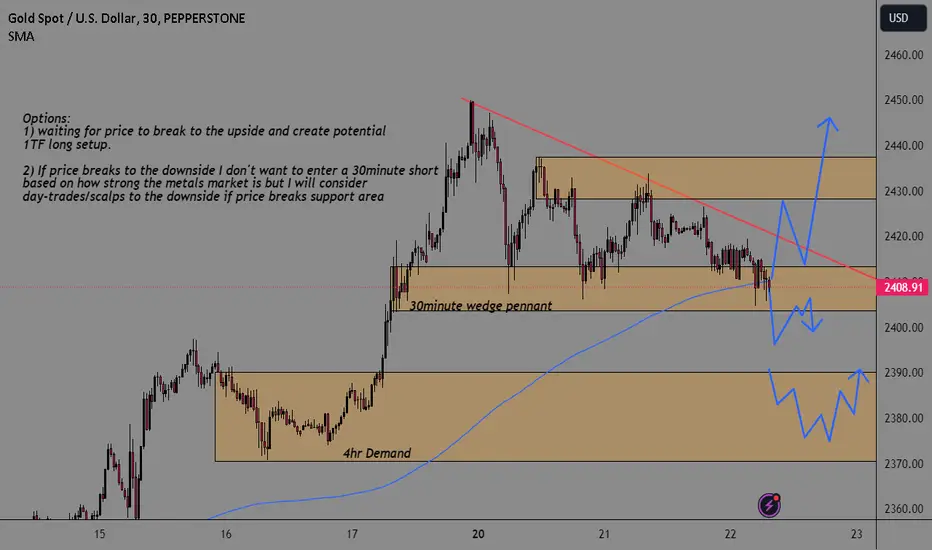
GOLD Wedge Pennant Break-out IncomeSee chart for analysis.
Options:
1) waiting for price to break falling wedge to the upside and catch the pullback.
2) if price breaks to the downside then consider looking for scalp shorts NOT swing shorts because how strong the metals market is.
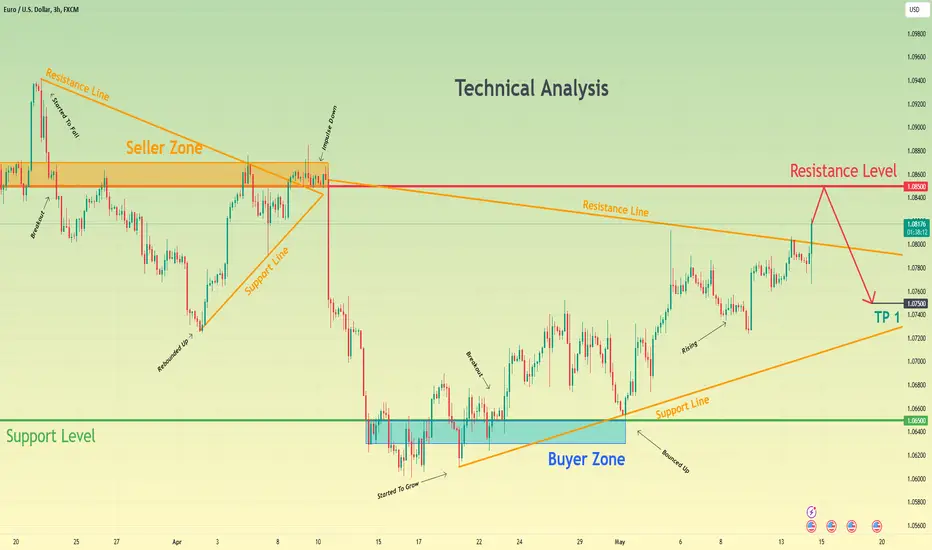
Euro can rebound up to 1.0900 points, exiting from pennantHello traders, I want share with you my opinion about Euro. By observing the chart, we can see that some time ago price rebounded from the support level, which coincided with the buyer zone and declined to 1.0650 points. After this, the EUR turned around and started to trades inside an upward pennant, where it in a short time rebounded from the support line and rose to the 1.0725 level. Soon, the price broke this level and started to trades inside the range, where it at some time rose to the top part of the consolidation, but soon turned around and declined to support line of pennant. After this movement, the EUR made an impulse up to the current support level, which coincided with the support area, thereby exiting from the range. Also soon, the price broke this level and later reached the resistance line of the pennant, after which turned around and started to decline near this line to 1.0835 level. Now, it continues to trade near this level, so, in my opinion, the Euro can little decline and then rebound up, exiting from the pennant pattern. For this reason, I set my target at 1.0900 points. Please share this idea with your friends and click Boost 🚀

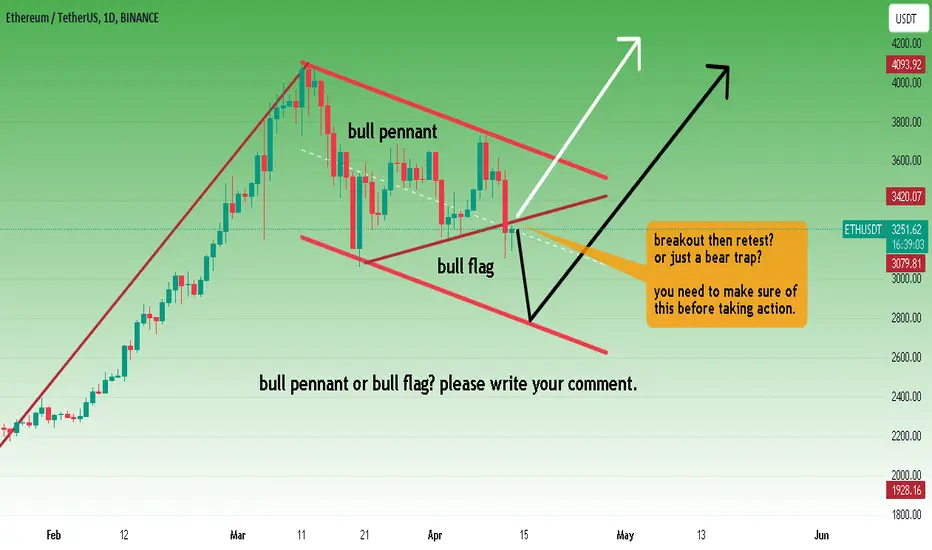
This is the real question to ask now.There are two scenarios.
1- Bull pennant
2- Bull flag
Write in the comments which one do you think?
- If it is a bull flag, there is a possibility to drop to $2800.
In a different analysis I shared yesterday, I gave the target of $2800. Please check it.
- If it is a bull pennant. Yesterday we had a bear trap and now retesting the breakout.
In both scenarios, I think we have beautiful days in front of us after Bitcoin halving.
* What i share here is not an investment advice. Please do your own research before investing in any digital asset.
* Never take my personal opinions as investment advice, you may lose all your money.
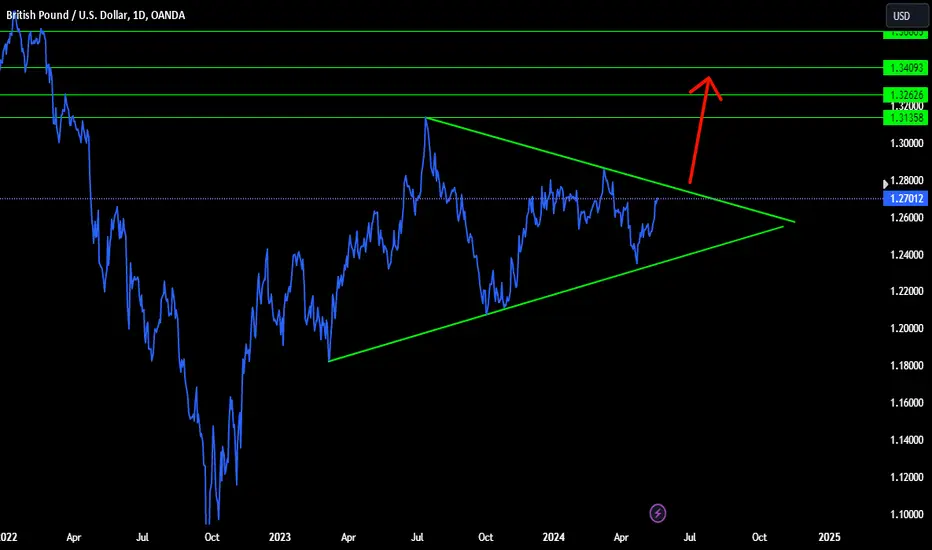
GBPUSD Swing Analysis on DAILYDaily currently in a bullish pennant.
Expecting price to reach daily support & resistance levels after breakout.
Swing / position stack opportunity.
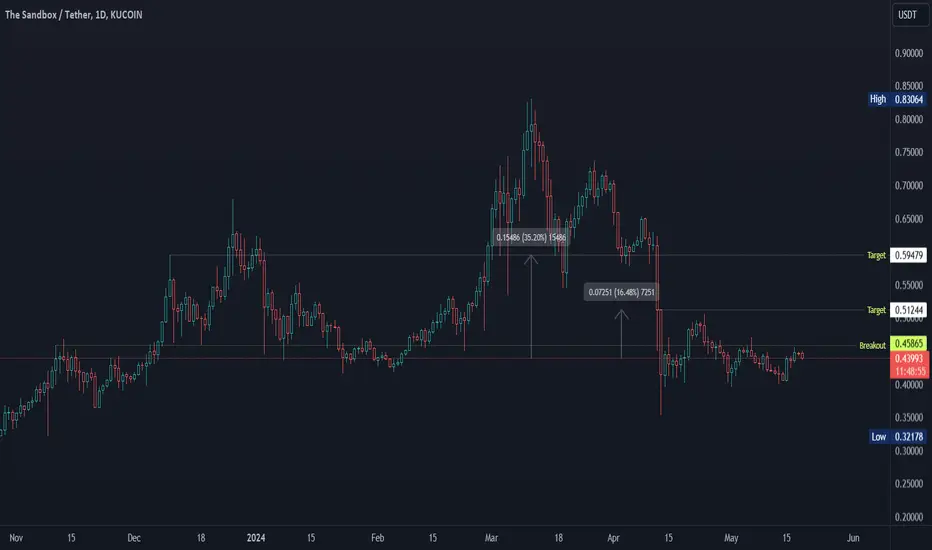
$SANUSDT POSSIBLE BREAKOUTKUCOIN:SANDUSDT
0.40 zone needs to hold as support and a possible breakout would provide interesting targets as marked. 0.40 could Fake Out so it's important to watch for these signals - and price tells you everything - just be patient. When you have a confirmation now you can pull the trigger on your planned move.
When planning moves we must consider the possibility of failure and you must manage risk and remember that CRYPTOCAP:BTC rules the show. Currently, CRYPTOCAP:BTC is sitting in a Bull Flag but price is in the pattern until it isn't so in the event of a pullback, we would look for a discounted entry on $SANDUSDT.
If you liked this idea or if you have your own opinion about it, write in the comments.
The information and publications are not meant to be, and do not constitute, financial, investment, trading, or other types of advice or recommendations.
Gold can start decline to support line of upward channelHello traders, I want share with you my opinion about Gold. Observing the chart, we can see that the price reached the support level, which coincided with the buyer zone, and soon broke this level and continued to grow inside the pennant. In this pattern, XAU rose to the current support level, which coincided with the support area, and even rose higher and reached the resistance line, after which turned around and made a correction to the support line of the pennant. Later price reached the 2400 level again and then made a strong downward impulse to the buyer zone, exiting from the pennant pattern and breaking the 2290 level. But soon, the price turned around and started to grow inside the upward channel, where it soon broke the 2290 level again. Next, Gold reached the resistance line, and made corrections to the support line, after which rebounded up to the support area, breaking the 2400 support level. As well recently, the price rose higher than the support area and now trades close to the resistance line of the upward channel. In my opinion, Gold can rebound from the resistance line and decline to the support line of the upward channel, breaking the current support level. For this case, I set my target at the 2370. points, which coincided with the support line of the channel. Please share this idea with your friends and click Boost 🚀

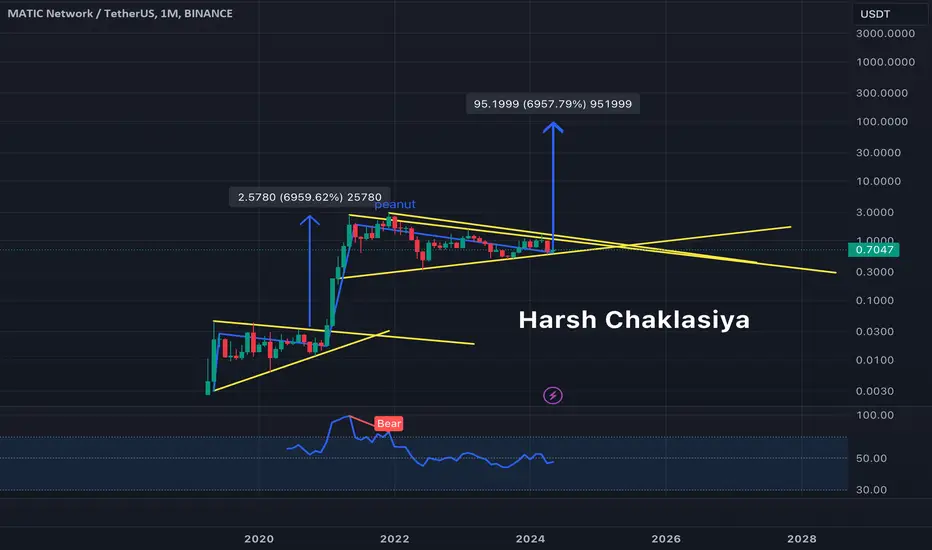
Bullish on PolygonReason.
1. Monthly Flag Pattern & peanut pattern very easily identify
2. From 2021 Breakout so it's been a 3 years
3. ALT Season is bullish
4. W is making like HL & LH
You can enter now or you can wait till above close 1.32 & Above close candle for Entry
SL : if you enter at 1.32 is 1
Target i will update expected move 6000% Up. as pr past graph it could be 95$ but let's target with 5$ 1st and then we can do swing trade :)
BNB Bullish Pennant - Target: $880Bullish pennant on BINANCE:BNBUSDT
Not Financial Advice
Fib retracements are drawn between the ATH and the 2022 low. Some levels are still very well respected. (The pennant's low, matches exactly 0.618 fib)
We are very close to the pennant's convergence, so a breakout should be imminent.
Watch for a breakout of the resistance trendline (solid orange), as the target for a breakout would be a new ATH at around $880.
Expect some resistance in the $690 area, as that was the previous ATH.

Bullish chance for ETH? Is there a new Altcoin season comming?ETH has shown real resistance at the 2800 mark. If we get into the green it might be a good idea to open some long term longs. If we hit the red marker, abort. If we get a new rally upwards we might be in for some altcoin action too! This is not financial advice.

Centaurus Metals ready to rip?After declining by more than 80%, Centaurus Metals has broken out of its downtrend. While this may be the first step in a multiweek base-building process for the nickel mine developer, the chance of a v-shaped bottom makes Centaurus worthy of a speculative add following this seriously bullish price action.

Euro can reach resistance level and then rebound downHello traders, I want share with you my opinion about Euro. By observing the chart, we can see that the price some days ago rebounded from the seller zone, which coincided with the resistance level and rose to 1.0940 points, after which it started to decline inside the pennant pattern. In this pattern, EUR broke the 1.0850 level and fell to the support line, after which at once rebounded and rose to the resistance line of the pennant. Soon, the price exited from this pattern and entered to seller zone, where the Euro some time traded and soon made a downward impulse. price broke 1.0850 and 1.0650 levels, and also later started to grow inside the wedge. In the wedge, the price soon broke the 1.0650 level, which coincided with the buyer zone and continued to move up. But later it made a correction move to the support line of the wedge, after which rebounded and rose until to the resistance line. When the price reached this line, it made a small correction move, after which at once backed up, and now it trying to exit from the wedge. So, in my opinion, the Euro, after exiting from the wedge can reach a resistance level and then the price will rebound down. For this reason, I set my target at 1.0750 points. Please share this idea with your friends and click Boost 🚀
After exiting from pennant, BTC can make retest and bounce upHello traders, I want share with you my opinion about Bitcoin. Observing the chart, we can see that the price a long time ago reached a resistance level, which coincided with the seller zone, and then made a downward impulse to 56500 points, thereby breaking the 60200 level. But later BTC turned around and made a strong impulse up to the resistance level, breaking the 60200 level, which coincided with the buyer zone one more time. Also, the price entered the seller zone, where it rose to 65300 points and then at once turned around and started to decline, breaking soon the 64600 level again. As well price continued to decline inside the pennant, pattern, where it corrected almost to the support level. After this, BTC rose to the resistance line, but at once rebounded then and fell to the 60200 level and then started to grow to the resistance line of pennant again. When BTC reached this line, the price broke it, thereby exiting from the pennant pattern and now it trades near. In my opinion, Bitcoin can decline to this line, making retest and then rebound up. For this reason, I set my target at the 64600 resistance level. Please share this idea with your friends and click Boost 🚀

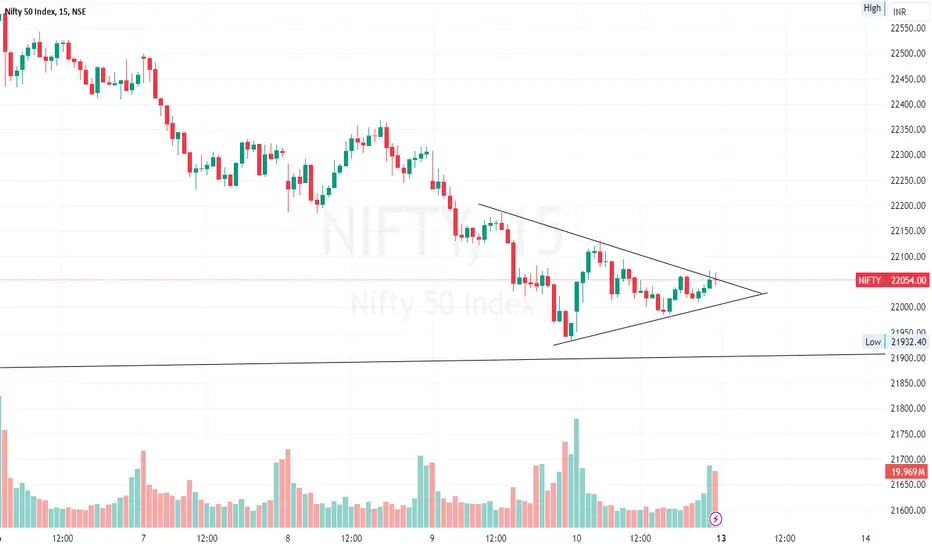
NIFTY 15Min CANDLE TRIANGLE PATTERN Nifty forms a wedge or triangle pattern in 15min time frame and double top completion spot may have high chance of reversal from 22000 mark
PRCT (Procept BioRobotics Corporation) - Pennant FormationCompany Info:
PROCEPT BioRobotics Corporation is a commercial-stage surgical robotics company. It focused on advancing patient care by developing transformative solutions in urology. The company develops, manufactures and sells the AquaBeam Robotic System, an advanced, image-guided, surgical robotic system for use in minimally-invasive urologic surgery with an initial focus on treating benign prostatic hyperplasia (BPH).
Technical:
Pennant formation after earnings thrust up.
Earnings:
Earnings came in good, not stellar. They recently released research on Aquablation therapy and it's benefits on treating BPH.
Trade Info:
I got into this trade today. Entry is at 63.80 and stop is sitting just below 60.
I would resort to profit taking on the 5 EMA and 10 EMA.

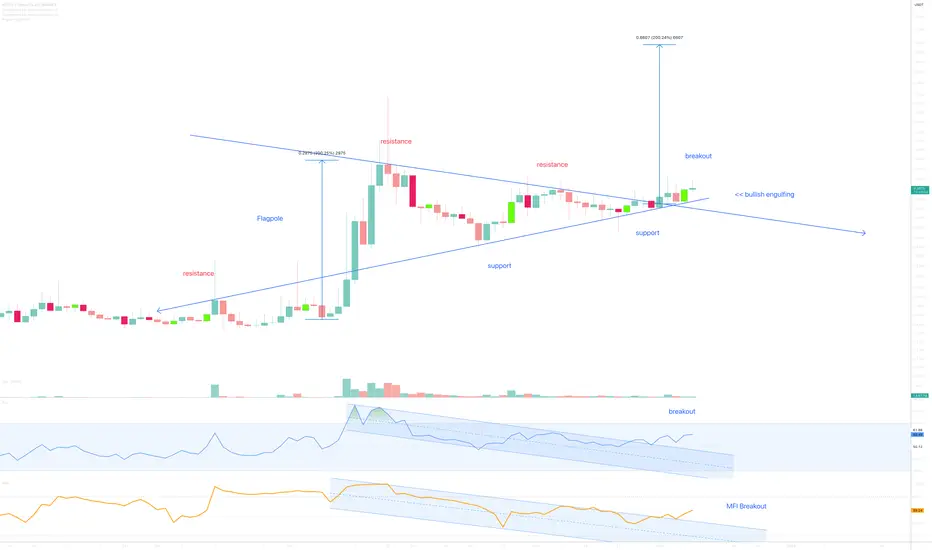
Frontier (FRONT)On the above 2-day chart price action has corrected over 60% since the 200% move in September (idea attached). A number of reasons now exist to consider a long position. They include:
1) Price action and RSI resistance breakouts.
2) Price action backtest on past resistance confirms support.
3) Volume. Money Flow resistance breakout. I don’t know why, but more money is flowing in than out.
4) The pennant formation, a reliable chart pattern on confirmation. Price action forecast is determined from taking the flagpole extension to the breakpoint.
Is it possible price action falls further? Sure.
Is it probable? No
Type: Trade
Risk: <=6%
Timeframe for long: Don’t know.
Return: 200%
Gold - Pennant Breakout - All Time Highs IncomingGold has broken out 3 month pennant.
In my opinion, it is ready to go test all time highs now (I am super bullish).
The best part of this breakout is look at the volatility measure through GVZ.
GVZ has tested the lows and is starting to have a bounce.
Every time Gold has tried to go above 2100, GVZ has been very high but this time around it's the other way around.
Ultimate target should be 2400, if we get a bullish close above 2100.
There is a rectangle formation from 1670 to 2070 on the weekly with a false break below 1670.
Other metrics would be Gold tend to gain before rate cuts and real rates are coming down after yesterday PCE.
Stops at 2024.
Goodluck!
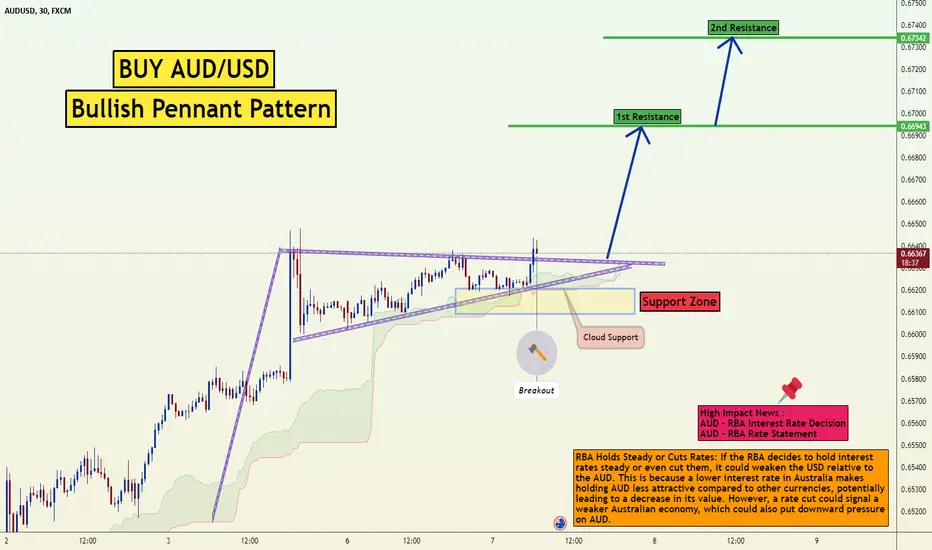
Buy AUD/USD Bullish PennantThe AUD/USD pair on the M30 timeframe presents a potential buying opportunity due to a recent breakout from a well-defined bullish pennant pattern. This breakout suggests a continuation of the prior uptrend and a higher likelihood of further gains in the coming hours.
Key Points:
Buy Entry: Consider entering a long position (buying) above the broken resistance level of the pennant, ideally around 0.6630 after confirmation of the breakout. This offers an entry point close to the perceived shift in momentum.
Target Levels: Initial bullish targets lie at the following points, based on the pennant and recent price movement:
0.6694: This target is obtained by measuring the height of the flagpole (initial uptrend before the pennant) and adding that distance to the breakout price.
0.6734: This is a further extension of the upside target, based on roughly twice the height of the flagpole.
Stop-Loss: To manage risk, place a stop-loss order below the broken resistance line of the pennant, ideally around 0.6600. This helps limit potential losses if the price unexpectedly reverses and breaks back downwards.
Thank you.