ICP Road Map🗺️!!! situation+next targets.Hi.
COINEX:ICPUSDT
Today, I want to analyze ICP for you in a 3D time frame so that we can have a mid-term view of ICP regarding the technical analysis. (Please ✌️respectfully✌️share if you have a different opinion from me or other analysts).
Bullish pennant is on the table on 3D timeframe🔍
Looking for a break out and more upside📈
✅ Due to the Ascending structure of the chart...
- High potential areas are clear in the chart.
- AB=CD
- Ascending pennant
Stay awesome my friends.
_ _ _ _ _ _ _ _ _ _ _ _ _ _ _ _ _ _ _ _ _ _ _ _ _ _ _ _ _ _ _ _ _
✅Thank you, and for more ideas, hit ❤️Like❤️ and 🌟Follow🌟!
⚠️Things can change...
The markets are always changing and even with all these signals, the market changes tend to be strong and fast!!
Pennant

Avax to $88 waiting for breakoutPopular EVM compatible coin AVAX BINANCE:AVAXUSDT has been forming a bullish pennant on the 12 hour timeframe. Recently a number of AVAX based meme coins have done well seemingly in response to AVAX coin’s performance.
According to data from coin gecko.com, the price of Avax has risen by 37.9% in the last 30 days and is up 228% over the last one year. Still this coin is down 55.7% from it’ all time high and a return to this valuation would be a 122% gain in price.
Wait for a bullish breakout from this pennant or a breakout plus retest to confidently trade this upwards with an initial or short term target just above $85. Happy Trading!
If you found this trade idea helpful in anyway kindly support my work by leaving a thumbs up, boost and/or sharing this post with your Crypto bros. To make sure you’re one of the first to get notified when I share a new trade idea, consider following my account. Happy Trading!

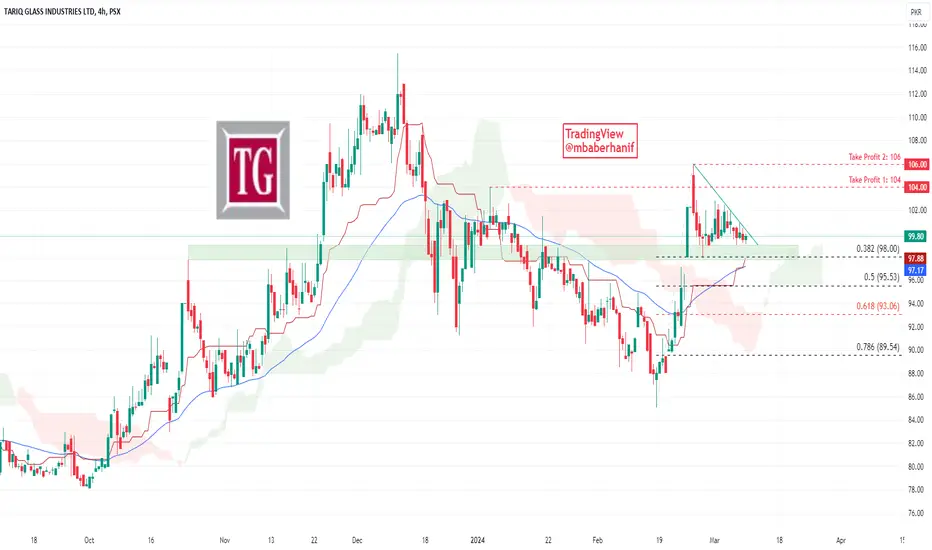
✴️ Tariq Glass Entering New Long-Term Bull-MarketTariq Glass is currently maintaining its support level at 98 for the past week, representing a 38.2% Fibonacci retracement from the 106 level. Additionally, the stock has reached the breakout level of a descending trend line, signaling a robust bullish breakout. Furthermore, it has surged above the EMA50 indicator in the ongoing session. Consideration of long positions is advisable within the range of 100-98. Following the breakout from the trend line, the initial target is positioned at 104, with a secondary target at 106. Conversely, in the event of a downside breakout, employing a stop-loss strategy at 95 is recommended to mitigate risk exposure.
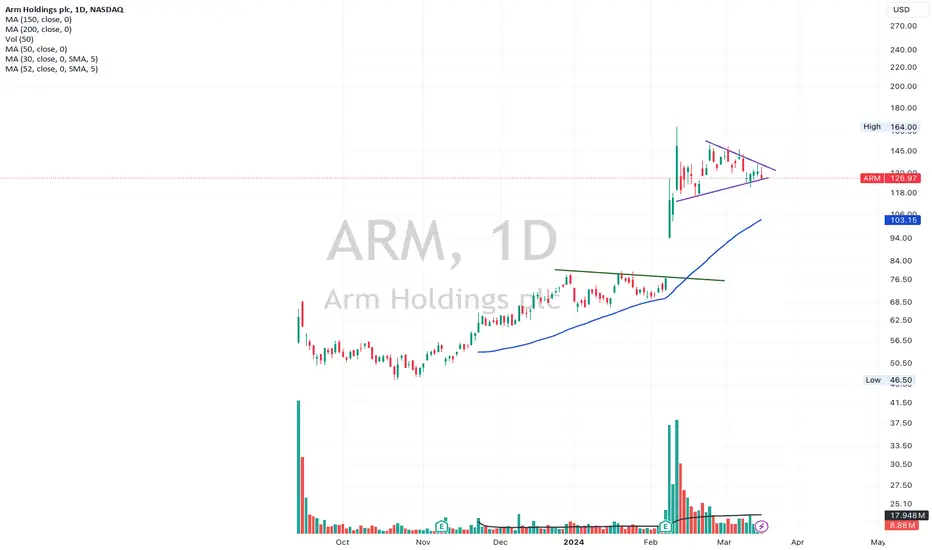
ARM March 15, 24: A Symmetrical Triangle?On March 15, 24, I am looking to trade NASDAQ:ARM using this symmetrical triangle/bullish pennant pattern.
A move up piercing the upper trendline will present a buy signal, with volume confirmation on break out.
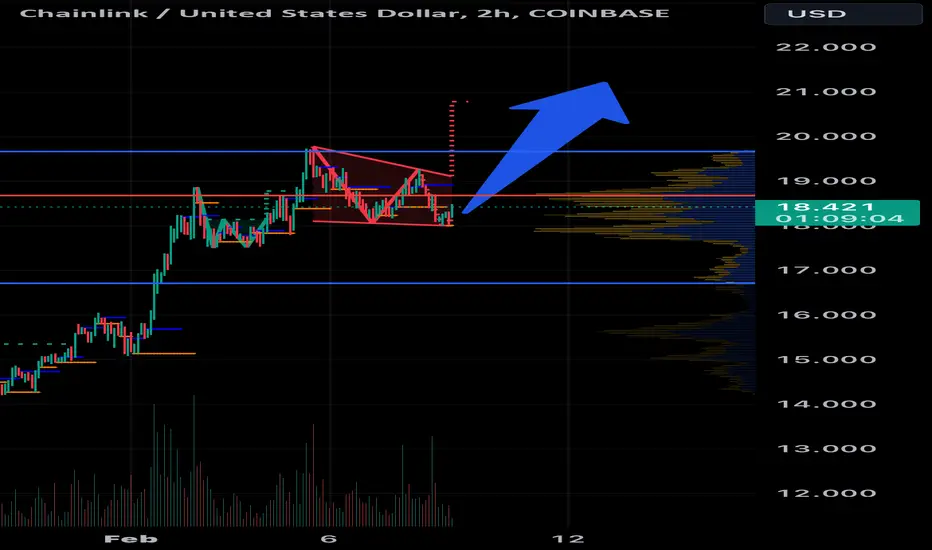
Link still on track.LINK/USD 2hr chart shows a potential breakout from a wedge pattern with a target of $21. A break above $18.70 can trigger breakout.
The LINK/USD 2hr chart shows an interesting development with a potential breakout from a wedge pattern. The price has broken above the resistance trendline and could potentially reach the target of $21 based on the measured move technique. However, this is not a prediction, and other factors could influence the price action. What are your thoughts on this potential breakout and its implications? Remember, this is for educational purposes only, and you should always do your own research before making any investment decisions.
Binance Coin can exit from pennant and decline to 515 levelHello traders, I want share with you my opinion about Binance Coin. Looking at the chart, we can see how the price some time ago declined to 515 support level, which coincided with the buyer zone and at once rebounded and started to move up. Soon, the price reached a resistance level, which coincided with the seller zone and broke it, after which BNB rose a little and then made a correction below this level. Next, the price broke the 587 level again and later rose to 645 points, after which it turned around and started to decline in a downward pennant, where soon broke the resistance level one more time. After this movement, BNB made a retest of the resistance level and in a short time declined to the buyer zone, which later reached the support line of the pennant. Then price rebounded from the support line and rose to the resistance line, which coincided with the resistance level, but a not long time ago BNB rebounded and fell to the support line, which continues to rise near to this day. So, I think Binance Coin can reach the resistance line, after which turns around and starts to decline to the support level, thereby exiting from the pennant. For this case, I set my target at the 515 level. Please share this idea with your friends and click Boost 🚀

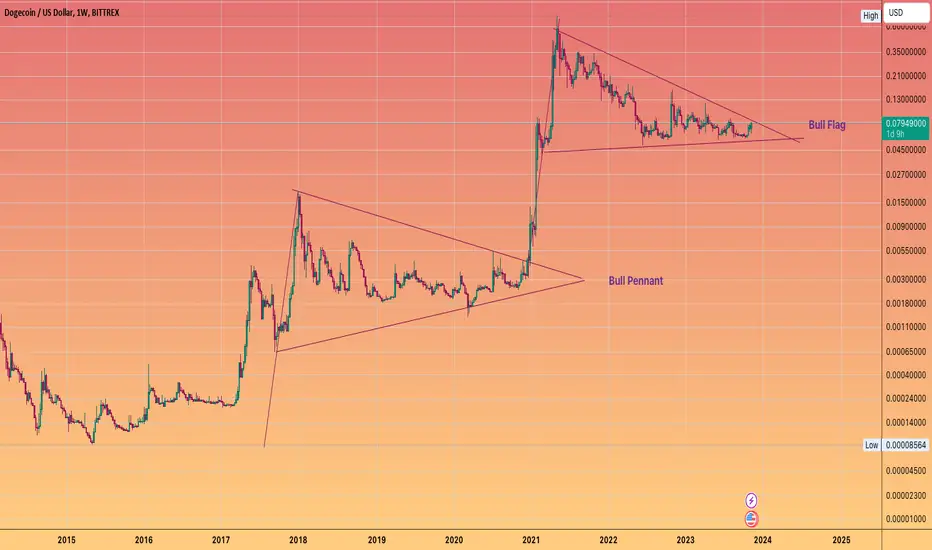
Dogecoin - Here we go againHere u can see how the previous cycle DOGE exploded out of a Bullish pennant
Which in my mind is a little bit more bullish than the current "Flag"
Which suggests there may be less euphoria this time around
We can use Doge as a Greed / Sentiment indicator either way :)
📉 Bitcoin's Bear Pennant Breakout: Measured Move to $59200 withAbstract:
🐻 Bitcoin is poised to break from a 4-hour bear pennant pattern, signaling a potential move to the $59200 area. 📈 This analysis explores the implications of this breakout, which aligns with the Shibunacci indicator, offering additional confirmation. 🔄
Introduction:
Bitcoin's imminent breakout from a 4-hour bear pennant suggests a shift in market dynamics. 📉 Traders are anticipating a measured move towards the $59200 region, reinforced by confluence with the Shibunacci indicator. 🔍
Bear Pennant Breakout:
The bear pennant formation on the 4-hour chart indicates a period of consolidation followed by a potential downward continuation. 📉 Bitcoin's price action within this pattern sets the stage for a decisive breakout, with implications for future price movements. 📊
Measured Move Target:
Applying the measured move technique to the bear pennant's height suggests a target around the $59200 area. 🎯 This level serves as a focal point for traders monitoring Bitcoin's price trajectory, offering potential entry and exit opportunities. 💰
Shibunacci Indicator Confluence:
The alignment of the breakout target with the Shibunacci indicator adds further conviction to the bullish thesis. 🔍 Traders utilizing this indicator may find additional confirmation of Bitcoin's upward potential, enhancing their trading decisions. 💡
Conclusion:
Bitcoin's impending breakout from the 4-hour bear pennant pattern, with a measured move target to the $59200 area, presents opportunities for traders. 🚀 The confluence with the Shibunacci indicator reinforces the bullish outlook, providing a comprehensive perspective for informed trading strategies. 📈

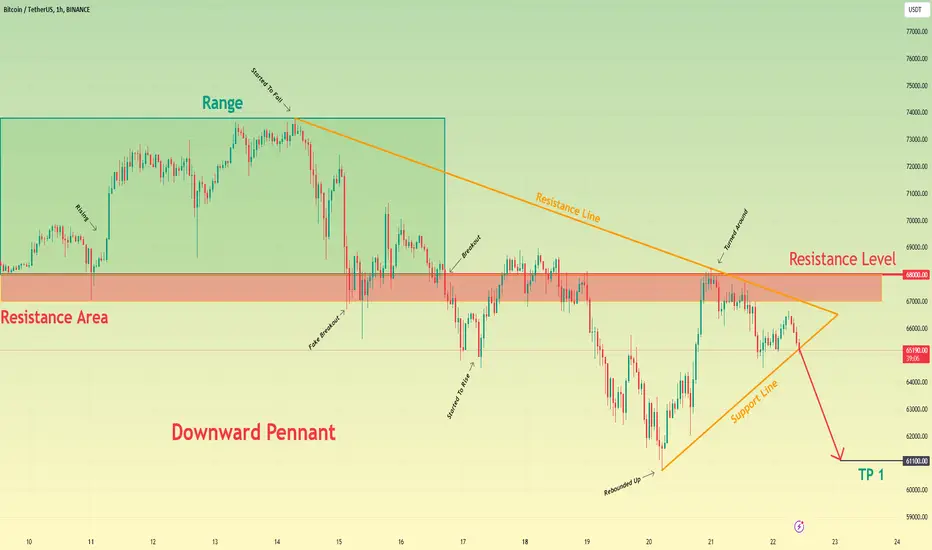
Bitcoin can exit from pennant and then continue to fallHello traders, I want share with you my opinion about Bitcoin. If we look at the chart, we can see how the price a no long time ago and started to trades in the range, where it rebounded from the resistance level, which coincided with the resistance area, and the bottom part of the range, started to rise to the top part. After BTC reached the top part of the range, it turned around and started to decline in a downward pennant, where soon BTC fell to the resistance area, but at once backed up to range, making a fake breakout of the 68000 level. A short time later price finally broke the 68000 resistance level, thereby exiting from the range and declining lower than resistance area, but then it tried to back and failed. Bitcoin declined to support line of pennant, after which it at once rebounded and rose to the resistance line. After this movement, the price turned around and soon declined to support line of the pennant, which continues to trades near. In my mind, Bitcoin can exit from the pennant and continue to decline. So, that's why I set my target at the 61100 level. Please share this idea with your friends and click Boost 🚀
GOOG Forming a “Cup and Handle” & a “Bull Pennant”Google is currently forming a “Cup and Handle” pattern on the weekly chart and a “Bull Pennant” pattern on the daily chart. I think it’s safe to say Google maybe be picking up some bullish momentum soon…..let’s see how this one plays out!

Gold can leave pennant, break support level and then make retestHello traders, I want share with you my opinion about Gold. Looking at the chart, we can see how the price recently traded in the buyer zone, where XAU soon reached the 2040 support level and broke it. After this movement, the price made retest and then started to trades in an upward pennant, where firstly Gold made a strong impulse up to the current 2150 support level, which coincided with the support area. After this, the price broke this level and rose to the resistance line of the pennant, but at once turned around and in a short time declined to the support level. Soon, the price turned around and some time traded between the resistance line and this level, and last time Gold fell to the support line of the pennant, where at the moment trades very close. So, in my mind, Gold can exit from the upward pennant, break the support level, and then make a retest. After this movement, I think also that XAU can continue to decline, therefore I set my target at the 2110 level. Please share this idea with your friends and click Boost 🚀

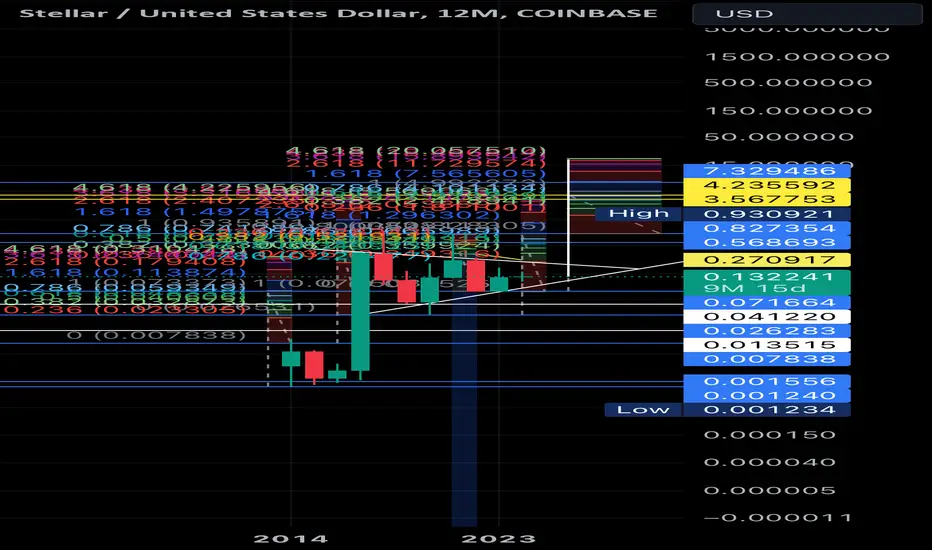
Stellar XLM The biggest Moon 14.00 +XLM BULL PENANT/FLAG
This is just and idea. Why so stagnant? For years after years in regards to new ATH?! Because the pole upwards is coming!
XLM has been working and building in the background. Lately with the new Soroban contracts phasing out. XLM is becoming a Real World Assets commodity. The project and foundation has kept an ear to the damn US government in regards to compliance and regulation. In price action terms XLM is considered dead because it’s brewing up ready to blow off.
Don’t be deterred nor discouraged. I believe we are in a super cycle. If the pole breaks upwards and you held, though you may have traded the last bull run. You have to hold XLM’s bottoms on the pennant/flag.
The highest hopium is the highest risk. If it pays off, you’re rich.
Gold Setting up For Sell1,2,3 flag for down movement ... is the main pattern forming a continuation pattern or it is ushering a reversal

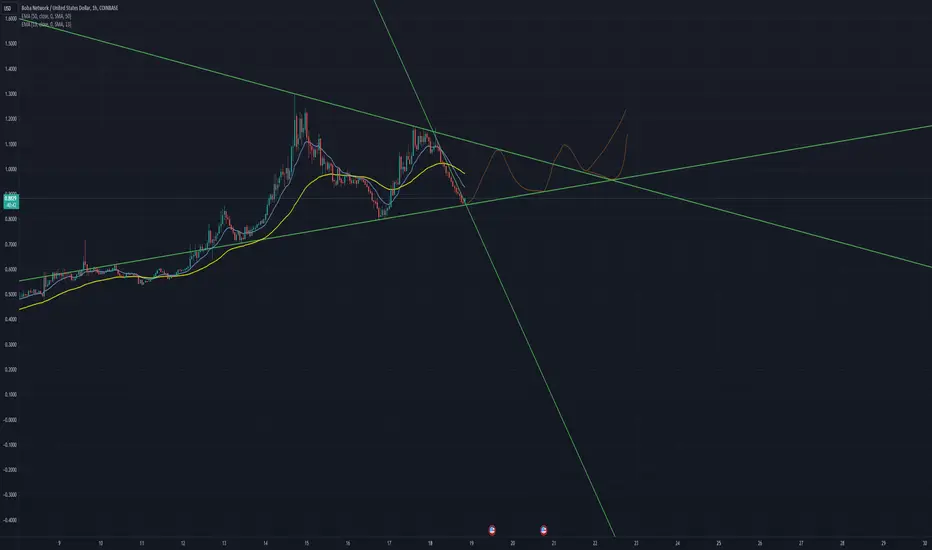
Perfectly lined up Bullish Pennant on BOBASeeing a nice bounce on the lower end of the flag.
Target of this leg up is 1.075. (or perhaps 1.0480 when it's taking longer to complete)
Will update this idea further when the pennant is forming and eventually breaking out.
MPWR: Breakout Coming?I'm seeing a pennant pattern with a refined resistance level and short term rising trend line. I'm expecting a breakout sooner or later backed by positive analyst expectations. Target just below $700.

MATIC/USDT can beIt is retesting its support and a monir fall can trigger liquidity after which we can see a pump above 1.2 entry should now market price 1.1058

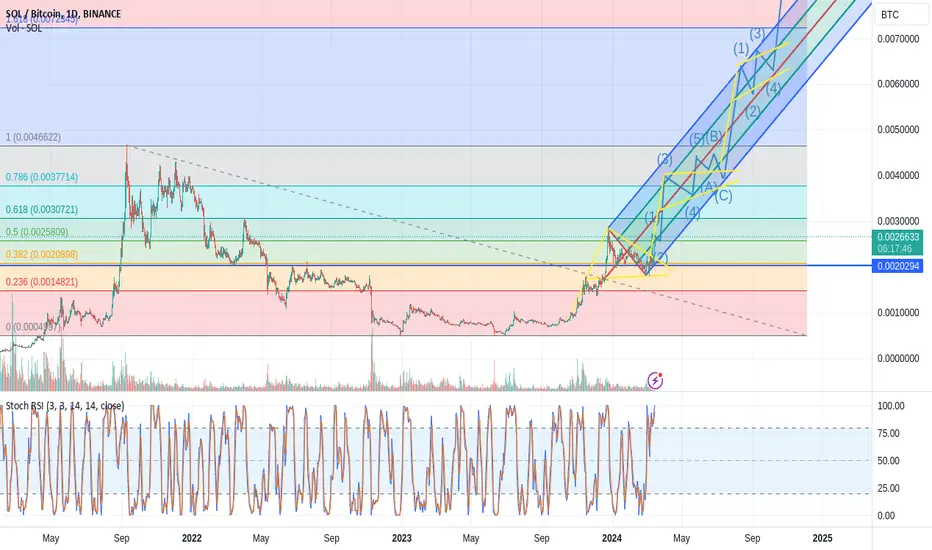
0.007 ($1k/$400B MC) SOL @ Halloween, 6 month bull flag breakoutAfter the multi-month cup & handle (inherited from btcusd), upside breakout.
A bull flag over the last 6 months had formed, and finally broken out this week.
Expect continuation of this bullish pattern throughout 2024 leading into the 2025 bull run.
Despite the lack of decentralization & costs for running a node, solana is the #1 blockchain by many metrics. Users will continue to be onboarded via meme coins and become solana defi advocates, leading to more adoption.
BTC will become prohibitively expensive for the masses, leading to financial security decisions made to hodl the base layer token.
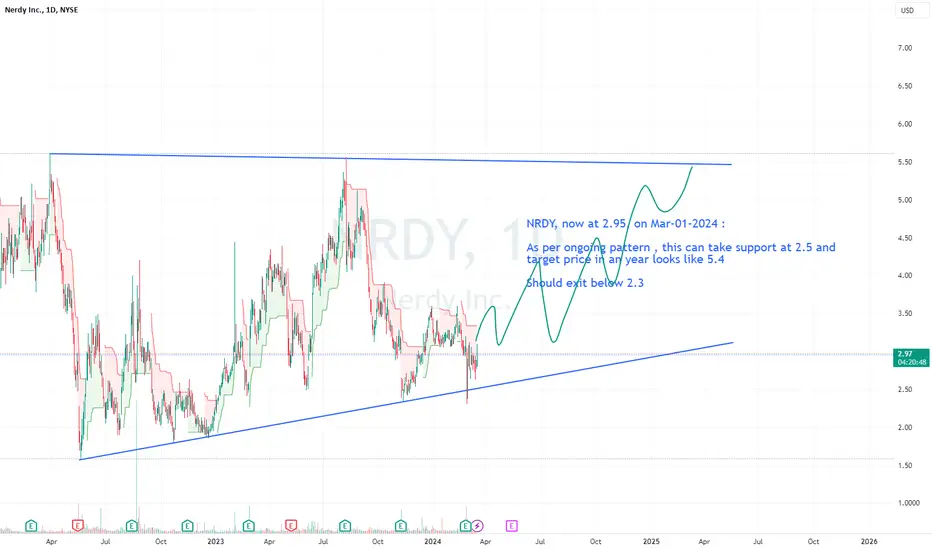
How to trade NRDYNRDY, now at 2.95, on Mar-01-2024 :
As per ongoing pattern , this can take support at 2.5 and
target price in an year looks like 5.4
Should exit below 2.3
Suppose this takes a flat pattern, then this might not fall till 1.6 and reverse.So be ready for this also and plan for fund allocation and weightage allocation.
FYI, i have invested little in this and will hold for 1 year or till the target price is achieved.
Total Cryptocap’s log chart just hit the falling wedge targetIf we take the teal bull pennant and only measure the pennant part which is also a falling wedge, the target we get from the breakout has just been hit by our current price action. I felt that was worthy of posting a chart bout. Though bitcoin has already achieved a new all time high days ago, the entire market cap for all of crypto is still just below it’s previous all time high currently. I would expect that to change in the very near future, however there’s always a chance at a retracement once rice hits the full breakout target. Since we just hit the full breakout target of the teal falling wedge, then it could retrace, if it does it may take longer to reach a new all time high. ALso possible for it to pump just enough to reach a new all time high then start its retrcement, correction, or sideways consolidation. Either way we can see as I have stated in previous charts, that this falling wedge is also a very valid bullish pennant and the breakout target once you include the height of the pennants flagpole for your measured move line, Is a staggering 17.5 trillion or so…No guarantee we hit the full target this bull run, however the ay the bitcoin spot etf buying has kind of changed the paradigm of what’s possible there’s definitely a chance we could hit this full target for this current bull run. As I have stated in the past the dotted yellow measured move line to the left is a measured move target from a pennant we broke up from 2 bull cycles ago and it didnt hit its full target in that bull run. However since it is in a very close proximity to the price target of this teal pennant’s measured move breakout target as well, it creates a good bulllish confluence and we could see both targets hit this bull run. I would say worst case scenario we head to those targets by next bull run but very plausibly can reach them during this one. *not financial advice*

Swiss Franc can exit from pennant and continue fall to 0.8700Hello traders, I want share with you my opinion about Swiss Franc. Looking at the chart, we can see how the price reached the resistance line of the downward channel, after which CHF rebounded down and declined to the support line of the channel, breaking the 0.8635 level, which coincided with the buyer zone. Then the price turned around and entered the pennant, where it made a strong impulse up to the resistance level, exiting from the downward channel and breaking the 0.8635 level one more time. After this CHF broke the 0.8820 level, which coincided with the seller zone, but soon it turned around and fell back and some time traded very close to the resistance level. Later, the price started to grow back and in a short time, CHF reached the 0.8820 level again, broke it, and rose to the resistance line of the pennant. But soon, the price rebounded from this line and declined to support line of the pennant, thereby breaking the 0.8820 resistance level again. After this, the price bounced from the support line and rose to the resistance line of the pennant, where, at the moment, CHF continues to trades near. In my opinion, the Swiss Franc can fall to the support line, after which it at once will bounce to the resistance line and then CHF can make an impulse down, thereby exiting from the pennant. For this case, I set my target at the 0.8700 level. Please share this idea with your friends and click Boost 🚀

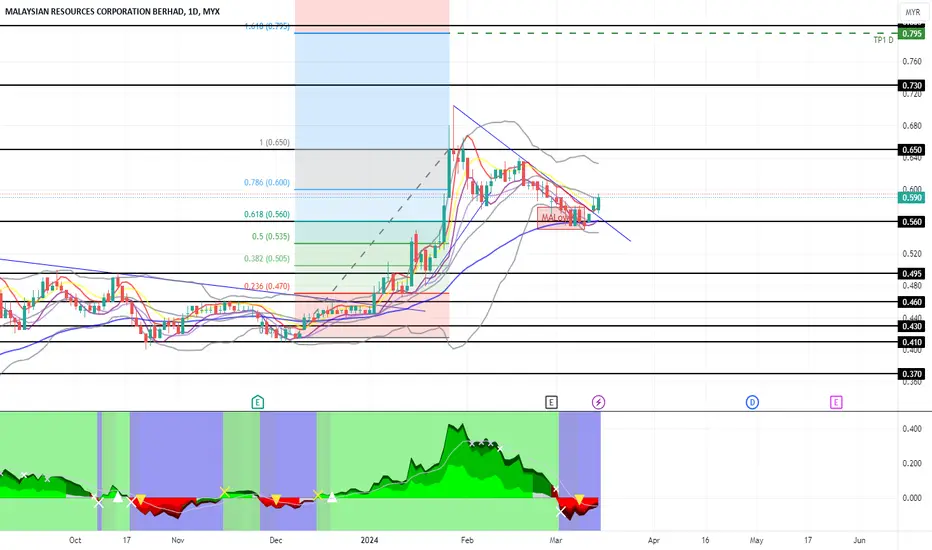
MRCB Breakout From DT Line - Good Price to EntryThis undervalued construction and property player in Malaysia, MRCB has shown good performance recently. Pullback from the 52Wk high at 0.705, the price now stabilize around 0.56 to 0.59.
The intrinsic value for Malaysian Resources Corporation Berhad is RM9.91 based on Discounted Cash Flow Valuation, that is discounted 94.2% from current price.
Price now recently break from downtrendline (refer chart) and need to break MID BB (MA20) at daily timeframe to confirm the uptrend mood. My price target using fibo is at TP1 D: RM0.795, TP2 D: RM1.03
Hold for long term investment! cheers
How to Trade BLS InternationalBLS Intl, now at 343 on March-14-2024 :
2 ongoing patterns can be seen
#1. Per EW, the major Motive wave is completed and retracement is done closer to 0.382 and rising again, So, invest few now, invest until 256 for target of 604.5 in 1-1.5 yr holding period
#2. Per another ongoing pattern ( highlighted zone ), One can invest until 300 for a target of 604
As strict stoploss of 255
Expected Gains from curent price --> 76.2%
Prefer to invest regularly in this

VET: Fractal Patterns and OpportunitiesVeChain (VET) is a blockchain platform that aims to improve supply chain management and traceability. The VET/USDT trading pair has been exhibiting fractal patterns on the daily chart, which can be used to identify potential trading opportunities.
Fractal Analysis:
Repeating patterns: The VET/USDT chart has been forming a series of repeating patterns, such as triangles and flags. These patterns suggest that the price is likely to continue moving within a range until a breakout occurs.
Fibonacci retracement: Applying Fibonacci retracement to the previous bullish impulse wave shows that the 0.618 and 0.5 retracement levels are at $0.06 and $0.07, respectively. These levels could act as potential targets for a breakout.
Trading Opportunities:
Breakout trades: Traders can look for breakout opportunities above the resistance level of the current pattern. A breakout above $0.055 could signal a continuation of the bullish trend.
Retracement trades: After a breakout, traders can look for retracement opportunities to enter a trade in the direction of the breakout. The 0.618 and 0.5 Fibonacci retracement levels could be potential areas of support.
Artificial Intelligence (AI) Hype:
There is currently a lot of hype surrounding AI-related cryptocurrencies. VET has been associated with AI due to its partnership with IBM and its use cases in supply chain management. This hype could provide additional tailwinds for the VET price.
Conclusion:
VET/USDT is trading in a range on the daily chart, with repeating fractal patterns. Traders can look for breakout and retracement opportunities based on these patterns. The recent hype surrounding AI-related cryptocurrencies could also provide additional momentum for VET.
