Watching to see if we break the up side of a long term triangleNASDAQ:EA The daily chart shows a pennant forming, which has been broken by closing above the top of the pennant @ $140.
In the weekly view (shown here), there's a triangle pattern. Top of the triangle is ~$151 and was established in 2018 and tested in 2021. If the top of the triangle is tested and broken (closing above $151 for the week), then this has a lot of upside.
If $151 is tested and rejected, then we're heading back down to test the lower edge of the triangle.
Good Luck!
Pennant

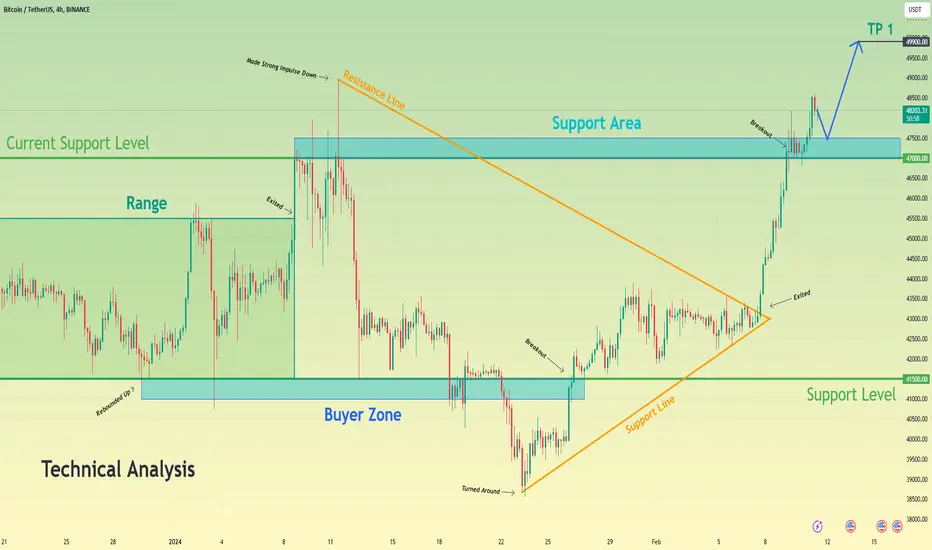
Bitcoin can little correct and then continue to move upHello traders, I want share with you my opinion about Bitcoin. Observing the chart, we can see that the price some days ago traded in the range, where it firstly declined to the 41500 support level, which coincided with the buyer zone, but soon BTC turned around and made impulse up higher than the bottom part of the range, thereby exiting from it. Next, the price entered to the pennant, where it rose to the resistance line, after which it made a strong downward impulse to the support line, thereby breaking two levels - 47000 and 41500. Later price turned around from the support line and in a short time rose higher than the 41500 level, breaking it one more time and little time later BTC reached the resistance line of the pennant and broke it too, exiting from the pennant pattern. After this movement, Bitcoin rose to its current support level, which coincided with the support area, and recently broke it also, after which the price made a retest and continued to move up. At the moment, the price trades near the support area, and in my mind, Bitcoin can correct to the support area, and then BTC will bounce and continue to grow. For this case, I set my target at the 49900 level. Please share this idea with your friends and click Boost 🚀
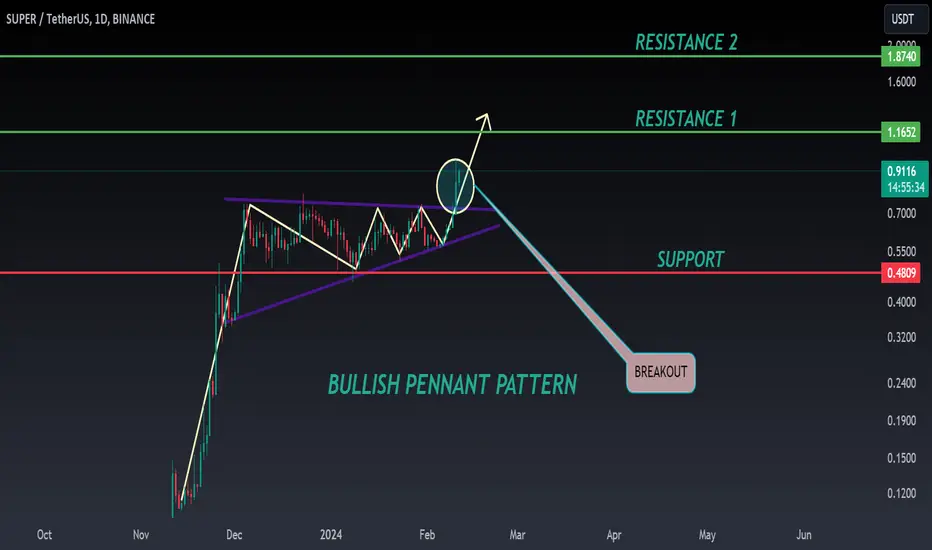
SUPER ANALYSIS🔴 #SUPER Analysis : ❓❓
🔮There was a formation of Bullish Pennant Pattern in #SUPER and breakout the pattern with good volume. We may see a rise in #SUPER📈📈
🔰 Current Price: $0.9097
🎯 Target Price: $1.1652 and more
⚡️What to do ?
👀Keep an eye on #SUPER price action. We can trade according to the chart and make some profits. Stay tuned for further analysis and stay updated with market sentiments and news.⚡️⚡️
🏷Remember, the crypto market is dynamic in nature and changes rapidly, so always use stop loss and take proper knowledge before investments.
#SUPER #Cryptocurrency #TechnicalAnalysis #DYOR
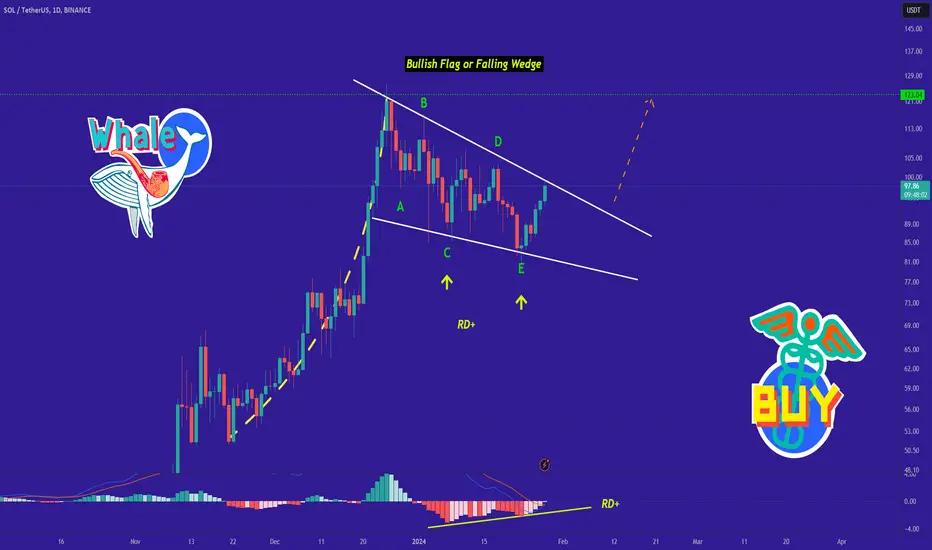
I Cannot Short This !!! Hi every one
➡️SOL has done a Impressive Movement recently but the odds of another bullish Movement is Pretty high because the pattern which SOL is in, Is a Bullish flag Pattern ! Since The break out has not happened, there is no confirmation of a Bullish Movement But If It happens, we Can Expect a Bullish Movement as much as the Measured Price movement ( Flag pole ) to happen!
🟡 Summery:
- SOL has been Bullish Recently!
- The odds of another Bullish Movement is High!
- Bullish flag is Visible on The chart!
- No break out yet!
- Bullish Divergence
🤑 Stay awesome my friends.
_ _ _ _ _ _ _ _ _ _ _ _ _ _ _ _ _ _ _ _ _ _ _ _ _ _ _ _ _ _ _ _ _
✅ Thank you, and for more ideas, hit ❤️ Like ❤️ and 🌟 Follow 🌟!
⚠️ Things can change...
The markets are always changing and even with all these signals, the market changes tend to be strong and fast!!
I Cannot Short This !!! situation+next targets.Hi.
COINEX:LSKUSDT
-has formed a bullish pennant pattern on the 4-hour timeframe.
-A breakout above descending resistance could lead to a pump higher🚀
_ _ _ _ _ _ _ _ _ _ _ _ _ _ _ _ _ _ _ _ _ _ _ _ _ _ _ _ _ _ _ _
✅Thank you, and for more ideas, hit ❤️ Like ❤️ and 🌟 Follow 🌟!
⚠️Things can change...
The markets are always changing and even with all these signals, the market changes tend to be strong and fast!!

AMD Beautiful Consolidation into PennantAMD is consolidating really nicely after making new highs in late January. Surfing the 20 EMA on the daily chart as well. This will be a top focus for me heading into next week.

Bitcoin Pennant spotted!Looks like Bitcoin´s current correction is now ready for an uptrend rally, or about to be.
I have spotted a traditional "pennant formation" which could shoot up to $48250-$48700 or perhaps even touch/briefly break, the prior $49000 "Bitcoin Spot ETF" high which took place Jan 11, 2024.
Entry points should be sought after pullback, at the $43380-43400 area or so.
Have a nice (LONG) trade.
:)

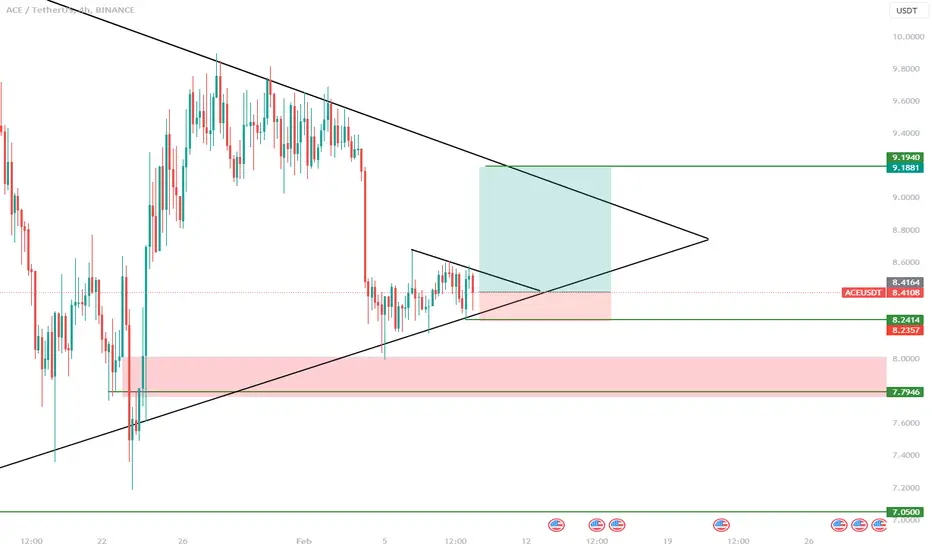
ACE looking bullishJumping in on 5X long on ACE, looking good here. ACE has very limited supply as of now, & can be manipulated easily, But I think it's a good trade so I got in. NFA
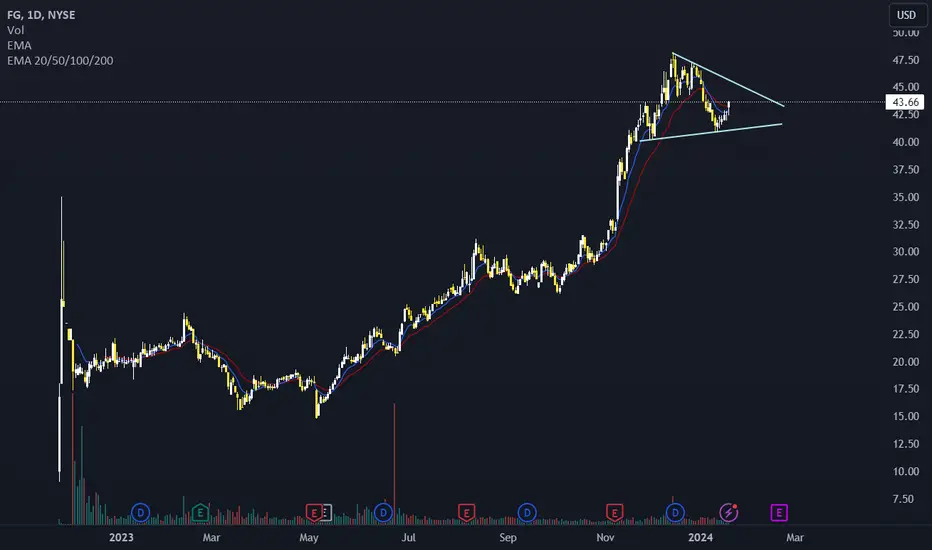
FG - F&G Annuities and Life - Pennant Breakout ImminentF&G is an annuity and life insurance company.
Annuities and Life Insurance have been enjoying a good run due to higher interest rates.
High interest rates decrease reinvestment risk.
For annuities, higher interest rates mean higher income for customers.
Baby boomers are retiring so there will be a massive demand for these products. The fixed income part of it would be the seller even if rates go down from here.
Chart has formed a pennant and will go long on the breakout.
Initial target around 60 as there is a bull flag element from 32 to 47.
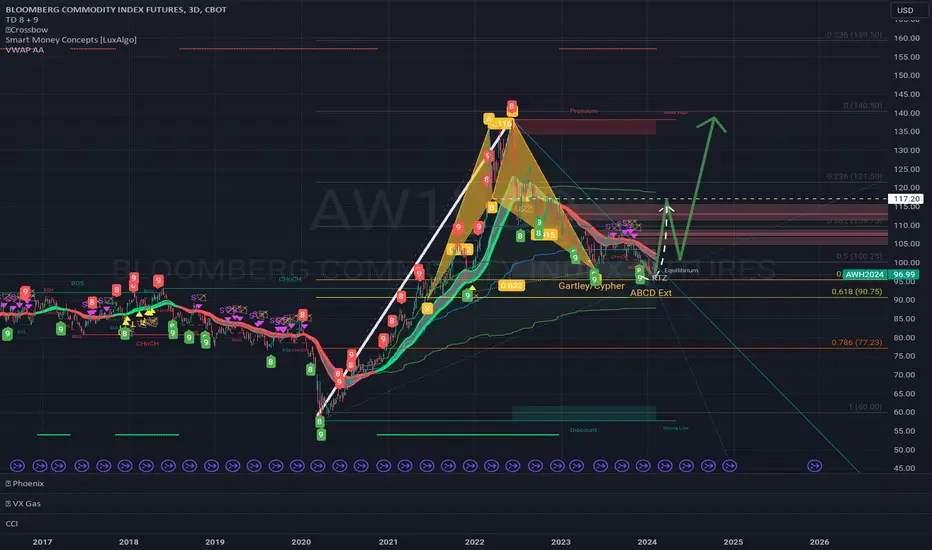
AW1 bull gartley near trendline breakoutaw1 3d bull gartley harmonic, coming off support, just broke downtrend line before rejection back to just above prev support. watching for another breakout higher with gartley pt at B level. This is also a large bull pennant on daily/weekly tf
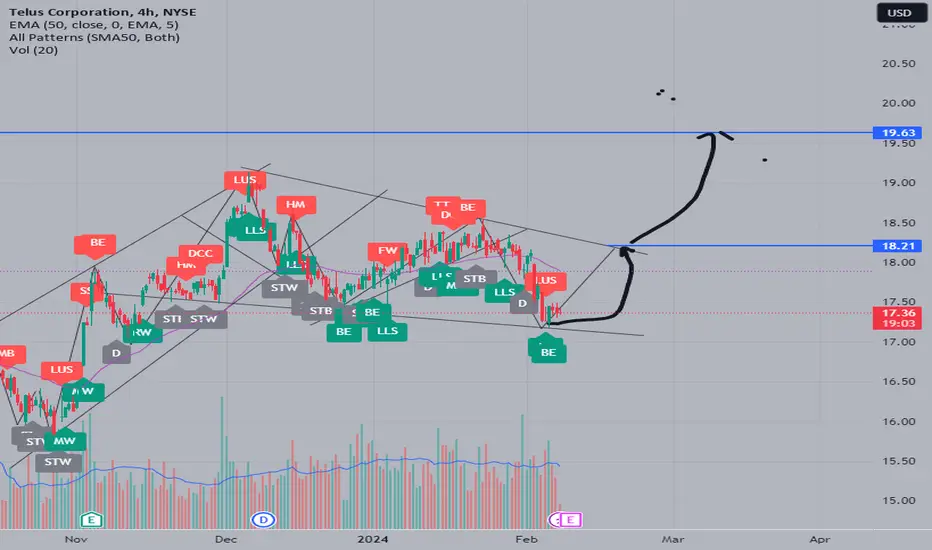
TU Telus corporation - BullishTU Telus corporation is selling at a discount right now. earning is on Friday. expecting a BEAT in profit , currently trading in Bull Flag pattern , looking for the bounce up above 18 then continuation to above 19.6USD, also RSI is near 30 on the daily chart.
PLUG - flagging at rest for continuation LONGPLUG on the 120 minute chart is resting on its trend up. Earnings are about 4 weeks ahead.
The uptrend has been solid. Two bull flag patterns are noted along the way. They follow
pops on the Relative Trend Index indicator also showing bullish buying volatility on the
Relative Volatility indicator. I see the rest ( consolidation) as a good point to add into my
ongoing long position for PLUG which recently got an upgrade and higher target by more than
one analyst. For a basic and simple trade, take the 3rd upper VWAP band at 6.35 as the target
the mean VWAP at 4 as the stop loss for a basic3:! R:r trade. For something better zoom into
a 15-30 minute time frame reset the anchored VWAP and fine tune.

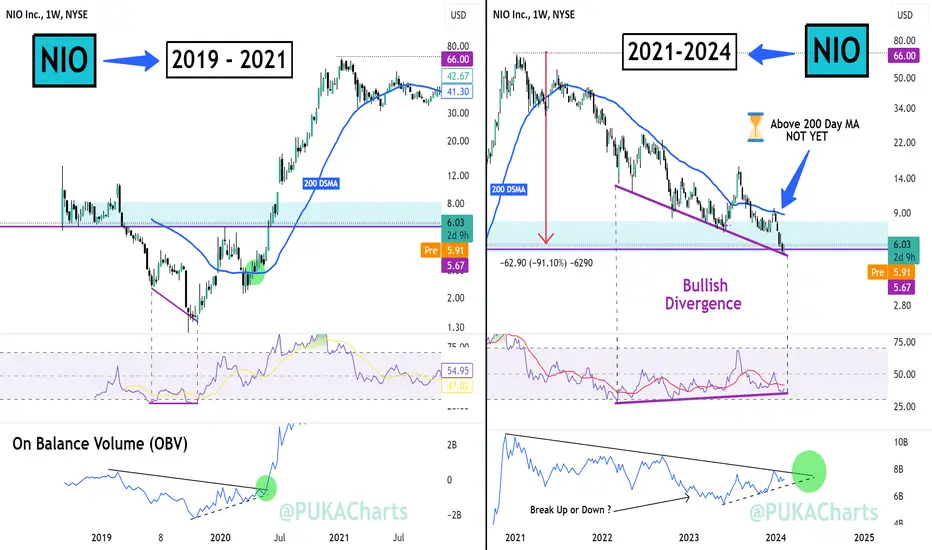
NIO - A Hidden Opportunity? NIO - NYSE:NIO
I have a feeling this will be an unpopular recommendation but the chart is telling there is an opportunity at hand to take a low risk trade.
▫️ NIO is 90% down from $66 ATH
▫️ MAX China FUD (contrarian senses tingling)
▫️ TA allows risk adjusted entry
The Chart
✅ RSI Bullish Divergence
⌛️ Potential green weekly reversal candle now
⌛️ Pending breakout from OBV pennant (coiling)
⌛️ Break above 200 Day (pending)
The chart has a similar pattern to the 2019-2021. Confirmation of the upward trend in 2019 was a break above the 200 day SMA and finding support on it (green circle), this also coincided with a break out of the coiling OBV in 2019 (green circle). These two signals are very useful as at present we are coiling within the OBV in similar fashion. A break out above the OBV resistance line in 2024 could infer the beginning of an upward move 👀
There may be a positive divergence in play here also which helps the bullish argument.
DOWNSIDE PROTECTION
If the OBV breaks to the downside losing the underside diagonal support, we exit the trade. We could watch for a loss of the lower RSI resistance line also but will likely occur in sync.
THE IDEAL ENTRY
Ultimately the best entry would once price finds support on the 200 day SMA. At present that's a close above c.$8.20. Worth noting that $8.20 is just above the Point of Control - the most traded price level in volume terms.
WHY ENTER NOW?
An initial small position can be placed now as we have had a 90% decline from ATH (a 90% discount for a long term investment isn't bad). We also have a positive RSI divergence and we have the OBV and RSI lower support levels to watch to exit to protect ourselves from the downside.
In the event we move higher, break out of OBV coil ,we can then add to the position, and if we break above the 200 MA and find support on it, we can add again. This allows for a low risk initial entry and as the trade moves in our favor we can add to the position as the conviction builds. We will either be quickly stopped out and lose very little or get in early entry with a 90% discount and get to play this long term investment position nicely.
Position size is key here folks, that first position is an amount your don't really care about as we do not have any confirmation of a trend change yet. This is early doors.
PUKA

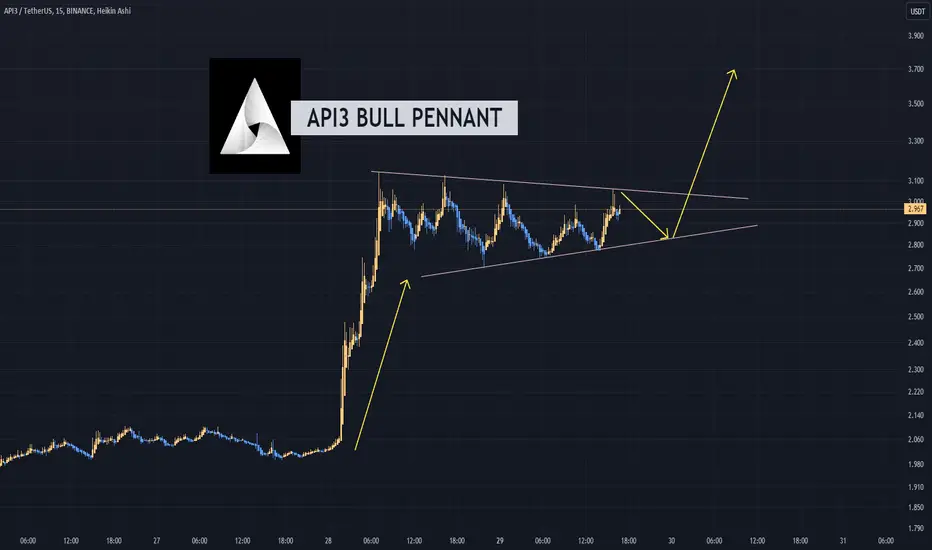
API3 BULLISH PENNANT PATTERNThroughout this week, BINANCE:API3USDT had a gain of more than 50% in a span of two days as of this writing.
Currently, the coin is moving sideways after a major bullish move and is expected that the price will consolidate and wait for a possible bullish pattern- true enough we saw a bullish pennant.
I will update my chart analysis for API3 in the chart on the idea threads below. Happy trading!
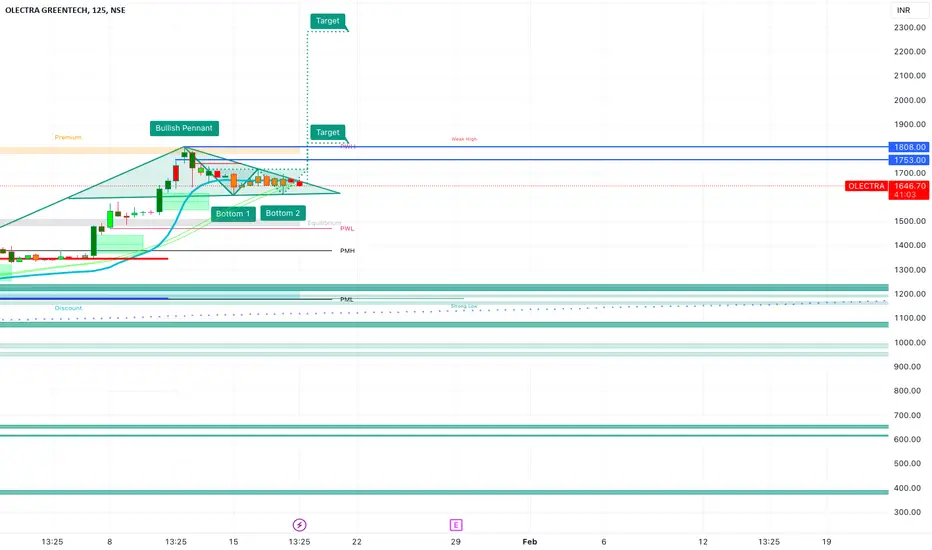
Bullish Pennant & W patternOlectra is forming Bullish Pennant, double bottom in pennant, if it completes the formation, then it moves above 1800
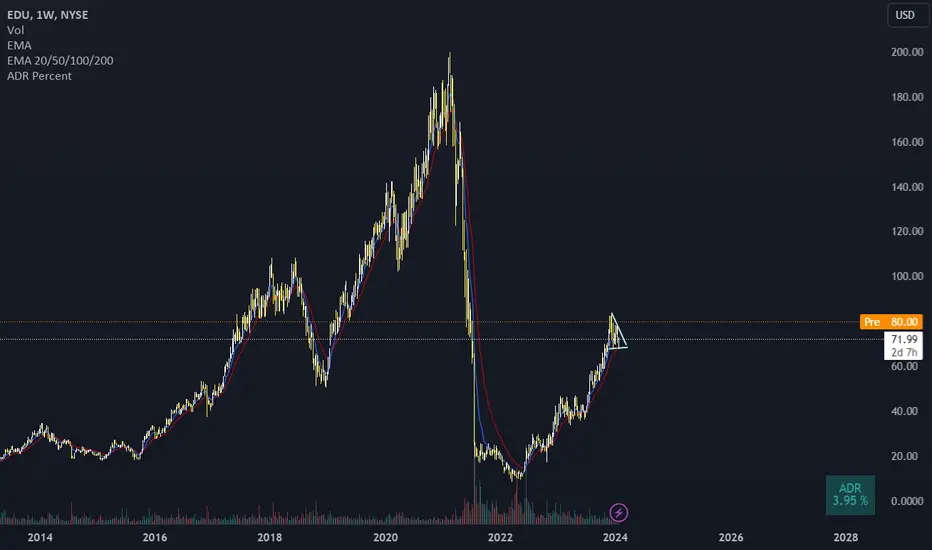
EDU - New Oriental Education & Technology Group - BreakoutCompany info:
New Oriental Education & Technology Group, Inc. offers educational services. The Company offers foreign language training, test preparation courses for admissions and assessment tests in the United States, the PRC and Commonwealth countries.
Earnings:
Earnings came out very strong this morning.
Revenue came in 869.60 and the street has looking around 814.
Earnings beat as well (surprise by 0.03).
Technicals:
The chart is breaking out of the pennant and with fundamental driver, this can be explosive.
Macro:
Overnight, there has been positive news out of China. PBOC lowered the reserve requirements by 50bps and there is growing expectation that stimulus is right around the corner, which should help Chinese stocks.
Will enter with the 5 min chart and update target along the way but initially run up to 100 looks promising.
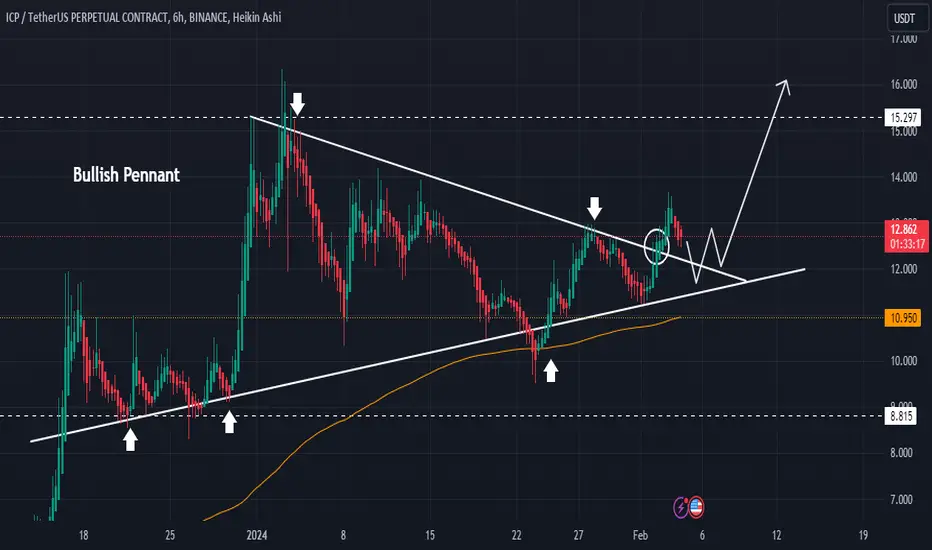
$ICP has broken out from a Bullish Pennant pattern.CP/USDT 🪙
CRYPTOCAP:ICP has broken out from a Bullish Pennant pattern, suggesting a potential 40-50% Price increase in the coming days.🎯🚀
You can enter at CMP & DCA at retest.
Or,
Also wait for the healthy retest for more clarity & confirmation.
Totally upto you.💯
Horizontal Support is at $8.80 &
Horizontal Resistance is at $15.30. 🎯✅
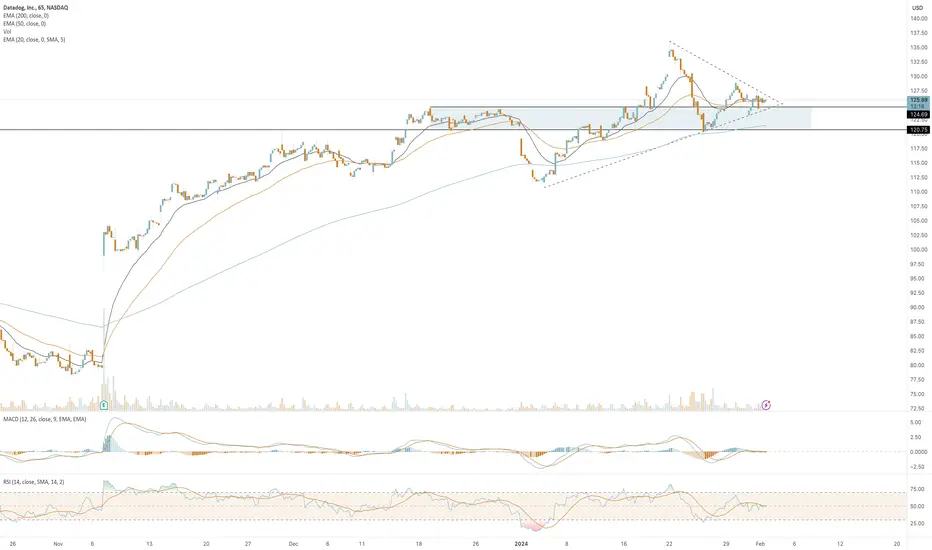
DDOG Ready to Make Another RunDDOG looking really attractive here. Came back down to test the support/resistance flip (blue area) and has been tightening in a pennant. Now resting on the 50 and 20 EMAs on the 65min. RSI right at 50 and looking to hold that and maintain strength.
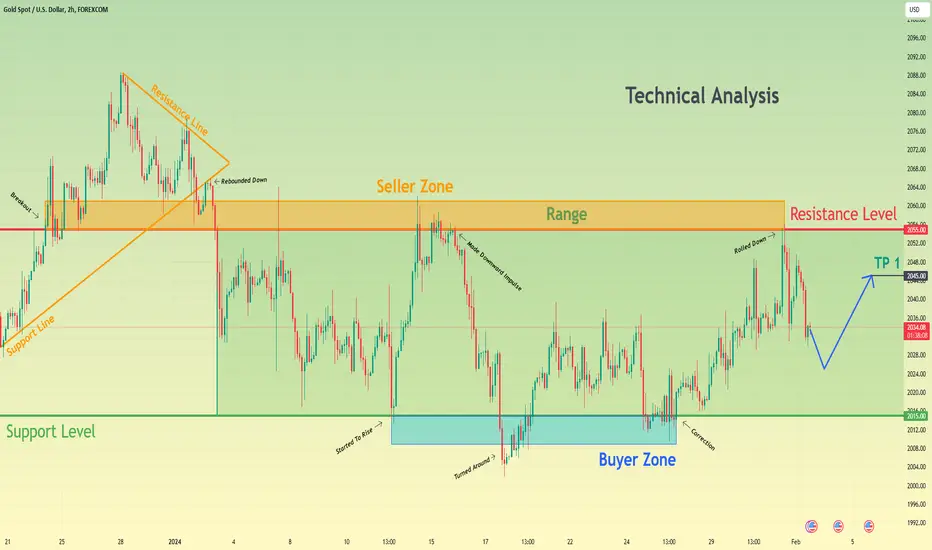
Gold can fall little more, turn around, and start to move upHello traders, I want share with you my opinion about Gold. Observing the chart, we can see that the price a not long time ago bounced from the support line and made an upward impulse to the resistance line of the pennant, thereby breaking the 2055 resistance level, which coincided with the seller zone. After this movement, Gold rebounded from the resistance line and started to decline to the resistance level, and after it fell, the price exited from the pennant pattern. Next, Gold broke the resistance level one more time and entered to range, where it declined to the 2015 support level, which coincided with the buyer zone with the bottom part. After this, the price started to rise and in a short time rose to the seller zone, but soon turned around and made a downward impulse lower even the buyer zone. Then price soon backed up to the range and some time traded near the support level, after which made a correction to this level and in a short time rose to the resistance level. But a not long time ago price rebounded from this level and started to fall. Now, I think Gold can decline to 2025 points, after which it turns around and starts to move up, therefore I set my target at the 2045 level. Please share this idea with your friends and click Boost 🚀
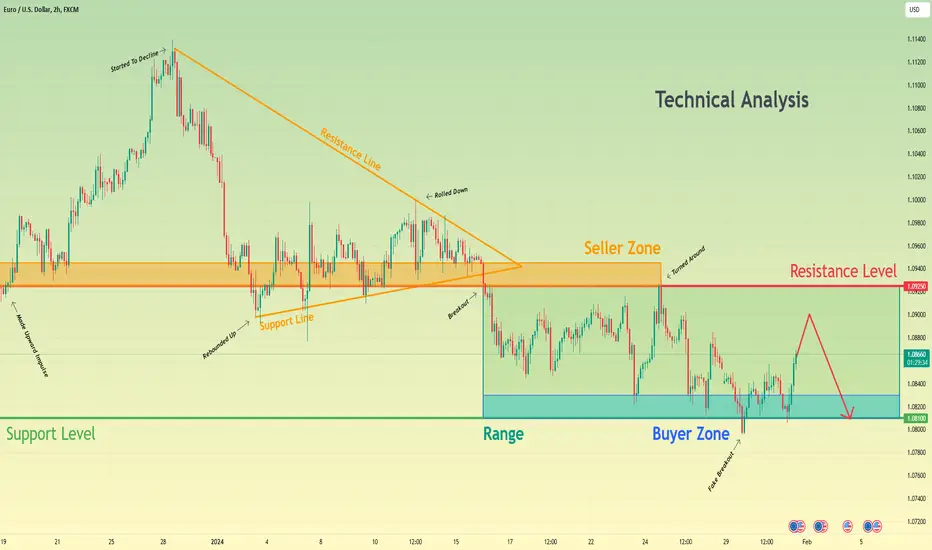
Euro can make small movement up and then start to declineHello traders, I want share with you my opinion about Euro. Looking at the chart, we can see how the price a few days ago made an upward impulse from the resistance level, which coincided with the seller zone to the resistance line of the pennant. After this, the price rebounded from the resistance line and started to decline inside the pennant, where in a short time it fell to the support line, thereby breaking the 1.0925 resistance level. Then, the price tried to back up and rose to the resistance line, but the EUR didn't fixed and soon bounced down to the buyer zone, thereby breaking finally resistance level. After this movement, the price started to trades inside the range, where in a short time price rose to the resistance level, and later turned around and declined lower support level, but recently it backed up to the range, making a fake breakout. At the moment, I think that the Euro can make a small movement up and then start to decline to the support level, which coincides with the bottom part of the range. So, that's why I set my target at the 1.0810 level. Please share this idea with your friends and click Boost 🚀
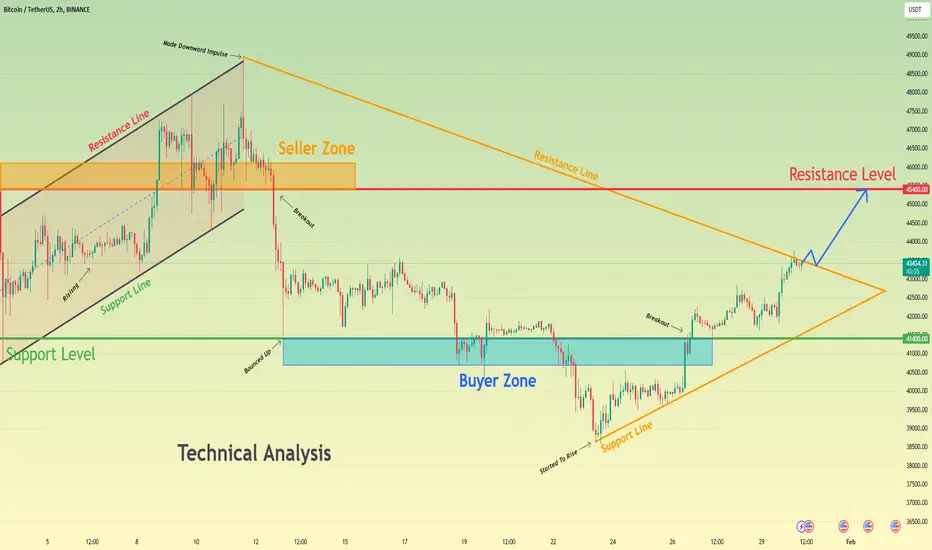
Bitcoin can exit from pennant and continue grow to 45400 levelHello traders, I want share with you my opinion about Bitcoin. By observing the chart, we can see that the price a few time ago declined to the 41400 support level, where it turned around and started to rise inside the upward channel. In the channel, BTC rose to a 45400 resistance level, which coincided with the seller zone and soon broke this level. Price rose a little higher, after which it exited from the channel, entered to pennant, and at once made a downward impulse from the resistance line to the support level, thereby breaking the 45400 level one more time. Next, BTC some time traded near the 41400 support level, and later it declined to support line of the pennant, breaking the support level, but soon price turned around and in a short time rose back. Also recently BTC rose to the resistance line of the pennant, where it continues to trades near now. So, in my mind, Bitcoin can break the resistance line, thereby exiting from the pennant, make a retest, and then rebound up to the resistance level, or after the breakout of the resistance line, BTC will at once continue to move up to the resistance level. For this reason, I set my target at the 45400 resistance level. Please share this idea with your friends and click Boost 🚀
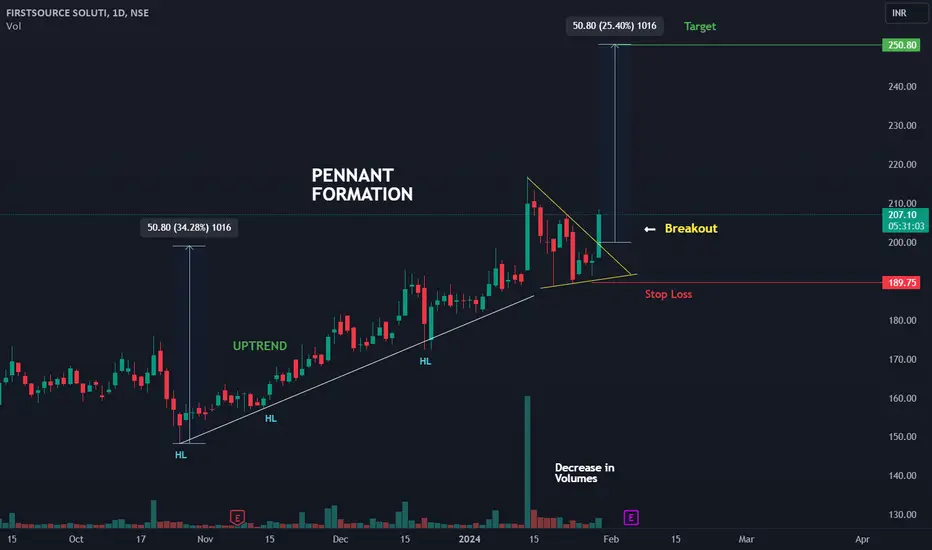
Follow-Up Analysis on FSL: Confirmation of Pennant BreakoutBuilding upon the analysis conducted yesterday, it is observed that NSE:FSL stock has successfully experienced a breakout upside from the Pennant pattern. Today's price action has confirmed the Pennant pattern breakout, signaling a continuation of the prevailing uptrend. The breakout is characterized by a decisive move above the upper trendline of the Pennant, validating the technical analysis shared in the previous report.
Target Projection:
The target for this trade can be estimated by measuring the height of the pole formed before the Pennant pattern. The pole is the strong, vertical price movement that precedes the consolidation phase. To calculate the target, this measured distance is then added to the breakout point.
To protect against adverse price movements, a strict stop-loss order should be implemented. The stop-loss level is determined based on the characteristics of the Pennant pattern and should be placed just below the lower trendline of the pattern.