Several price increase ideas for ARBUSDT with a bull flag patterThe combination of a bull flag pattern and a morning star candlestick cluster looks quite promising for a long ARBUSDT trade
Entry: 0.813$-0.82$
Tp: 10-30%
Stoploss: 0.779$
Pennant

Pennant formation on Maruti Suzuki INDPennant pattern formation in Maruti Suzuki Ind chart pattern after reaching it 52-week level and it has taken pullbacks now the market is about to break the high level.
Go long if trend line breaks, first target can be 52-week level high ~10580.00 level
Happy Trading. Cheers:)

Pennant - DXYPrice for USD is forming what looks to be a Pennant Chart Pattern!
Pennants are known to be Continuation patterns where price typically will break out the direction it was heading prior to entering the pattern! BUT everyone knows MARKETS CAN DO WHATEVER, WHENEVER!
DXY has been stretching up since July 14th! Lets see if the BULLS have what it takes to push further up out of this pattern OR if the BEARS are ready for the downslide!
*BE AWARE: Fundamentally USD has Building Permits (19th), FOMC (20th), Unemployment (21st) and PMI (22nd)

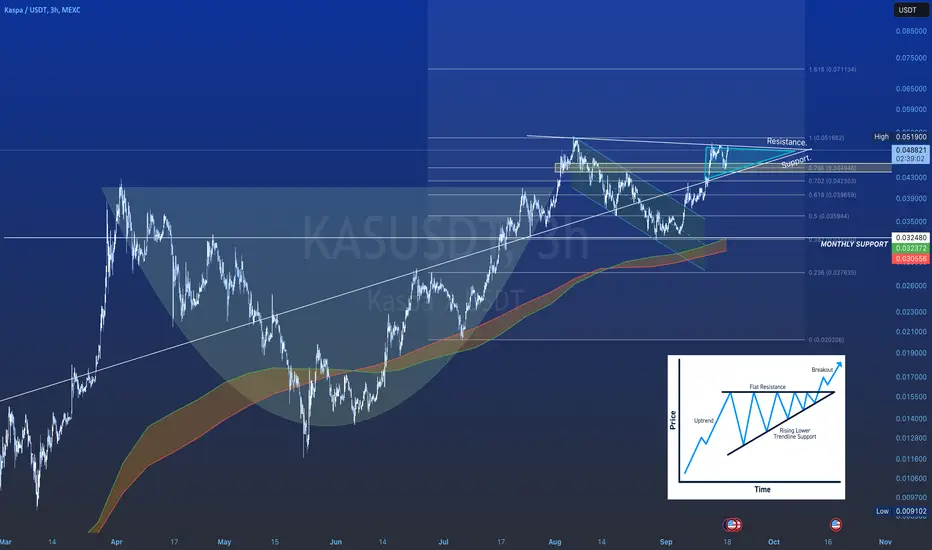
Ascending Triangle on KAS - BULLISHLooks like there's potential for KAS to form an ascending triangle here.
Could fill out the entire shape shown in this chart, or break out sooner than later.
My bias is that it doesn't get filled out completely, but we'll see...
Bitcoin can start decline to support level and try to break itHello traders, I want share with you my opinion about Bitcoin. Looking at the chart, we can see how the price fell firstly to the 25700 support level, which coincides with the buyer zone, at once bounced up, and some time traded nearly there. Also soon, the price declined to the buyer zone, and then it rebounded and made impulse up to the current resistance level, but soon rebounded down and in a short time declined back to the buyer zone. Later, BTC broke the 25700 support level and declined to the support line of the pennant, where it at once bounced and made a strong upward impulse higher than 25700 26450 levels, to the resistance line, but when it reached this line, Bitcoin rolled down below. After this, the price continued to rise and soon reached the 26450 level again, which coincided with the support area and even later broke it. As well, the price reached the resistance line again, but at once rebounded and made corrections to the support line, and then continued to move up. But a not long time ago, Bitcoin exited from the pennant, and at the moment it trades very close to the support area. In my mind, the price can start to decline to the support level and try to break it. After the breakout, the price can make a retest and then continue to fall, therefore I set up my target at the 26000 level. Please share this idea with your friends and click Boost 🚀

TESLA next bull run analysis you have to see.Telsa after long bearish trend pushing prices with higher high and higher low patterns indicating a near bull run scenario to be take place.
the convergence from point 2 to point 5 can act as bullish reversal and can push price to 1k USD or even more upside probably making tesla a multi bagger stock.
As fundamentals are strong and TA giving green signal you can invest in a SIP manner or one can start invest for long term once the raising wedge correction is finished .
best price for entries are from 200 ranges.
Thank you.

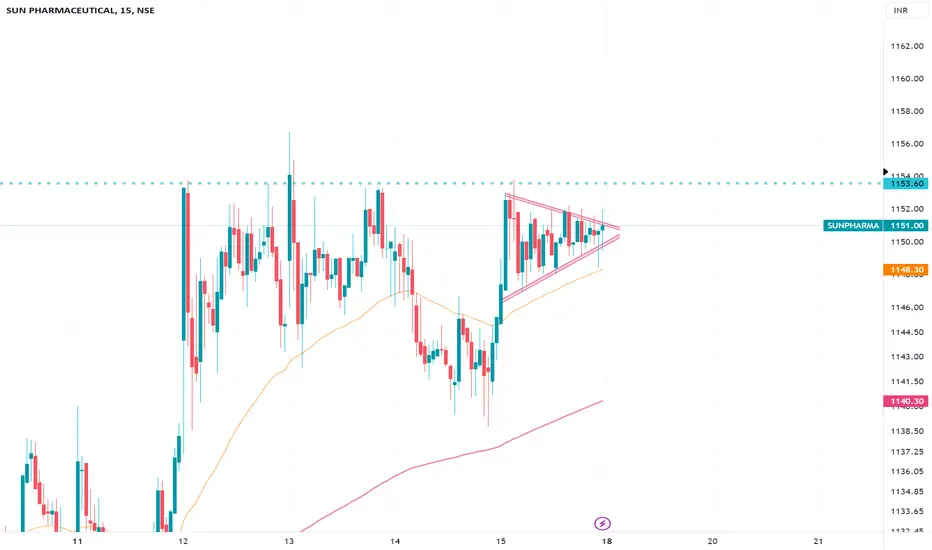
SUNPHARMA bullish pennant chart pattern formationbullish pennant pattern formed in 15 min timeframe in SUNPHARMA
Go long once 1153.60 level breaks which appears to be a good resistance level.
SL should be at ~1149.50 level
Your first target could be 1169.70 level (52-week high level)
Happy Trading :)
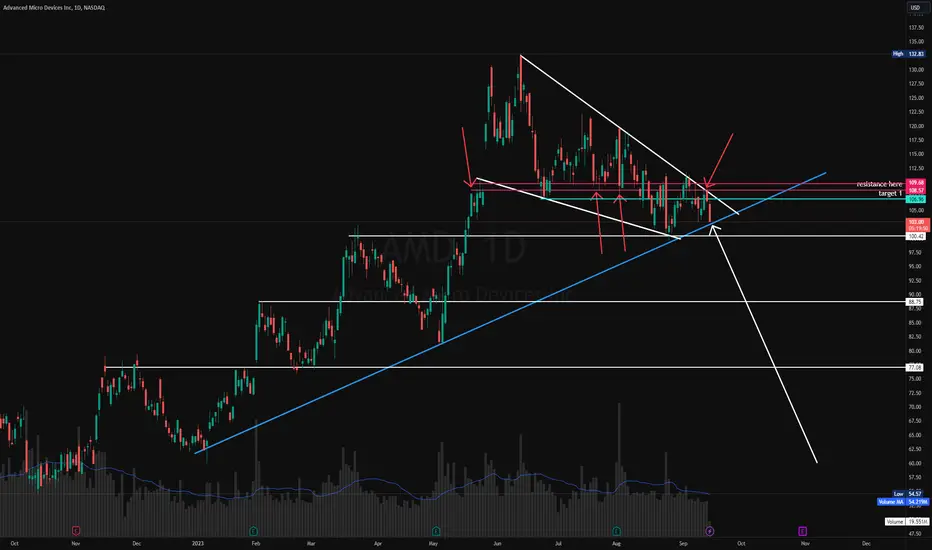
🔥 AMD filled gap to bottom of flag. Watch for bounce + breakoutAMD going to be explosive here if it bounces & confirms the flag.
Watch it close.
Always plan for dips, never add full position. NFA. Follow for more insights.
I called it out to drop from top of TL @ 108. See what happened.
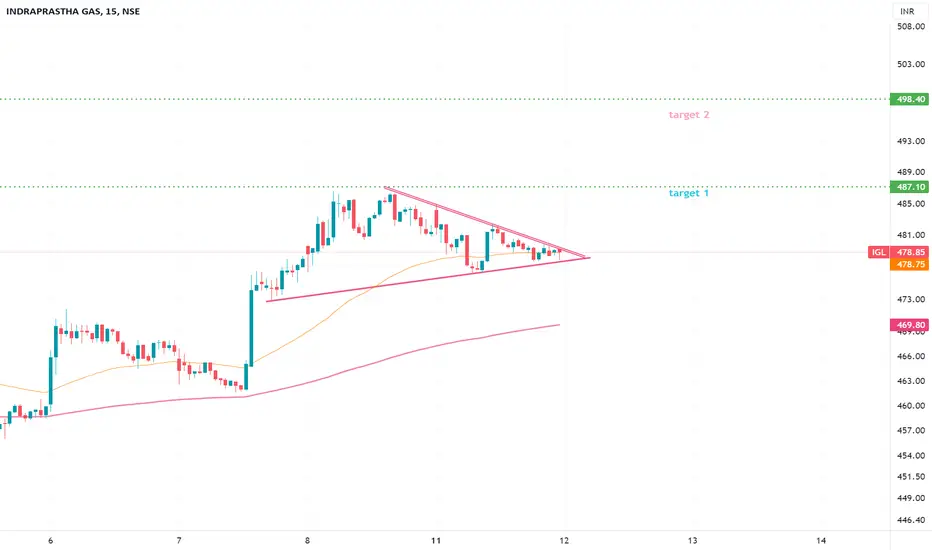
IGL - Bullish pennant chart pattern formation in 15 m timeframeBullish penant pattern seems to be formed in IGL price and price is near the trend line
Go long if the it breaks ou the upper channel of the pennant
First target - 487.10
Second target - 498.40
Happy Trading :)
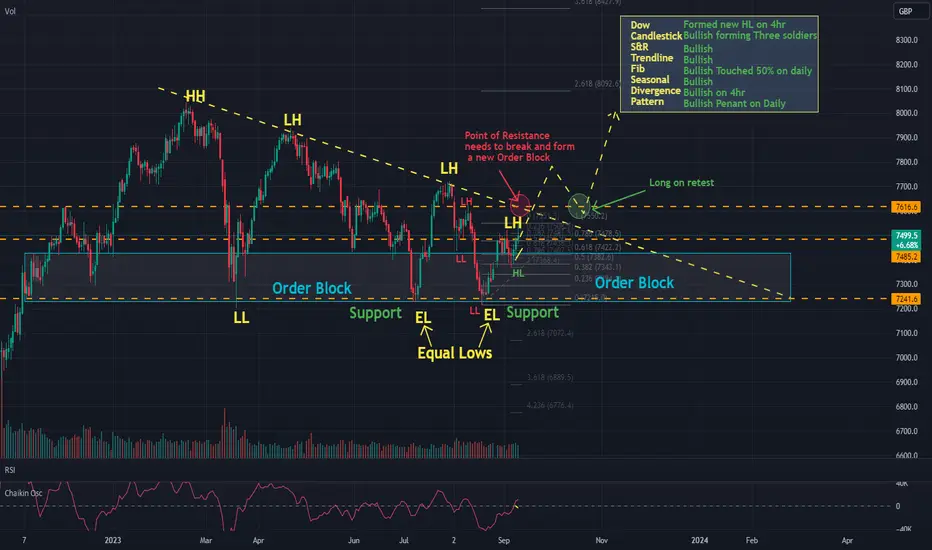
UK100 Bullish SeptemberDaily chart of UK100 is expected to Break up weekly resistance and trendline to follow a Bullish September Seasonal behaviour. Take Long positions after retest and new orderblock formation
Dow theory HHs HLs: Bullish
Candlestick Pattern : Bullish forming three soldiers
Support &Resistance: Orange line formed on Weekly chark
Trendline: Resistance approaching expected to breakup
Fibonacci: Bullish Touched 50% on daily
Seasonals: Bullish
Divergence: Bullish on 4hr
Pattern: Bullish Penant on Daily
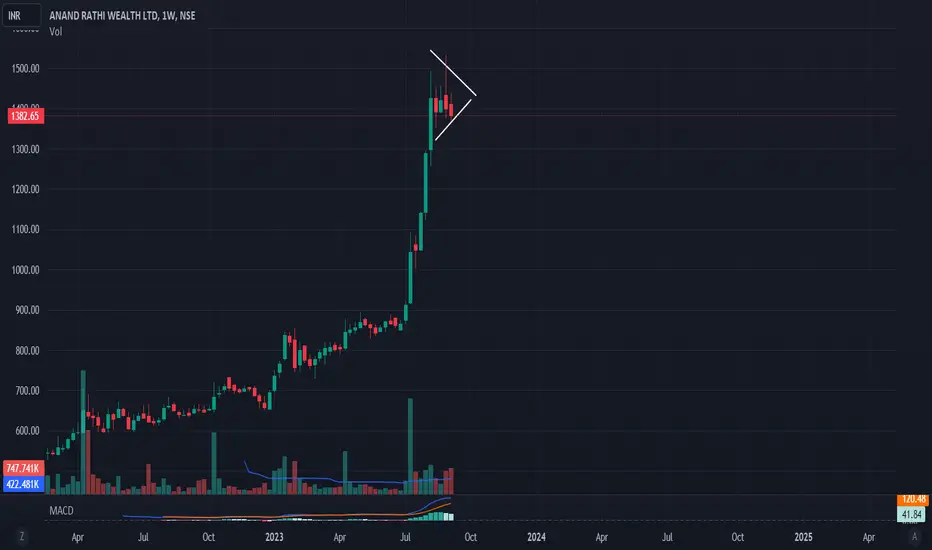
Bull Penant On Weekly ChartForming A Bull Pennant, can consider buying if breaks out, forming new highs

This setup looks like a shortBitcoin has formed a symmetrical triangle. Perhaps it is even a bearish pennant looking at the bar. In addition, triangles usually indicate a continuation of the trend and the diamond pattern under the lower edge also suggests this.
This is not financial advice.

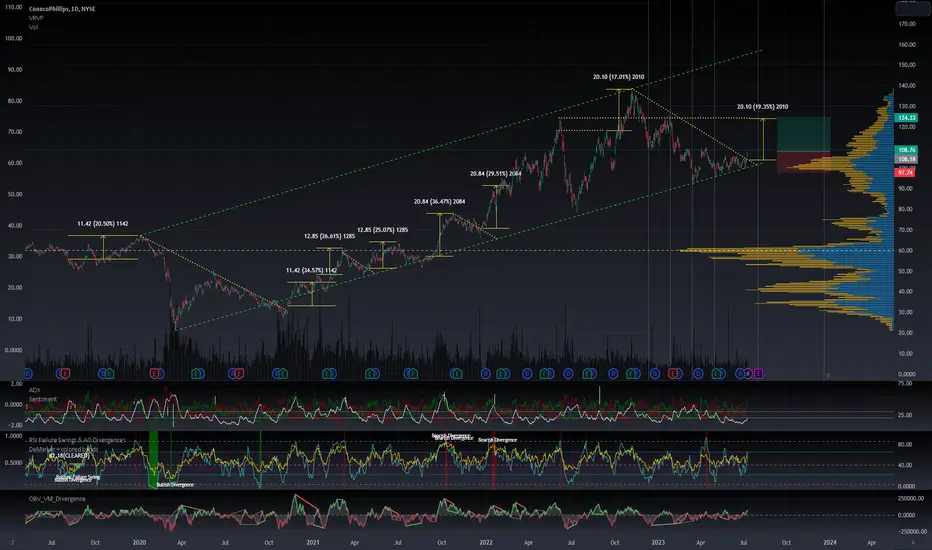
COP - excellent breakoutFollowing a five-month decline from its all-time high in November 2022, ConocoPhillips ( NYSE:COP ) has spent the subsequent five months consolidating within an area of value in its long-term upward channel, establishing strong volume support.
Historically, we've observed COP forming triangles and making measured movements on breakouts within this channel. If the breakout we're witnessing this week aligns with past price action, we could anticipate a new range extending as high as $124. It's worth noting that the analyst consensus 12-month price target stands at $130.
In a previous post, I mentioned that the gold/oil ratio relative to energy was signaling a bottom, which further confirms this opportunity with COP.
I'm already long on COP. My strategy involves additional accumulation between $108-110, profit-taking between $123-125, and setting a stop loss between $97-98. As always, it's crucial to monitor market trends and adjust strategies accordingly.
Bitcoin can rebound up, thereby breaking resistance levelHello traders, I want share with you my opinion about Euro. By observing the chart, we can see that the price a few days ago prices bounced up from the 25800 resistance level and started to trade inside the range. After the price reached the top part of the range, it started to decline and fell back to the 25800 level, where it some time traded near and then made a strong upward impulse to the resistance line of the pennant. Also, the price exited from the range, and then BTC rebounded from the resistance line and later made a downward impulse below the 25800 resistance level, which coincided with the buyer zone, thereby breaking it. Next, the price bounced from this line and rose higher than the resistance level, but recently it backed up below and now continues to trade very close to this level inside the buyer zone. In my mind, Bitcoin can exit from the pennant, break the resistance level, and make a retest. After retesting, the price can continue to rise. For this reason, I set up my target at the 26500 level. Please share this idea with your friends and click Boost 🚀

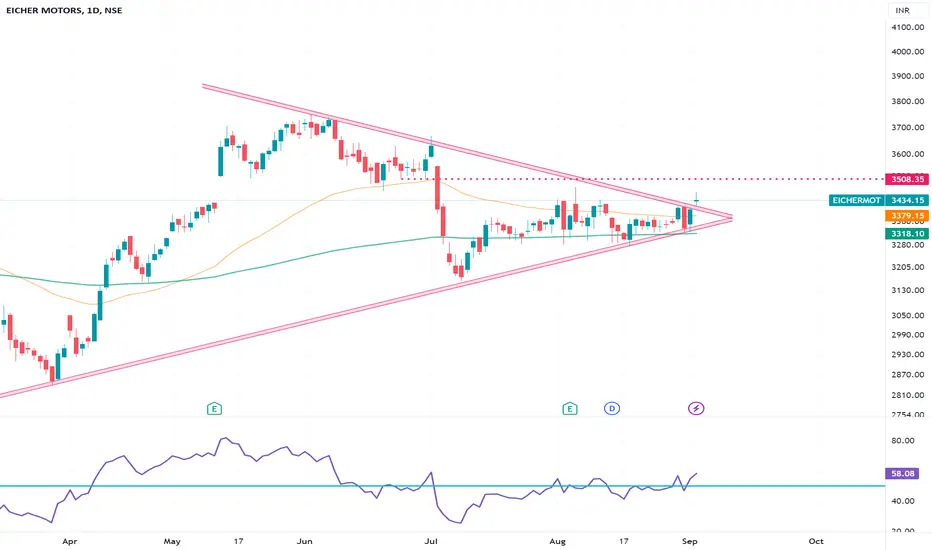
EICHERMOTORS breakout on symmetrical triangle in 1D timeframeEICHERMOTORS price action given break out on 1D timeframe with a DOJI candle.
Good trade for positional traders.
You can go long or wait for another candle to be formed.
Next target could be 3508.00
Happy trading :)
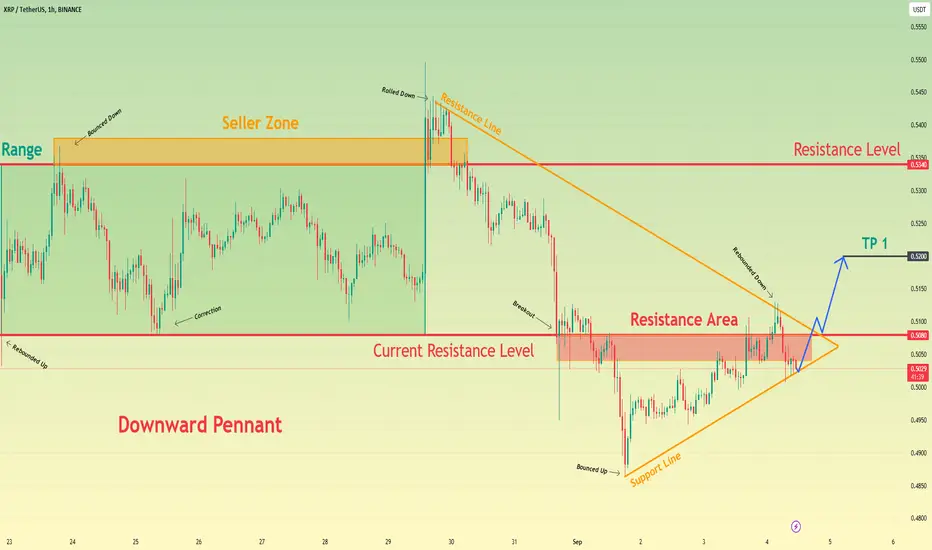
Ripple can rebound up from support line and exit of pennantHello traders, I want share with you my opinion about Ripple. Observing the chart, we can see that the price some days ago price rebounded from 0.5080 current resistance level and started to trade in a big range. Inside the range, the price made the correction and later rose to the 0.5340 resistance level, which coincided with the seller zone. After this price broke this level, thereby exiting from the range and reaching the resistance line of the pennant. Then Ripple rebounded from the resistance line and in a short time declined to the support line of the pennant, breaking 0.5340 and 0.5080 levels. Later price rebounded from the support line and rose to the resistance line, but recently it rolled back and now it trades very close to the resistance area. In my mind price can rebound up from the support line to the resistance line, which coincides with the resistance level, and try to break them. After the breakout, Ripple can make retest and continue to move up. For this reason, I set up my target at the 0.5200 level. Please share this idea with your friends and click Boost 🚀
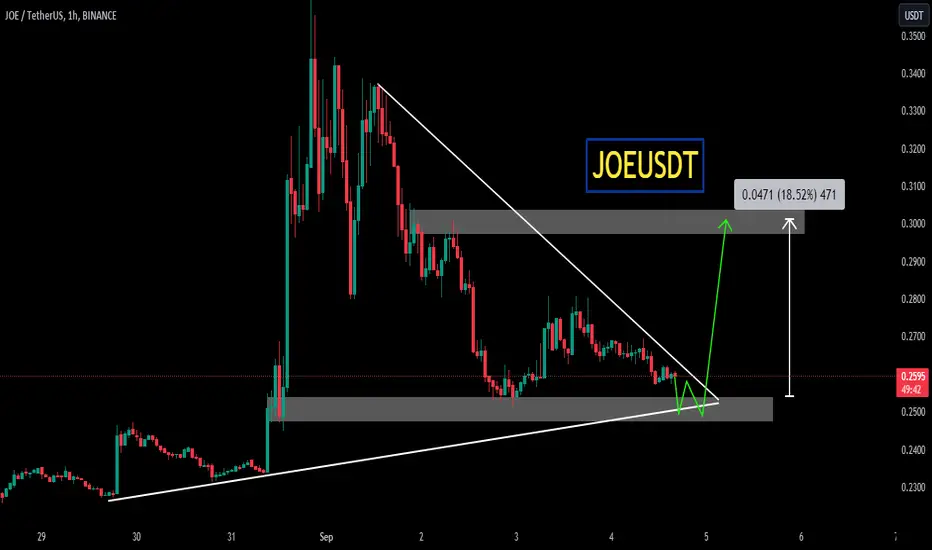
JOEUSDTJOEUSDT is trading in almost symmetrical triangle pattern. The price is reacting well the support and resistance of triangle.
Currently the price is at the support of triangle where it is also forming a local support zone and seems like the price may break through the triangle.
If the breakout sustain to upside the optimum target could be 0.3000.
What you guys think of this idea?
XSO.AX ~ Snapshot TA / ASX Small Ordinaries IndexChart mapping/analysis for ASX Small Ordinaries Index ASX:XSO
ASX Small Ords ETFs:
- ASX:MVS ASX:SSO ASX:ISO ASX:SMLL
Constituents (aggregate ETF holdings):
- ASX:ANN ASX:AUB ASX:BPT ASX:CNU ASX:CSR ASX:FLT ASX:ILU ASX:JBH ASX:LTR ASX:MTS ASX:NHC ASX:NSR ASX:ORA ASX:PME ASX:QUB ASX:SFR ASX:TLX ASX:VEA
CAPITALCOM:AU200 ASX:XJO

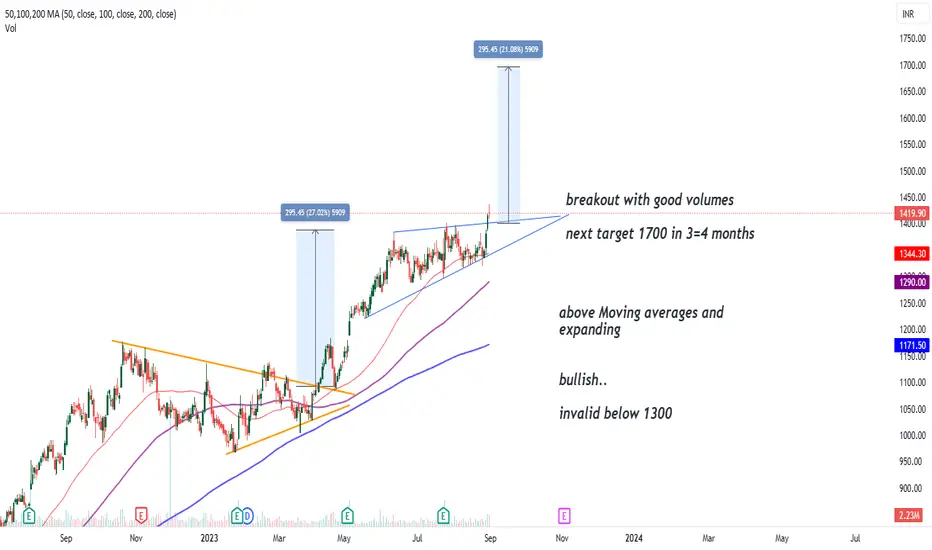
TVS motors bullish breakout analysisTVS broke out with 3 bullish candles and presently above support line
below 1300 setup is a fail...
next 4 months 1700 can be acheived
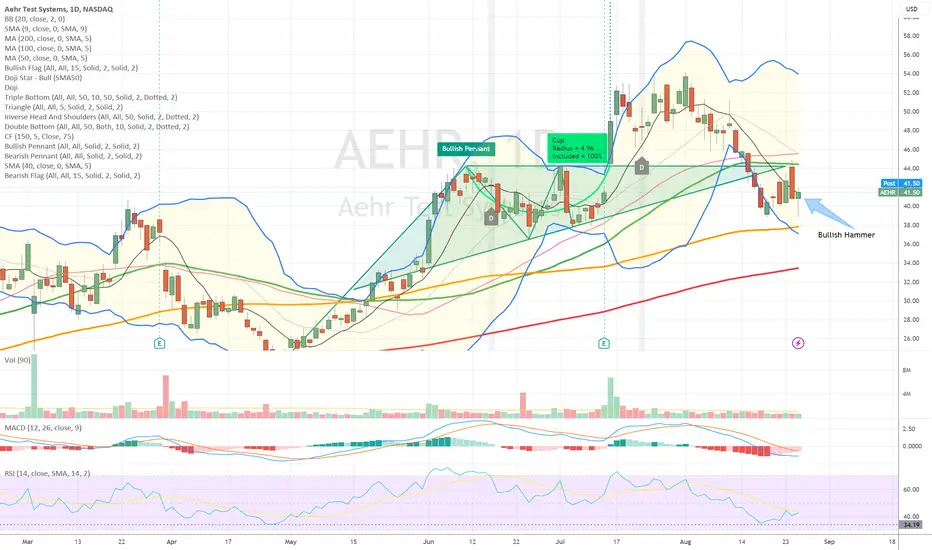
Bullish Hammer with PennantA bullish hammer appeared today after a significant correction. Waiting confirmation of a turnaround.
First price target is ~50, where it could hit with resistance as it re-tests the high.
My next PT is 65, as this turnaround could be the push needed to complete a bullish pennant pattern.
I'm hopeful to see $70 by the year end as they continue to roll out new offerings and pick up additional customers.
After exiting from pennant, Binance Coin can continue to growHello traders, I want share with you my opinion about Binance Coin. Observing the chart, we can see that the price a few days ago traded inside a big range, in which it some time declined to the 238 resistance level, which coincided with the resistance area, but at once rebounded to the top part of the range. After this BNB bounced and started to decline to the resistance level again, but this time price broke the 238 level and made a strong downward impulse below the 215 support level, thereby exiting from the range too. Then Binance Coin rolled up and tried to rise, but failed and declined lower to support line of pennant. Later, the price rebounded from the support line and rose to the resistance line, thereby breaking the support level, which coincide with the buyer zone. As well recently BNB exited from pennant and now trades near. Probably Binance Coin can decline to the support level, and then it can rebound from this level and continue to move up. For this reason, I set up my target at the 225 level. Please share this idea with your friends and click Boost 🚀

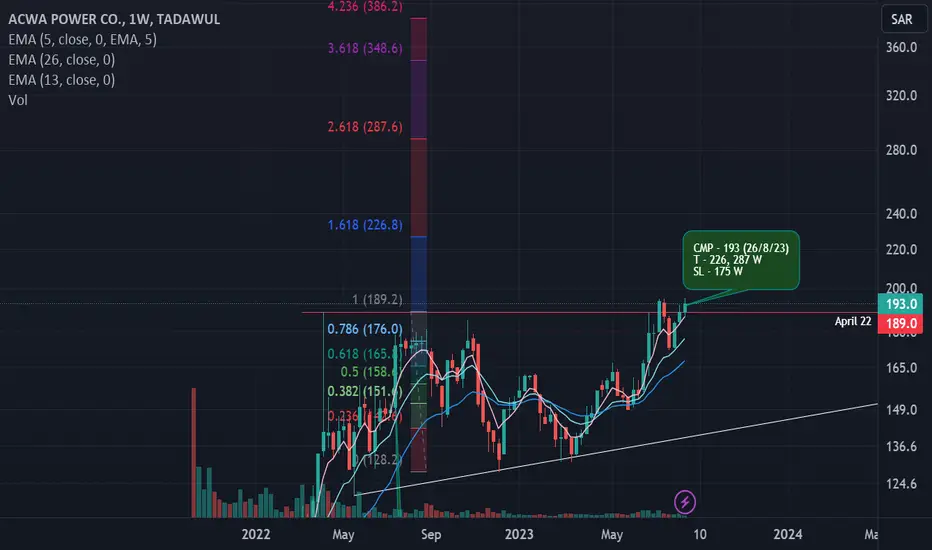
Chart of the week Acwa Power. Tadawul IndexThis stock came to my attention somewhere in April 22. Since then I was waiting for this stock to break high made on 3 April 22. 2 weeks before the stock gave closing above 189 then came down to test the support and last week again gave breakout. Now the stock looks like to give up move once again. The targets as per Fibonacci are as follows
CMP - 193 (26/8/23)
T - 226, 287 W
SL - 175 W