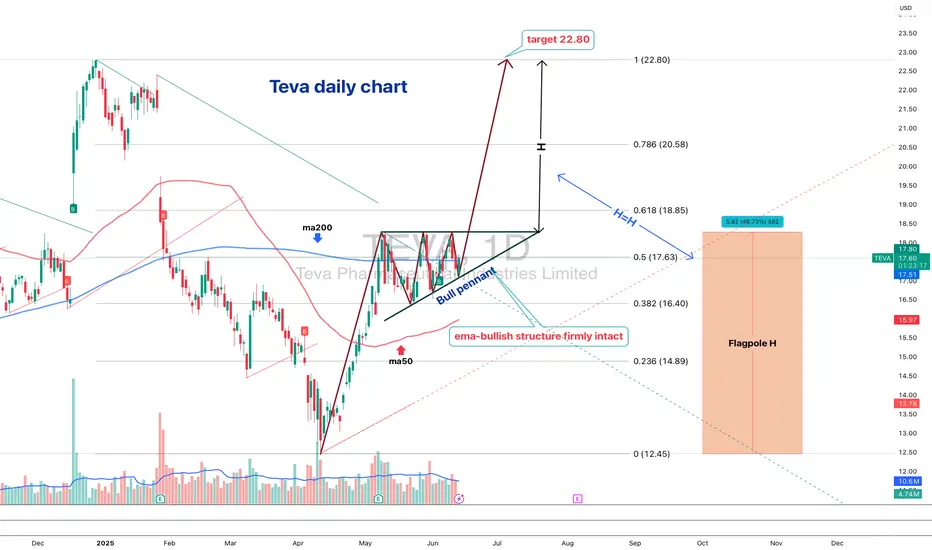
Teva: The flag’s ready — someone just needs to hit “launch”Teva Pharmaceutical (TEVA) is setting up for a potential continuation move after a clean impulse. On the daily chart, we have a textbook bull pennant — and not just any sloppy one. Price has broken above the 200-day moving average, and all key EMAs (50/100/200) now sit below price, confirming a solid bullish structure.
Volume behavior fits the script: declining inside the pennant, signaling pressure is building. More importantly, the Volume Profile reveals a low-volume void above current levels — meaning there’s little resistance until we hit the $22+ zone. In other words, once this breaks, it could run fast.
RSI is comfortably in bullish territory without being overheated, and the flagpole projection gives us clean upside targets:
– Entry: breakout above pennant resistance
– Target: $22.80 — full flagpole height
– Support: $17.60 — confluence of 0.5 Fib + volume base
TEVA isn’t asking for confirmation anymore — it’s showing it. All systems are technically armed. Now we just wait for the market to press the button.
Pennant
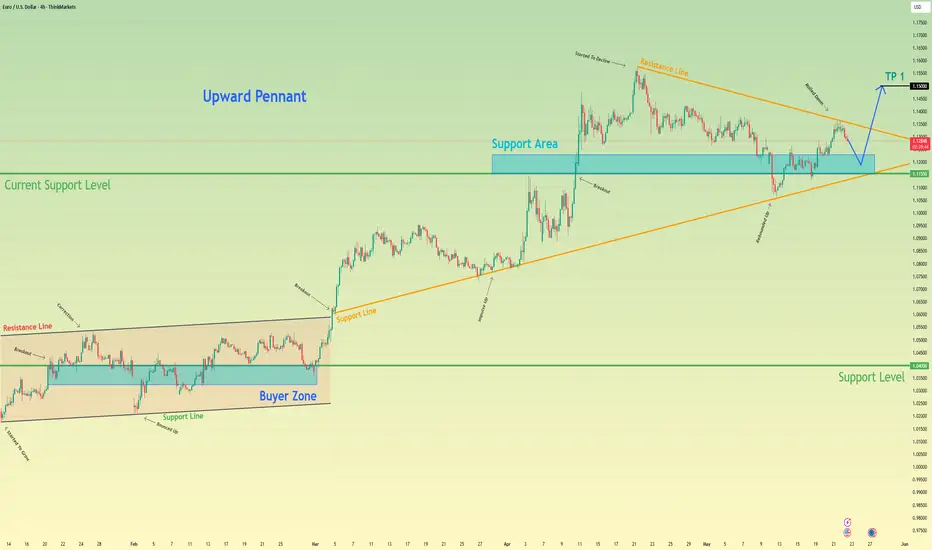
EURO - Price will exit from pennant and then make correctionHi guys, this is my overview for EURUSD, feel free to check it and write your feedback in comments👊
Some days ago price reached $1.0950 level and then made a correction movement, after which started to grow in a pennant.
Price made an upward impulse from support line of pennant and broke $1.0950 level, after which made a retest.
Then price continued to move up and reached $1.1300 level, and soon broke it too, and then made a correction movement.
After this, price rose to resistance line of pennant and then started to decline and soon broke $1.1300 level again.
But later it boucned from support line and backed up, and even now it trades very close to resistance line.
In my mind, Euro can rise a little, thereby exiting from pennant and then make a correction to $1.1300 level.
If this post is useful to you, you can support me with like/boost and advice in comments❤️
Disclaimer: As part of ThinkMarkets’ Influencer Program, I am sponsored to share and publish their charts in my analysis.
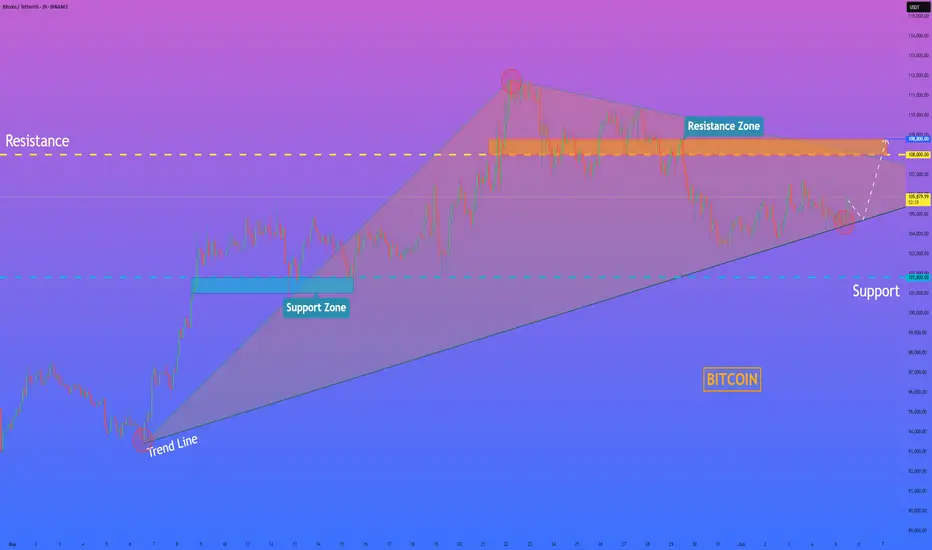
HelenP. I Bitcoin may grow to resistance zone from trend lineHi folks today I'm prepared for you Bitcoin analytics. This chart shows how the price declined to the trend line and then made an impulse up to the support level, which coincided with the support zone. Also, price started to trades inside a pennant, where it soon broke the support level and then traded some time near it. Later, it continued to grow and in a short time rose to the resistance level, which coincided with the resistance zone and broke this level as well. Then BTC reached the resistance line of the pennant, turned around, and dropped below the 108000 level, after which a few moments traded between this level. After this, price continued to fall and after it broke 108000 leve one more time, it dropped to the trend line, which is a support line of the pennant too. Price has traded near this line and recently BTC rebounded up. So, I expect that BTCUSDT will correct to the trend line and then rise to the resistance level. After this, I think the price may break it and enter to resistance zone. That's why I set my goal at 108800 points. If you like my analytics you may support me with your like/comment ❤️
ZIG ZAG PATTERN SILVER The time frame for above pattern to complete might take 1-3 months make your postion as per the time frame. Target green line Stoploss red line and silver will fly as per pattern can add now and in little dips later

The What vs. The Where - A 2nd Breakout Pattern After A Nice WinA few days ago we looked at a bullish breakout opportunity on Silver and it played out perfectly. After a lovely move to the upside, price has started to consolidate again providing us with a very similar setup.
HOWEVER, just as in the case of the first, we need to be aware that once again the WHAT doesn't necessarily align with the WHERE stopping this from being a Grade A trading opportunity.
Please leave any questions or comments below and remember to hit that LIKE button before you go!
Akil

Currently in Consolidation.
Closed at 276.91 (04-06-2025)
Currently in Consolidation.
Crossing 280 would make it more
bullish; but 315 - 317 is the immediate
resistance.
If this level is Crossed with Good Volumes,
we may witness 450+

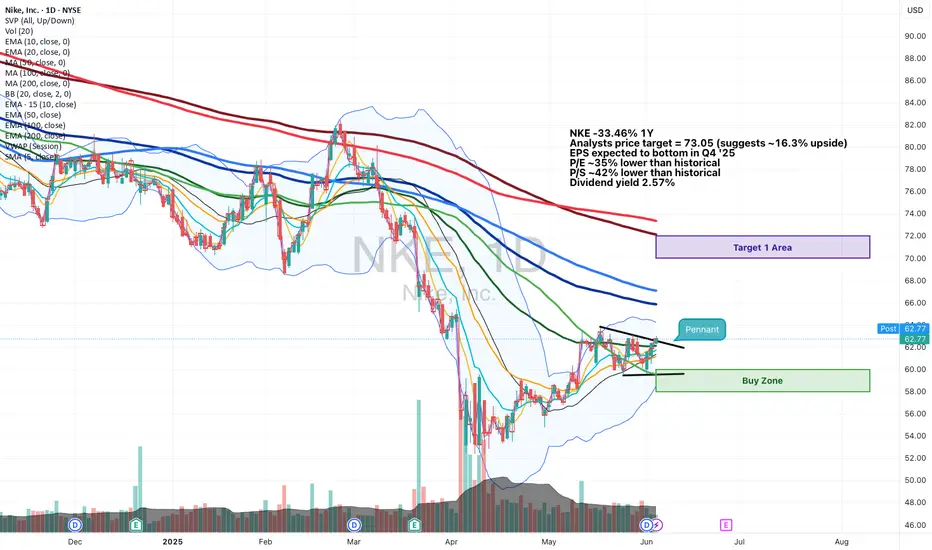
Nike (NKE) Long Term Buy - Pennant SetupNKE -33.46% 1Y
Analysts price target = 73.05 (suggests ~16.3% upside)
EPS expected to bottom in Q4 '25
P/E ~35% lower than historical
P/S ~42% lower than historical
Dividend yield 2.57%
Buy Zone = 58-60
Target 1 Area = 70-72
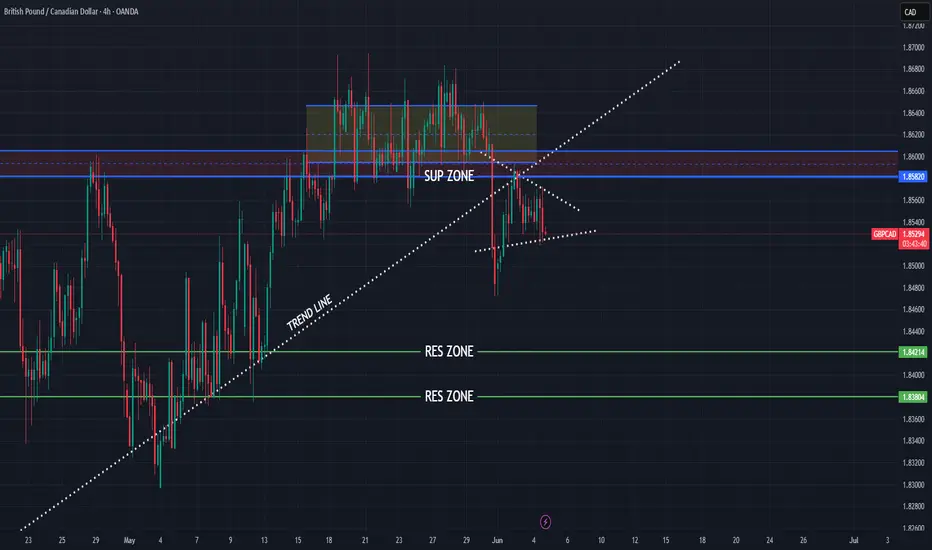
GBPCAD new bearish push expecting
OANDA:GBPCAD price break zone, currently in BEARISH PENNANT, after todays BOC event here for expect bearish push
SUP zone: 1.85800
RES zone: 1.84200, 1.83800
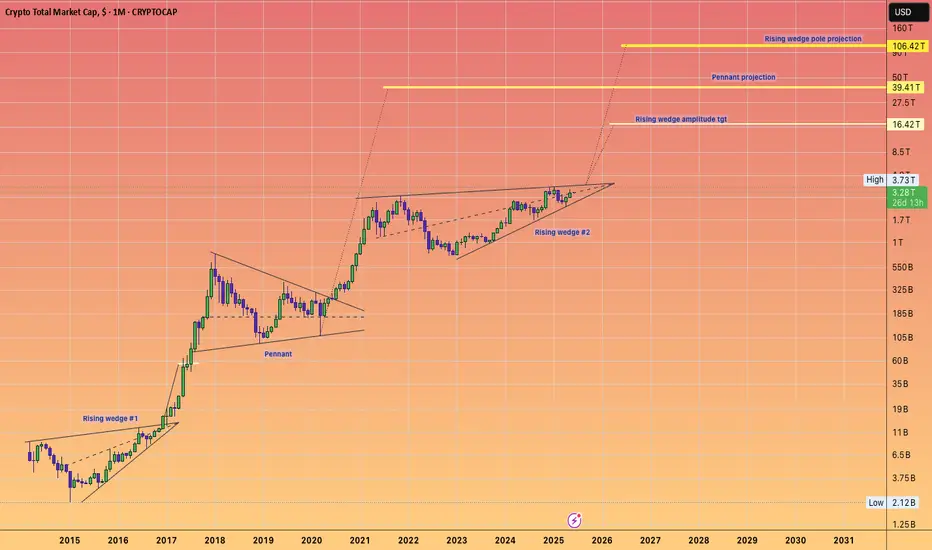
Raoul Pal's Big Banana. $100 Trillion dollars Crypto market.And how on earth do we reach that point?
Is Raoul's thesis regarding the exponential age accurate, suggesting we have until 2030 to invest and reap the benefits; so "don't F@ck this up!"
As a charting enthusiast, I am eager to see if there exists a technical foundation that could allow us to teleport to those levels and estimate how many years it might take.
Let's examine the entire crypto market, which includes everything from stable coins to tangible real world assets like Gold.
We can distinctly identify three significant consolidation patterns.
Rising wedge #1
a sideways pennant
rising pennant #2
Now, considering this is a logarithmic chart.
It provides us with logarithmic amplitudes and projections.
An amplitude is a calculated move based on the boundaries of the consolidation pattern.
Essentially, it involves taking the top and bottom width and applying it to the breakout point for a rising pattern.
In a #HVF, we utilise the midline of the funnel to forecast targets.
The projections illustrated on this chart pertain to the sideways pennant, employing the flagpole to establish our target.
It is this sideways pennant pole projection that leads us to 100 trillion dollars and beyond. Test it out for yourself if you find it hard to believe these figures could become a reality :)
So there we have it; yes, 100 trillion dollars may appear excessively optimistic and fantastical, especially since we are currently at 3.28 trillion dollars.
However, the charts indicate that Crypto could indeed be the sector where the majority of financial transactions take place in the forthcoming exponential future.
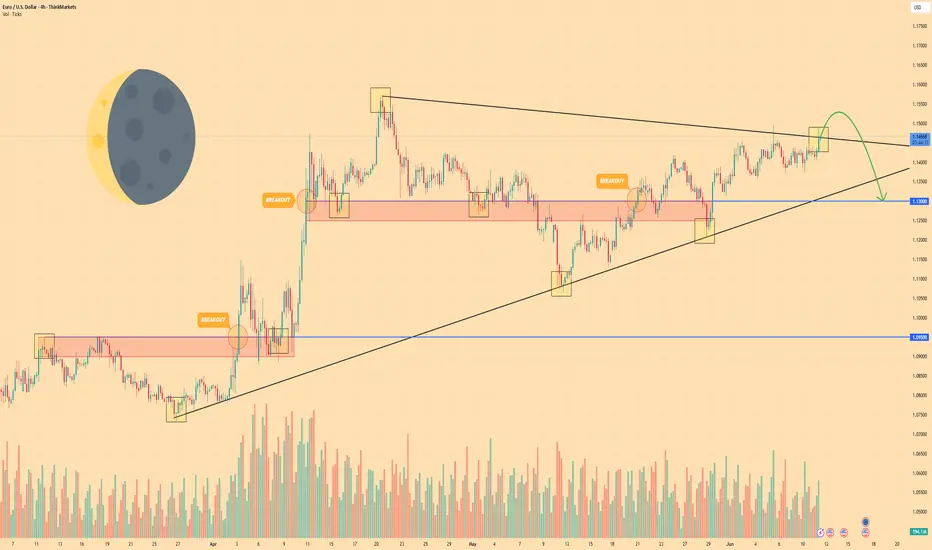
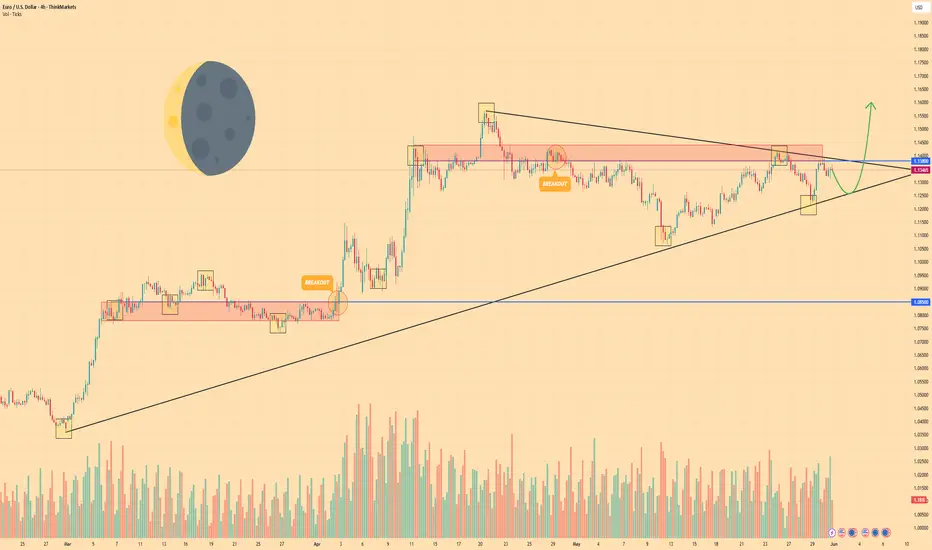
EURO - Price can boucne up of pennant, breaking resistance levelHi guys, this is my overview for EURUSD, feel free to check it and write your feedback in comments👊
Some time ago, price entered to pennant pattern, where it at once bounced up from support line and reached $1.0850 level.
Next, it broke this level and continued to grow to resistance level, and when Euro reached it, price broke it.
But, after price reached resistance line of pennant, it started to decline and soon broke $1.1380 level one more time.
Price fell to support line of pennant and then turned around and, in a short time rose to resistance area.
After this, price fell to support line of pennant, but recently started to grow and now trades near resistance level.
I believe Euro can correct slightly and then launch upward toward $1.1600, breaking resistance level.
If this post is useful to you, you can support me with like/boost and advice in comments❤️
Disclaimer: As part of ThinkMarkets’ Influencer Program, I am sponsored to share and publish their charts in my analysis.
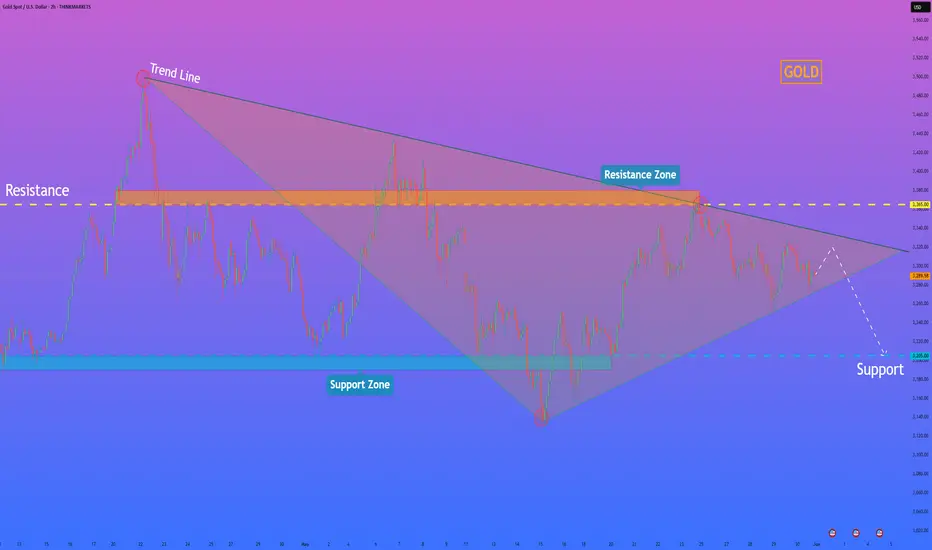
HelenP. I Gold will drop to support level from pennant patternHi folks today I'm prepared for you Gold analytics. The chart started with a strong impulse move upward from the support zone around 3190 - 3205, where buyers stepped in and pushed the price aggressively higher. This bullish momentum continued until the price reached the trend line, which had previously acted as a dynamic resistance. Upon contact with the trend line, the market lost strength and began to compress into a narrowing formation, a classic downward pennant. Within this pennant, the price made several lower highs, suggesting waning bullish power and the buildup of pressure inside a tightening range. Sellers became more active near the resistance zone around 3365 - 3380, and each upward attempt was quickly absorbed. Now the structure shows signs of a potential breakout to the downside. Given this formation and the current price behavior near the upper edge of the pennant, I expect a minor upward movement followed by a sharp breakdown. My goal lies at the 3205 support level, where previous demand emerged. That’s why I remain bearish and see this level as a realistic goal for the next move. If you like my analytics you may support me with your like/comment ❤️
Disclaimer: As part of ThinkMarkets’ Influencer Program, I am sponsored to share and publish their charts in my analysis.
Small Clues In A Big Breakout PatternSilver has been consolidating as of late and if there's one thing we no about contraction is that it eventually leads to expansion aka a breakout.
The issue with this particular setup is that based on location of the pattern, there's no predetermined directional bias for the breakout.
Therefor, what we're doing today is looking for small clues that the market has provided to give us any type of edge in predicting a breakout one way or another and guess what. WE FOUND SOME!
If you have any questions or comments, please leave them below!
Akil

Euro can reach resistance line of pennant and then dropHello traders, I want share with you my opinion about Euro. The price of the Euro had been gradually declining, forming a series of lower highs and finding support around the 1.1070 - 1.1025 buyer zone. This pullback created the groundwork for a new structure to form as volatility narrowed and momentum shifted. After reaching a local bottom, the market rebounded and began constructing an upward pennant, a classic consolidation pattern that often precedes continuation or reversal, depending on breakout direction. Within this pennant, price respected both trendlines, each approach to the upper resistance was followed by a rejection, and each touch of the support line triggered a bounce. Now, the Euro is moving closer to the resistance line of the pennant once again. Given the overall structure, proximity to the 1.1415 resistance level, and prior reactions from the seller zone, I think the Euro can reach the top boundary and then continue to decline, potentially breaking below the pattern. That’s why I set my TP at 1.1150 points, targeting a move toward the support level and exit from the pennant. Please share this idea with your friends and click Boost 🚀
Disclaimer: As part of ThinkMarkets’ Influencer Program, I am sponsored to share and publish their charts in my analysis.

Bitcoin 4H Outlook: Dual Wyckoff Reaccumulation in Play⚙️ Technical Thesis:
We're currently witnessing the unfolding of two back-to-back Wyckoff reaccumulation structures on the 4H timeframe:
📦 Reaccumulation #1 (Left)
Structure: PSY → BC → AR → ST → Spring + Test → LPS → SOS
Bullish pennant formed after Spring, leading to a strong breakout
BC of this phase (105,821) now acts as a major upper resistance
📦 Reaccumulation #2 (Right)
Structure: BC → ST → UT → Shakeout → Minor Spring → SPRING (current)
Current price has tagged Spring at the convergence of:
Lower Bollinger Band ($105,174)
61.8% Fibonacci retracement ($105,915)
🧪 Market Internals
RSI: 38.31 → deeply oversold, aligned with a Spring phase
Volume: Fading on last leg down, hinting exhaustion
BBs:
Upper: $110,828
Basis: $108,006 (confluent with 55 SMA)
Lower: $105,174
200 SMA: $102,248 (macro support)
Pattern context: Another bullish flag is forming within the second structure
🎯 Trade Expectations (Pending Spring Test as Confirmation)
If this Spring holds:
🔄 LPS → Look for bullish reaction with increased volume
TP1: AR retest around $106,752
TP2: 55 SMA + BB Midline confluence at ~$108,000
TP3: Range target or previous BC level near $112,000–$113,000
A decisive break below $105,000 with RSI < 35 and rising volume would invalidate the Spring and shift focus to breakdown risk.
🔍 Wyckoff View
This is a classic Spring setup from a Wyckoff reaccumulation structure. Two sequential structures are visible, and the first structure’s BC now serves as the foundational support for the second. This kind of layered support builds conviction — but needs validation via LPS and SOS phases.
Yes the major trendline was broken, but we are now consolidation and reaccumulation for the next leg up, unless the pattern is invalidated.
🕹 No short setups active unless structural failure confirmed.
💬 Share your view: do you see this as a Spring or potential failure?
#BTCUSDT #Wyckoff #Reaccumulation #CryptoTrading #BitcoinAnalysis #TechnicalAnalysis #Spring #LPS

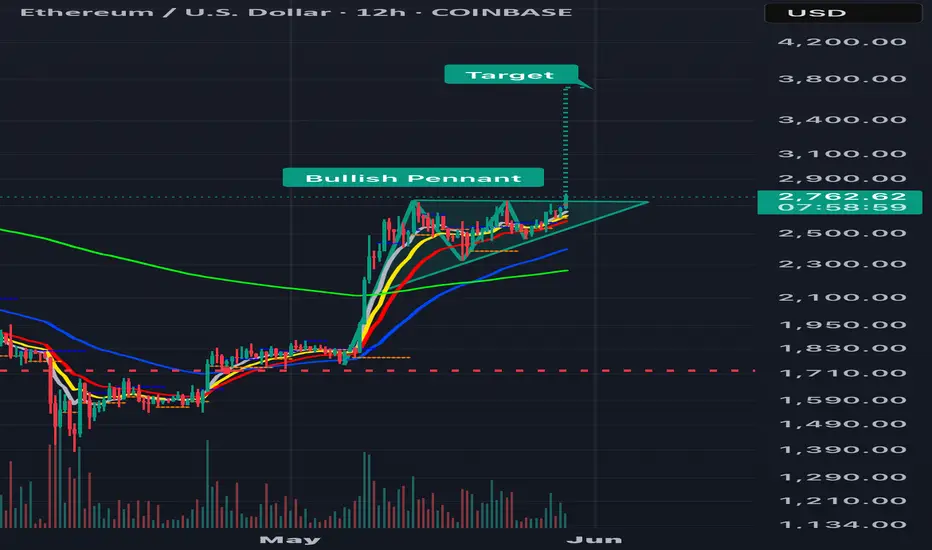
Eth bullish pennant. The Eth/usd 12hr chart is currently breaking out of a bullish pennant with a target into the mid 3ks. Of course false break outs are possible and caution should be exercised.
PNUTUSDT – Breakout Brewing from Bullish Pennant!PNUT Bullish pennant Formation – 200%+ Potential Incoming?! 👀🔥
Hey Traders! If you're all about high-conviction plays and real alpha, smash that 👍 and tap Follow for more setups that actually deliver!
PNUT is consolidating inside a bull pennant after a massive 200%+ rally earlier this month. Currently, it's sitting near the lower support zone, forming higher lows—a sign of growing pressure for an upside move.
🔍 Setup Highlights:
Bull Pennant forming
Strong bounce zone (green box)
Potential breakout path marked in projection
📌 Trade Idea:
Entry: $0.31–$0.28 support zone
Targets: $0.39 / $0.46 / $0.55 / $0.72
SL: Below $0.27
Leverage: 5x–10x (only for experienced traders)
Keep a close eye—once PNUT clears the triangle resistance, things could move fast.
What are your thoughts?

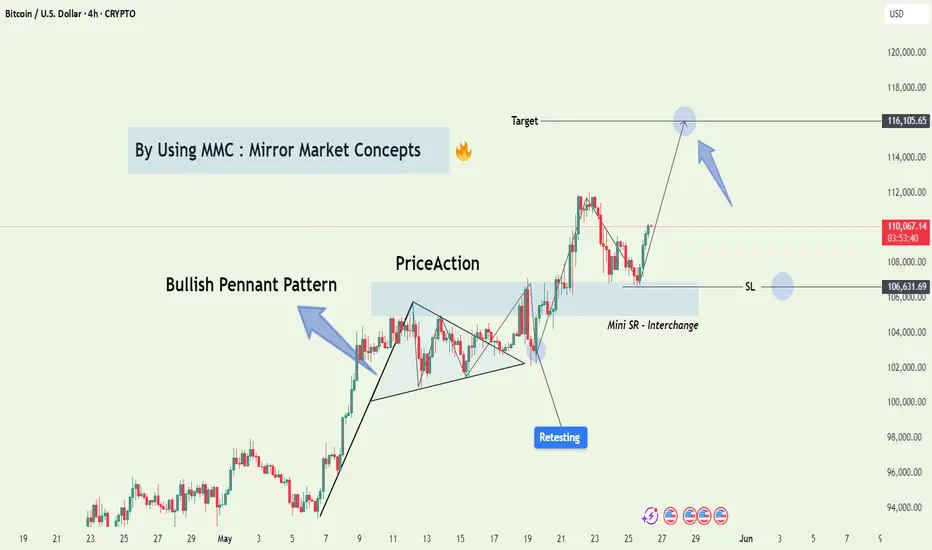
Bitcoin (BTC/USD) Bullish Breakout – Targeting $116K Using MMCBitcoin has printed one of the most powerful continuation setups in technical analysis — a Bullish Pennant — and it's playing out beautifully, backed by Mirror Market Concepts (MMC). Let's break down the structure, the reasoning behind this move, and how smart money could be driving this price action.
📈 1. Market Context – The Impulsive Rally That Set the Stage
The first thing to notice is the strong bullish move that occurred before the pennant started forming. This rally is important because a Bullish Pennant is a continuation pattern, and without a strong preceding trend, the pattern loses its credibility.
This initial move acts as the “pole” of the pennant — a clean, impulsive leg upward, driven by demand and momentum.
Such moves are often the result of strong buying from institutions, retail FOMO, or positive macroeconomic catalysts.
🧠 Psychology Insight: The rally injects confidence into the market. Buyers who missed the move now wait for a pullback, while early buyers prepare to scale in on continuation.
🔺 2. Bullish Pennant Structure – The Calm Before the Next Storm
After the bullish pole, the price enters a tight consolidation phase, forming a symmetrical triangle:
Lower highs and higher lows compress price into a pennant shape.
Volume usually declines during this phase, showing that the market is resting, not reversing.
The market is essentially "charging up" for the next big move.
💡 Why This Matters: The Pennant shows temporary equilibrium between buyers and sellers. A breakout typically signals which side wins — and in this case, buyers have taken control.
🪞 3. Mirror Market Concepts (MMC) – The Secret Weapon
This chart also showcases the power of MMC (Mirror Market Concepts), a strategy based on the idea that the market tends to reflect its previous behavior, structure, and reactions.
Here’s how MMC applies:
The price broke out of the pennant, then came back to retest the breakout area, just like it did during the previous breakout from the consolidation zone.
The Mini SR – Interchange zone acted as resistance before, and now it’s acting as support — a classic Support/Resistance flip (SR flip).
The retest behavior mirrors the earlier breakout structure, offering a confirmation that the market is following a familiar rhythm.
📊 Trading Logic: When a market behaves similarly at two different points in time, it’s often a signal of institutional activity — "smart money" repeating proven entry points and exits.
🔁 4. Retesting – The Entry Opportunity for Smart Traders
After the breakout from the pennant, price didn’t just shoot up — it pulled back to retest the broken structure. This is a high-conviction setup in technical trading:
✅ Retest confirms the breakout was valid (not a fakeout).
✅ It provides a safe entry point for traders who missed the initial impulse.
✅ Volume and bullish candle structure post-retest indicate buyer interest.
📌 The Mini SR – Interchange zone, around $106,631.69, acted as the perfect launchpad for the next bullish leg.
🎯 5. Trade Setup – High R:R Swing Opportunity
Let’s look at the exact setup this chart offers:
Entry: After the breakout and retest near $107K–$108K
Stop Loss (SL): Below the support zone at $106,631.69
Target (TP): At $116,105.65 — derived by projecting the height of the pole from the breakout zone
This gives an excellent reward-to-risk ratio, a key principle in sustainable trading.
🧠 6. Psychological Fuel – Why This Move Has Legs
Traders who missed the earlier rally are now watching closely for entries.
Retail traders are seeing confirmation.
Institutions may already be in from lower levels and are now defending support zones.
Sentiment is bullish post-retest, increasing volume and momentum.
It’s a self-fulfilling prophecy: as more traders recognize the pattern and the confluence, the trade becomes even more likely to play out.
🗓️ 7. What to Watch Next – Smart Risk Management
Even though the pattern looks strong, smart traders always remain cautious:
✅ Move SL to breakeven once price moves halfway toward the target.
🔄 Consider taking partial profits near interim resistance zones (like $112K).
📆 Stay alert for economic events or Bitcoin news that could cause sudden volatility.
📘 Conclusion: Bullish Setup with Proven Structure and MMC Confirmation
This BTC/USD chart is a textbook example of a Bullish Pennant breakout, with added strength from Mirror Market Concepts and a clean SR Flip retest. For swing traders and price action lovers, this setup offers a structured, strategic, and smart opportunity to ride the next wave of Bitcoin momentum.
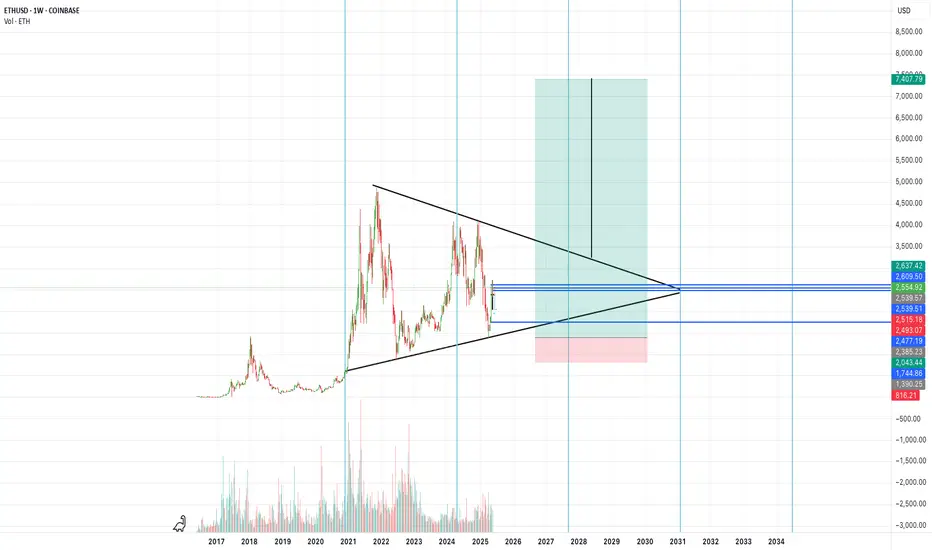
7400 ethOn the weekly timeframe we are hitting a huge symetrical triangle consolidation. 430% return if you got in at that last bottem. its not to latte but be careful entering in no mans land comment what you thing
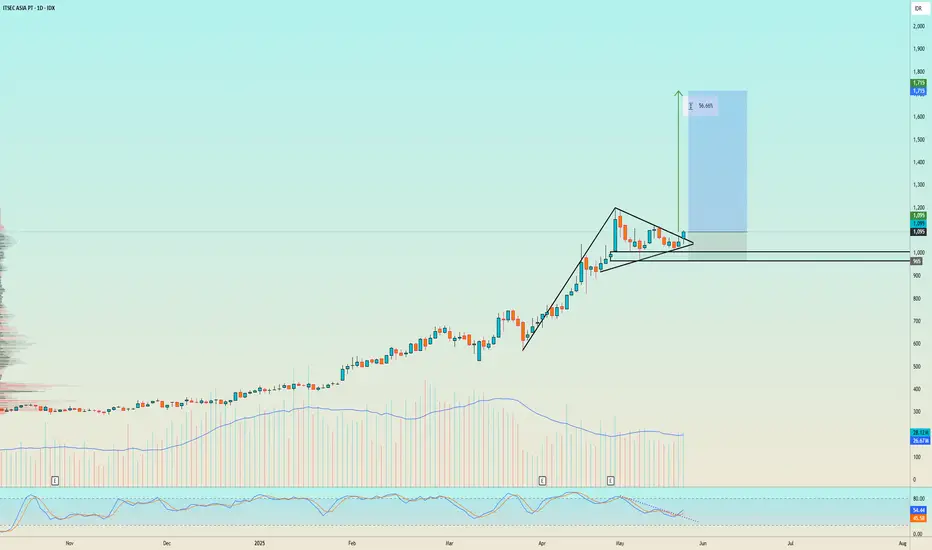
Ready for take off - CYBR1. Breakout Bullish Pattern with strong volume
2. Few times come and leave support area at 965-1005
3. Good Risk Reward Ratio 1:4
4. Good momentum with GC Stochastic
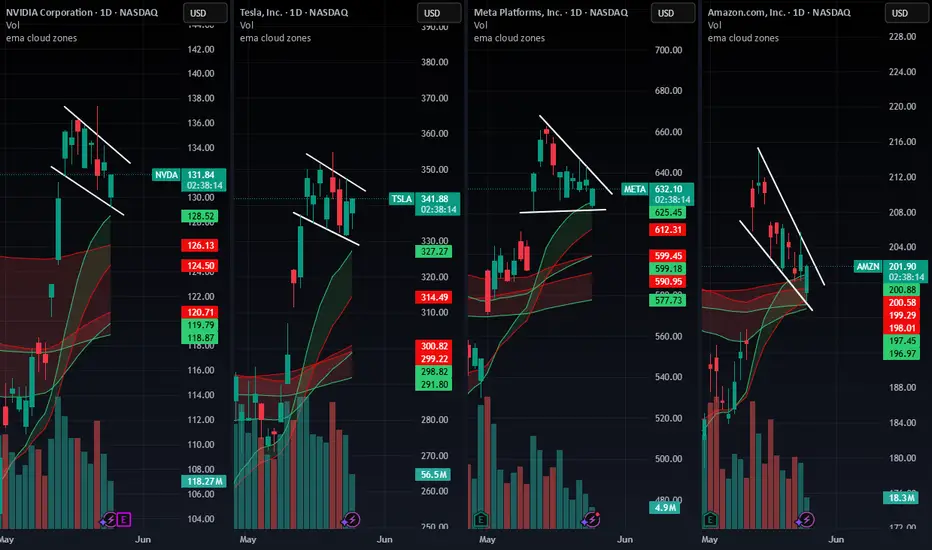
$NVDA $TSLA $META $AMZN – Triangle Squeeze Incoming?📊 Symmetrical triangle formations are building across these tech giants — and volatility is compressing.
🔍 What to watch:
📈 Breakout above upper trendline = bullish momentum
📉 Breakdown below lower trendline = bearish confirmation
📉 RSI on NASDAQ:NVDA is at 73.04 = overbought warning
⚠️ NASDAQ:NVDA earnings drop May 28, could be a trigger for resolution
These coils don’t last forever. Price is building pressure — and one strong candle could break the dam.
Stay sharp, and tighten your stops.
This is where risk management matters most.
👇 Which side are you betting on — breakout or breakdown?
Euro will start to grow from support and then leave pennantHello traders, I want share with you my opinion about Euro. Previously, price was moving confidently inside an upward channel, forming steady higher highs and higher lows. After a clear breakout from that structure, the price started consolidating inside a new pattern, an upward pennant. This formation usually appears as a continuation structure, where the market builds pressure before a new impulse. Currently, the price is trading near the middle of the pennant, after rolling down from the resistance line and rebounding up from the support area. The structure is compressing, and a retest of the support line near 1.1155 may occur before a breakout happens. Given the confluence of the pennant structure, the strong support area, and the previous bullish momentum, I expect the Euro to rebound again from the lower trend line and initiate an upward breakout. That’s why I set my TP 1 at the 1.1500 level, a logical target aligned with the upper boundary of the pattern and next key resistance. Please share this idea with your friends and click Boost 🚀
Disclaimer: As part of ThinkMarkets’ Influencer Program, I am sponsored to share and publish their charts in my analysis.
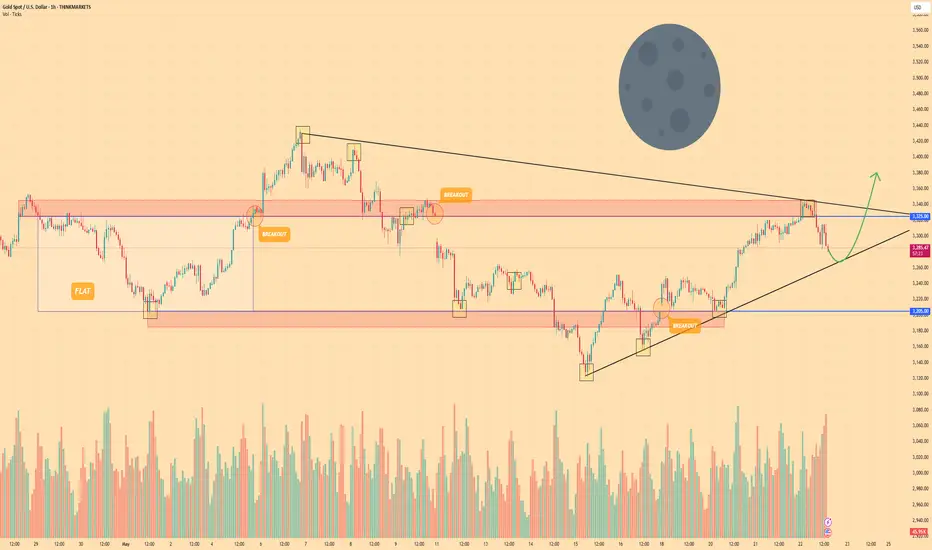
GOLD - Price can bounce up from pennant to $3380 pointsHi guys, this is my overview for GOLD, feel free to check it and write your feedback in comments👊
A few moments ago price reached resistance level, but then bounced and started to flat, breaking this level again.
In flat, price declined to support level, which coincided with support area, and then started to grow.
In a short time, Gold exited from flat, breaking $3325 level and then entered to pennant, where it started to fall.
Price soon broke $3325 level again and made a gap, after which dropped to support line of pennant, breaking $3205 level.
But then price quickly turned back, breaking $3205 level again and even reached resistance level, after which corrected.
Now I think that Gold can decline to support line of pennant and then bounce up to $3380, exiting from this pattern.
If this post is useful to you, you can support me with like/boost and advice in comments❤️
Disclaimer: As part of ThinkMarkets’ Influencer Program, I am sponsored to share and publish their charts in my analysis.
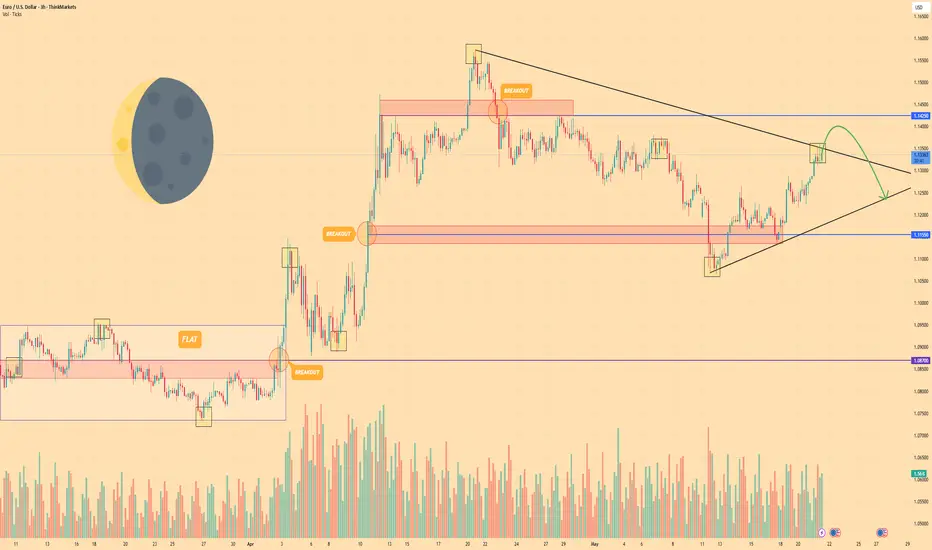
EURO - Price may make a movement up and then dropHi guys, this is my overview for EURUSD, feel free to check it and write your feedback in comments👊
A few days ago price traded between $1.0870 level inside a flat, where it after fell to bottom part and made an upward impulse.
Price exited from flat, breaking $1.0870 level too, and then made a correction, after which continued to grow.
Later, Euro reached $1.1425 level, breaking recently $1.1155 level recently, and soon price broke $1.1425 level too.
Next, price started to traded inside pennant, where it dropped from resistance line to support line, breaking $1.1425 level again.
Euro fell to support line, after which started to grow and in a short time, rose to resistance line.
Now, I think that Euro may make a movement up and then start to decline to $1.1235 support line of pennant.
If this post is useful to you, you can support me with like/boost and advice in comments❤️
Disclaimer: As part of ThinkMarkets’ Influencer Program, I am sponsored to share and publish their charts in my analysis.