descending triangledxy looks close to closing at a lower-low in this ongoing down-trend.
The last coffin nail was Nov 2022 when EMA30 was crossed. Everything else is noise.
Pennant

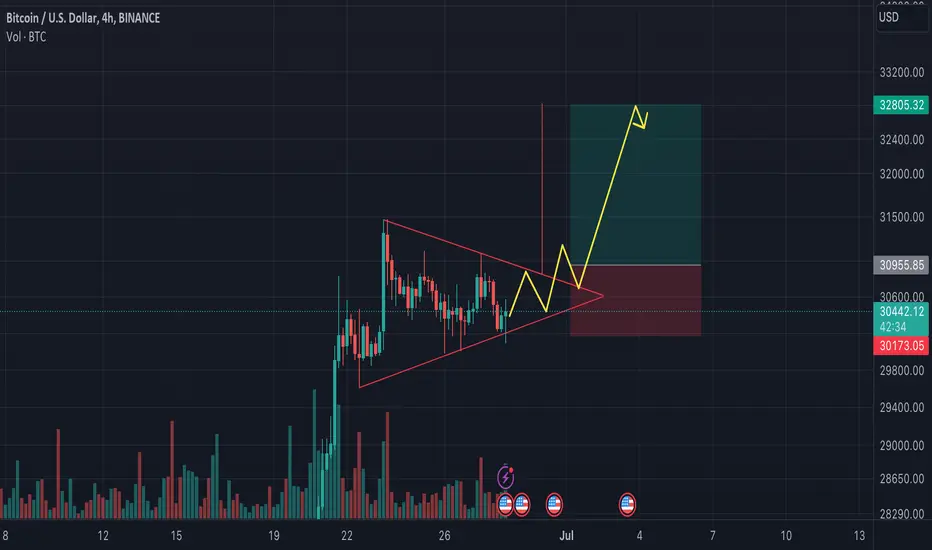
DON'T MISS this BTC, another rideIf you're new here check out my previous set ups on BTC and make sure you don't miss this
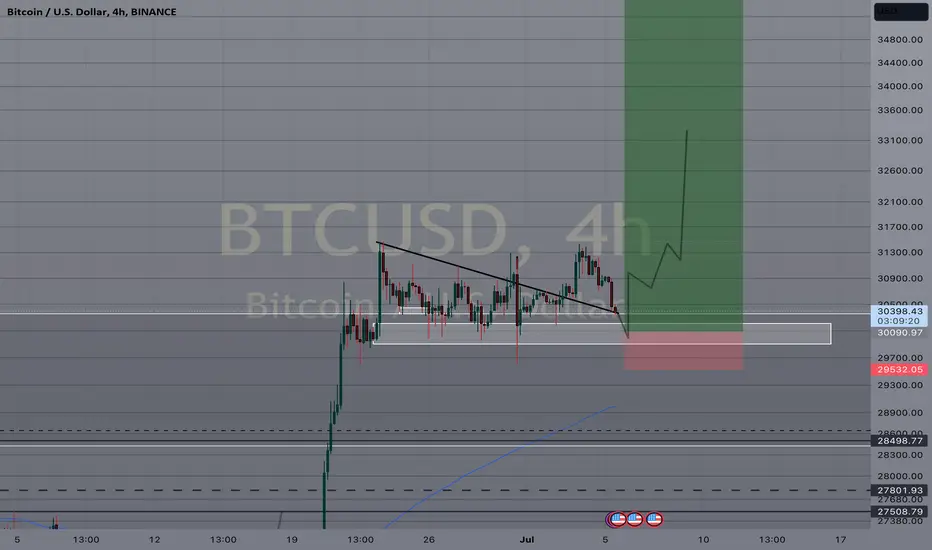
So we have a bullish pennant that is currently been retested, however i expect that BTC will test the liquidity point at 30k/ 30100 before we can fly and create a new year high.
Even though there is a strong probability that it will range from 31400 to 29700, doesn't mean we can't scalp or long for a potential break.
so i will be buying at 30100/ 30090
stop loss of 29500
See you at 36k
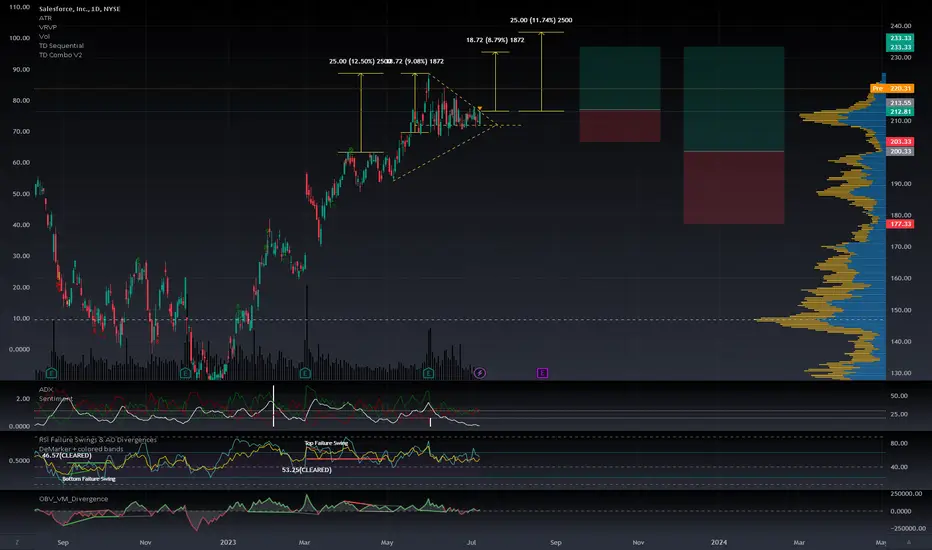
CRM breaking out of pennant, or wave C correction?Salesforce ( NYSE:CRM ) is making an impressive pre-market move, poised to kick off the day with a breakout from its pennant formation. By taking into account a measured move from the previous consolidation phase, coupled with a measured move from the onset of the formation, we can project a potential target range of $233-238. Interestingly, this aligns with the consensus 12-month price targets.
We're looking for this to invalidate the possibility that we've just wrapped up a wave B and are now embarking on a wave C correction. If the breakout fails and we enter a wave C hypothesis the long-term target remains intact. Consequently, I've planned two a entry approach: an immediate entry and a subsequent one at the $200 mark for further accumulation.
It's worth noting that both these levels have strong volume support. This dual-entry strategy provides a balanced approach to potential market volatility, ensuring we're prepared for either outcome.
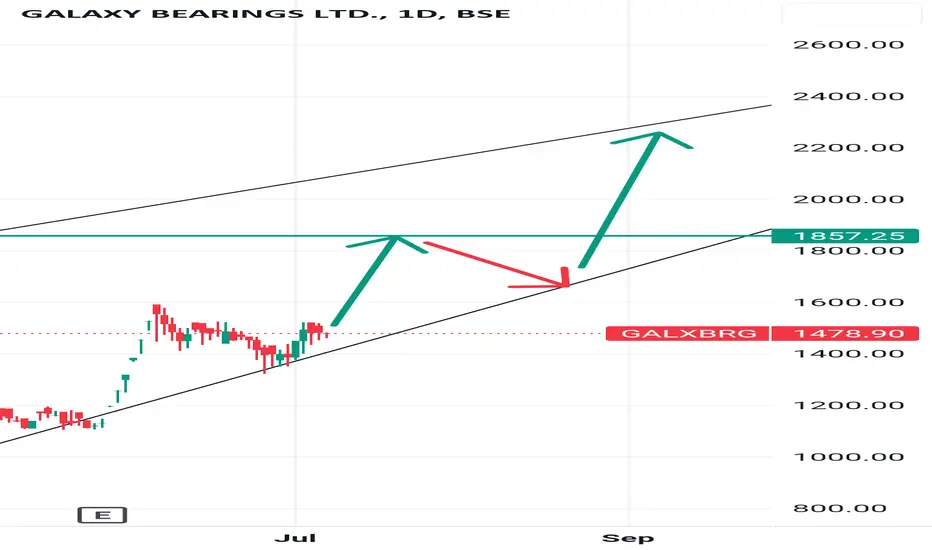
Galaxy bearing aways bullish Take entry at 1460 to 1475
1st target 1849
2nd target 2220
Strong sl 1305
This counter always in bulish mode.
From 2015 it's gave 39000% return.
Don't avoid just enter.
BTC UPDATE! DUMP INCOMING!!Hello everyone, if you like the idea, do not forget to support it with a like and follow.
Welcome to the new BTC update. BTC is currently trading around the $30.2k level.
As you see in the chart, it is forming a bearish pennant in 1hr time frame. It already breaks down this pennant and a retest is also done. According to this pattern, we might see a big sell-off today.
If this pattern plays out accordingly, then we see a dump up to the FWB:29K level from here.
Invalidation:- If the hourly candle closes above $30.5k then this bearish pattern will be invalidated.
What do you think about this?
Do you also think that we see a dump from here or do you think that we pump from here?
Let me know in the comment section.
If you like this idea then do support it with like and follow.
Thank You!

Binance Coin can exit from pennant and bounce up to 240Hello traders, I want share with you my opinion about Binance Coin. By observing the chart, we can see that price a few time ago bounced from the seller zone, which coincide with the resistance level, and made an impulse down below the buyer zone, which coincide with the support level. After these movements price tried to rise, but failed and later declined to support line, where at once it started to rise. BNB rose higher of the seller zone, breaking two levels, and soon reached the resistance line, and then the price bounced and made a strong impulse down to the support line of the downward pennant, thereby breaking past the support line and resistance level. But a not long time ago price bounced up to the resistance line, where it continues to trade to this day. In my mind, Binance Coin can fall to the support line again and then bounce up and break the resistance line. After this, the price can make a retest and then continue to move up, therefore I set my target at the 240 level. Please share this idea with your friends and click Boost 🚀

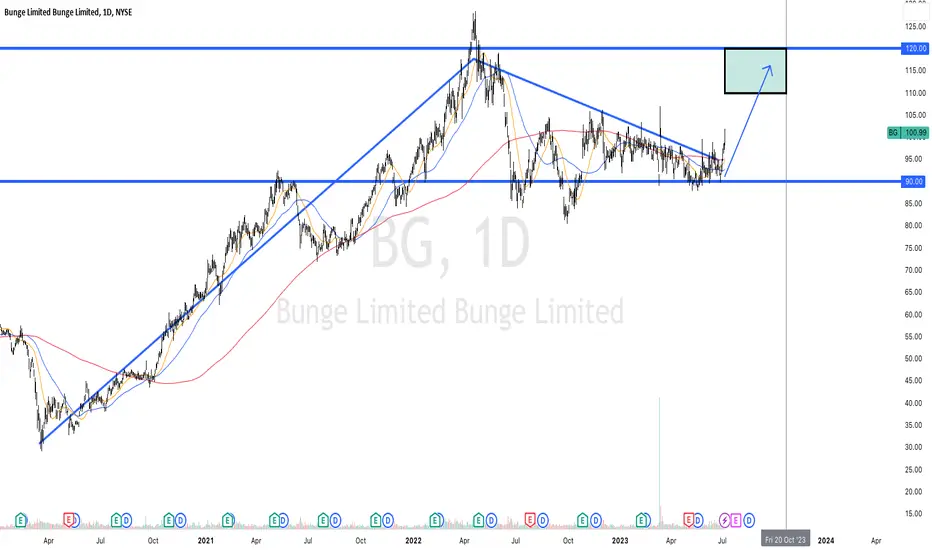
Bunge Limited ($BG) LongBunge Limited ( NYSE:BG ) is an American agribusiness and food company, incorporated in Bermuda, and headquartered in St. Louis, Missouri, United States. As well as being an international soybean exporter, it is also involved in food processing, grain trading, and fertilizer. The daily chart shows the stock exploded to the upside from $30 in 2020 to a high of $125 in 2022. The stock has been downtrending a bit, holding the $90 support level and holding above 20, 50 and 200 day moving averages. Someone thinks a move is due and selling the 10/20 $90P and buying 105/120C spreads for $2.10. Earnings 7/26/23 with a dividend in August.
Axsome Therapeutics building momentum Axsome Therapeutics Inc (AXSM)
I have been in this spot trade since $50.77. We are now at $72.93. I have much higher targets as you can see from the chart.
This is a long term trade looking to hold for 12 – 24 months however feel that something is going to happen within 6 – 12 months based on the chart.
- Forming pennant on chart and RSI. Potential for breakout.
- Steadily increasing OBV (On Balance Volume) demonstrating continued interested in the trade.
- Stochastic Momentum indicator (not included on chart is driving upwards on the weekly).
- You can see the orange boxes which act as accumulation zones with double bottoms before the larger move occurs.
- We are above the 200 week and using it as support and we are above the 200 day also using it as support so we have limited downside with strong support.
This purchase has been helped me recognized that Pharma appear to companies perform much better when the general market is in decline. They appear to be inverse risk on but also make small advances during risk on periods. It’s a market that I am becoming increasingly interested in as a diversifier and value lock. Obviously this is a smaller pharma company with higher risk in the trade, however if I was Regeneron or Johnson and Johnson and I see Axsome’s patents, drug offerings and the general population they are targeting with depression, Alzheimer’s and fibromyalgia, seems like a no brainer to buy them out.
Fundamentals:
AXSM are a Small Bio-Pharma company with market cap of $3.17 Billon. In August 2022 Auvelity Anti-Depressants was FDA approved & is the only rapid-acting oral medicine for MDD with labelling describing statistically significant antidepressant efficacy by one week.
AXSM received Breakthrough Therapy designation from the FDA for an Alzheimer's disease drug development and are at the NDA phase for developing a drug for acute treatment of migraine. AXSM are also developing a treatment for narcolepsy and separately for fibromyalgia.
All in, AXSM's offerings are building momentum. They have developed the fastest acting anti-depressant drug and are bringing it to market, and have a four other drugs in development, all of which have a large patient base. The company would be ripe for a buyout.

GBPCAD - BreakoutNice breakout of bullish pennant pattern, best long position with with TP at 1.69200. Expected will have pullback before reach the target.

In my mind Euro can bounce to resistance level, exiting pennantHello traders, I want share with you my opinion about Euro.By observing the chart, we can see how the price a few days ago declined from the support level, which coincide with the buyer zone to the support line, after which it bounced and made a strong impulse up to the resistance line, breaking the seller zone, which coincides with resistance level. Also, the price formed an upward pennant and soon it made a correction below the resistance level. After this movement, Euro try to rise back, but failed and fell to the support line, after which recently the price bounced up to the resistance level. And now the price trades close to this level, and maybe Euro can decline a little and then bounce up to the resistance level, thereby exiting from the pennant. As well price can break this level, make a retest, or at once continue to move up, without retest, Therefore I set up my target at the 1.0975 level. Please share this idea with your friends and click Boost 🚀

flag & pennant breakouta big flag breakout follow with a smaller pennant breakout.
next level to break..
$31,500. once clear off, next resistance at $34K- FWB:36K
DYODD

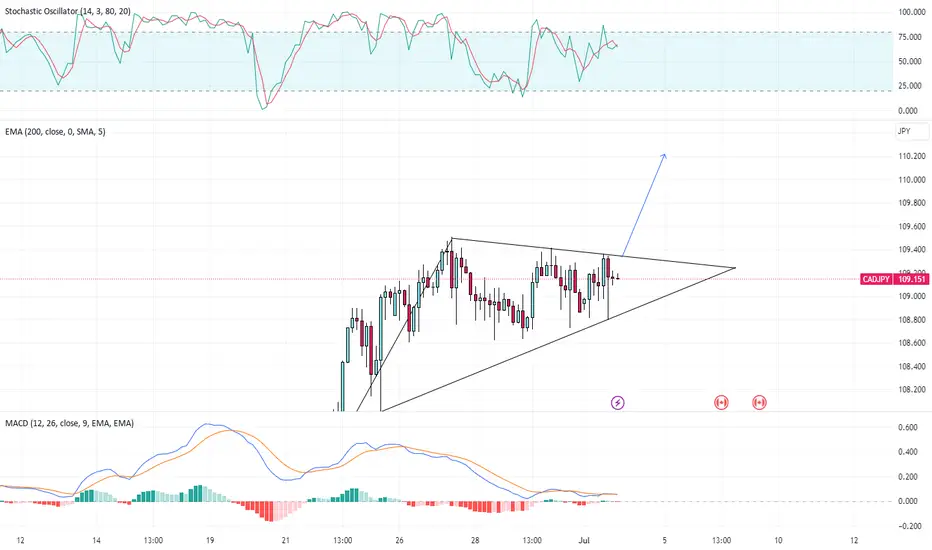
CAD/JPY - LongBullish pennant flag pattern building here.
- Recent strong bullish movements
- Indicators showing signs of further bullish movement
- In line with the overall trend
- Looking for a break of the resistance level around 109.30

USDCAD 3rd July 2023Short Setup:
Stop loss: 1.32893
Entry Price: 1.32429
Target 1: 1.31800
Will be trailing Stop loss on new Higher Lows ( Dow Theory )
Reasoning:
Breakout of Pennant in 4hrs plenty of Pips tp fall down

Gold can rebound of resistance line and start to fallHello traders, I want share with you my opinion about Gold. Looking at the chart, we can see that price a few time ago declined below the resistance area, which coincide with the resistance level, but soon backed up and even rose higher them. Next, the price repeated this movement and then made a correction to the seller zone, which coincides with the current resistance level, and at once bounced back. But soon, Gold roll down and fell to the seller zone again, thereby making a fake breakout. Later price tried to rise, but after it touched the resistance level, Gold made a correction below the seller zone and at a short time bounced to the resistance line, where it started to decline. Price declined to support line, forming a downward pennant, in which Gold broke the 1930 level. Next price bounced from the support liner to the resistance line, but recently it bounced of the resistance line too. And now Gold trades near the resistance line and I think it can rise to the resistance line and then start to fall to the support line. Possibly, Gold can break the support line and continue to fall, therefore I set my target at 1905. Please share this idea with your friends and click Boost 🚀

PSTG: Bullish Pennant, Not confirmed (46.35%)Bullish pennant for PSTG on the Weekly chart.
Not confirmed.
Pros:
1- PPS above 50MA and 200MA
2- RS above 0 but barely
3- R/R ratio above 5
4- 250RSI above 50 and climbing
5- 50MA above 200MA
6- Both 50MA and 200MA ascending
7- Golden cross circled in Marth 2021
8- Post formed with volume
9- Descending volume during pennant forming
Cons:
1- Figure is not confirmed
2- No break out yet
3- ATR flat
If confirmed, target price is 53,52$
Again, stay humble, have fun, make money!
MAAX!
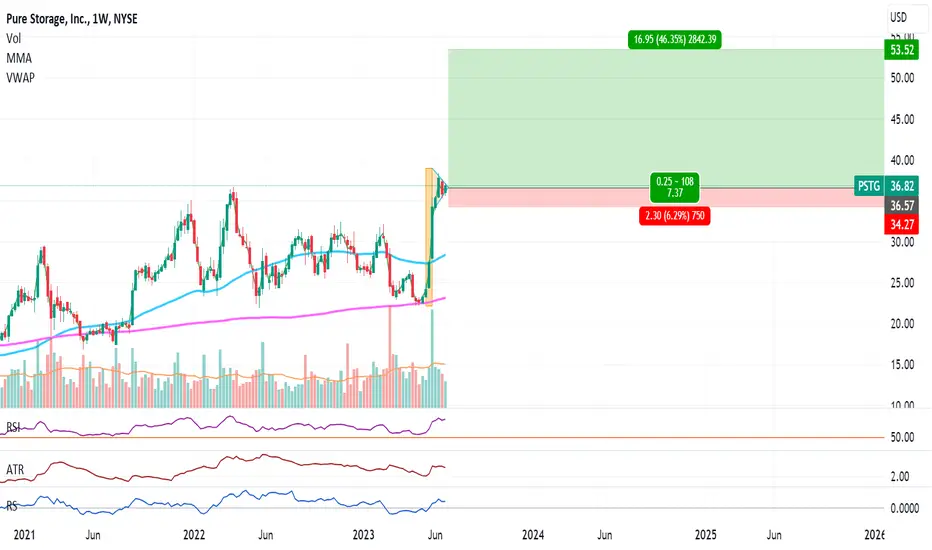
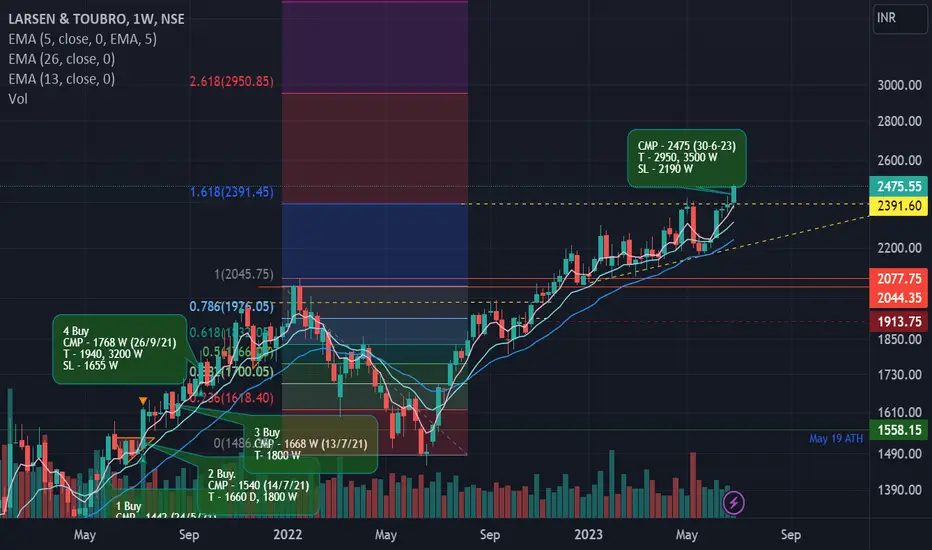
Chart of the week.This is one of my favorite simply because of its fundamentals. Larson and Tourbro is not a new name in NSE. L&T is a market leader in construction and defense. This week it has given a Fibonacci breakout. As one can see from the chart, I have recommended this share since May 21, when it was trading around 1450. This is the stock an Investor should buy and forget. An Investor should not use this SL and buy it on each dip.
CMP - 2475 (30-6-23)
T - 2950, 3500 W
SL - 2190 W
BTC looks like a bull pennant pattern
* 4H
Triangular convergence upward breakthrough came out, and it looks like a bull pennant pattern.
Buckle up !

Binance Coin can bounce of resistance level and start to fallHello traders, I want share with you my opinion about Binance Coin. By observing the chart we can see how the price bounced from the support line, which coincides with the buyer zone to the resistance line, thereby breaking two levels. After this, the price made a strong downward impulse back to the support line, declining below the 241.5 level. Next BNB some time traded between support and resistance lines, and after one more time correction, it bounced up to the resistance line of the pennant, thereby breaking past the resistance line. Inside the pennant, the price very much declined to the support line, which is located below the buyer zone. But a not long time ago BNB roll up and started to rise and recently even exited from the pennant and now trades close resistance level. I think Binance Coin can bounce down of this level and then start to fall. For this reason, I set up my target at the 235 level. Please share this idea with your friends and click Boost 🚀

British Pound can make correction movement and then bounce upHello traders, I want share with you my opinion about British Pound. Looking at the chart, we can see how the price bounced from the buyer zone and made impulse up to the resistance level, which is located inside the seller zone. But soon price bounce down and made correction below the support level with the buyer zone to support line. After these movements, British Pound made a strong impulse up to the resistance line, thereby reaching past the target, which is located at 1.2615 level, and rose higher of the seller zone with the resistance level and forming upward pennant pattern. Later price bounced of the resistance line and declined below the seller zone with the resistance level to the support line, but recently British Pound bounced up and now trades in the seller zone. Maybe the price can make a little move down and then bounce up. As well possibly British Pound can break the resistance level, make a retest, and continue to move up to the resistance line. If the price can break the resistance line, it can exit from the pennant and continues to move up, therefore I set up my next target at the 1.2780 level. Please share this idea with your friends and click Boost 🚀

Euro can leave pennant, make retest, and continue to growHello traders, I want share with you my opinion about Euro. Looking at the chart, we can see that a few days ago price bounced up from buyer zone and rose to resistance line. After this movement, Euro made correction to support line, which coincide with past support level. Then price bounced up and started to rise between resistance line and support line and a few time later, it bounced from support line and made upward impulse higher of current support level, thereby breaking it. Next, Euro made correction to resistance area, but soon bounced up to resistance line and after this move it started to decline to support line, thereby forming pennant. When price fell to support line, it broke support level, but a not long time ago Euro backed up and now trades inside resistance area, which coincides with resistance line. I expect that price can bounce up, thereby exiting from the pennant and the resistance area and then make a retest. After these movements, Euro maybe can continue to grow, therefore I set my target at 1.0970 level. Please share this idea with your friends and click Boost 🚀

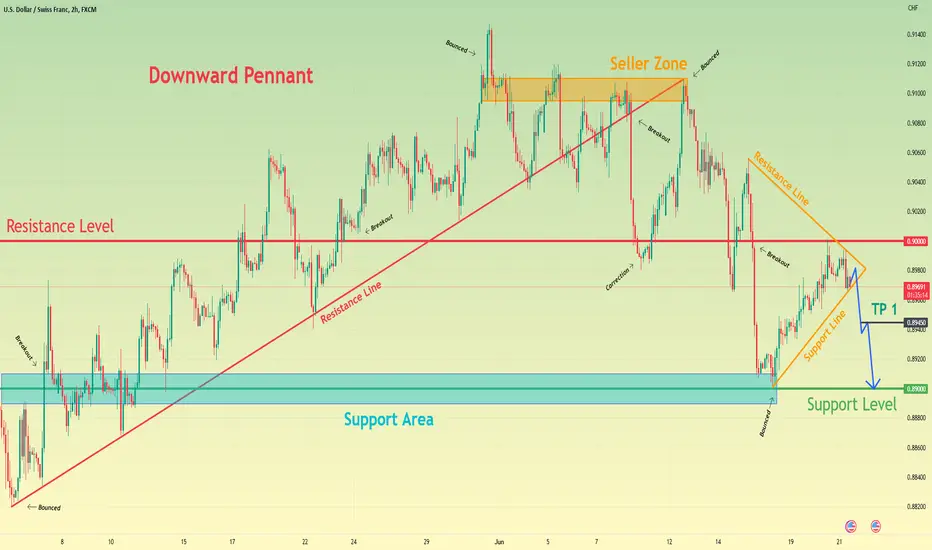
Swiss Franc can break support line and start to fall to 0.8900Hello traders, I want share with you my opinion about Swiss Franc. Observing the chart, we can see how the price bounced up from support line and start to move up. When price rising to the seller zone, it broke two levels - 0.8900 and 0.9000, but after the Swiss Franc reached seller zone, it bounced down and started to decline. Also later price broke support line and made a correction below the 0.9000 level, and at once made an upward impulse to seller zone again. But soon Swiss franc bounced down lower 0.9000 level again to the support area, which coincide with the support level. After these movements, price started to grow inside pennant, where it continues trades to this day. In my mind price can make a little rise, then bounce down and start to decline. Also Swiss Franc can break saupport line and maybe fall to support level. For this case, I set two targets, first - 0.8945 and second - at 0.8900 support level. Please share this idea with your friends and click Boost 🚀