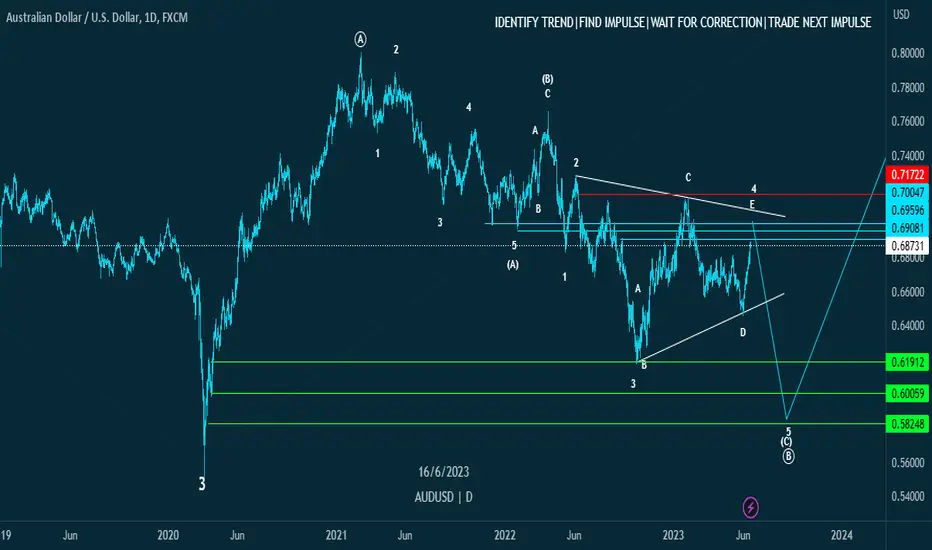
AUDUSD D1AUDUSD is currently on wave E of sub-wave 4,a bearish movement is expected as sub-wave5 of wave C this upcoming week from one of the blue lines completing Sub-wave C on wave B
Pennant
ADA - bearish pennant A bearish pennant starts with a noticeable downtrend in the price of an asset, like ADA. After the initial decline, the price enters a consolidation phase where the daily price ranges become narrower, forming two converging trendlines. This consolidation indicates decreasing volatility and a potential continuation of the downward trend.

usdjpy to make a big decision todayIn the following video I've provided 3 scenarios in which I would look to take part in any trades. The first of which is quite simply a higher high will produce another higher high.
Both scenarios afterwards are reversals. If price throws indecision in the correct direction, it signals a reversal. The daily close today will suggest a lot at yesterday was relatively volatile.

Global Foundries Bearish Shark Global foundries shows a harmonic shark pattern with a Close below 61.14 activating T1 target @ $54.75
Break the 0.382 fib zone at the sloping trendline activates T2 target @ $48.40
T1 target @ $54.75
T2 target @ $48.40

Euro can exit from penannt and break resistance levelHello traders, I want share with you my opinion about Euro. Observing the chart, we can see how price bounced up from 1.0790 level and made upward impulse to seller zone, thereby breaking one more resistance level. Later, Euro started to decline, bouncing from seller zone and making strong downward impulse below support area to support line. Also, price entered to pennant, in which Euro continues trade close resistance area now. After this pattern, I think Euro can break current resistance level and then make retest. But also, I think maybe price can don't make retest, after breakout, it can at once continue to grow. For this case, I set my target at the 1.0880 level. Please share this idea with your friends and click Boost 🚀

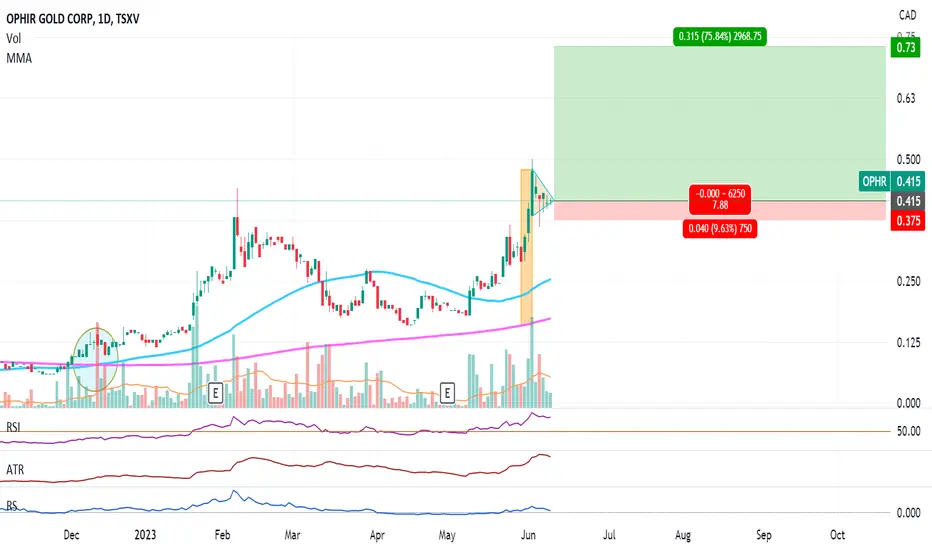
OPHR.CA: Bullish Pennant, not confirmer (75.84%)Bullish pennant for OPHR on TSX.
Not confirmed yet. Gold company, mining industry.
Pros:
1- PPS above 50MA and 200MA
2- RS above 0 but barely
3- R/R ratio above 5
4- 250RSI above 50
5- 50MA above 200MA
6- Both 50MA and 200MA ascending
7- Golden cross circled in blue
8- Post formed with volume
9- Descending volume during pennant forming
Cons:
1- Figure is not confirmed
2- No break out yet
3- ATR flat
If confirmed, target price is 0,73$
Again, stay humble, have fun, make money!
MAAX!
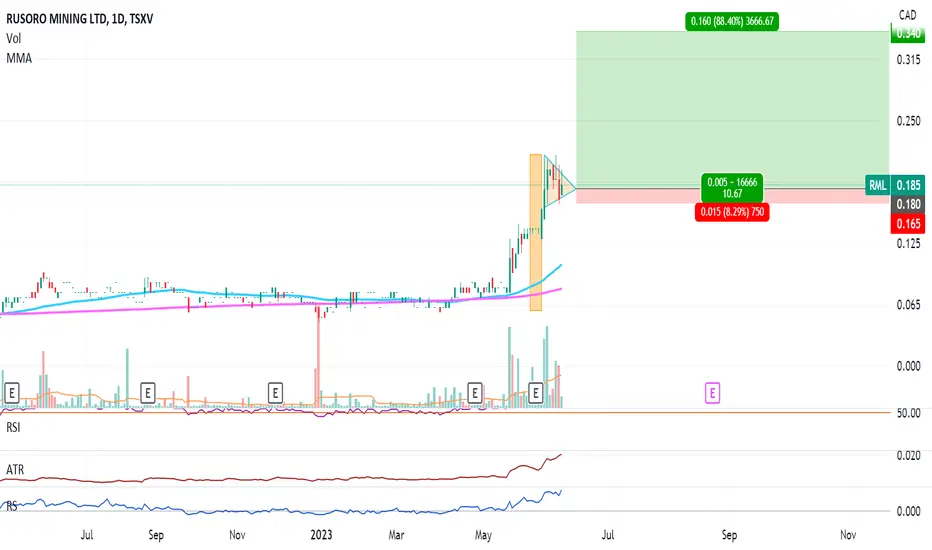
RML.CA: Bullish pennant, not confirmed (88%)Bullish pennant for RML on TSX.
Not confirmed yet. Mining industry has been on an uptrend for some time now.
Pros:
1- PPS above 50MA and 200MA
2- RS above 0 and climbing
3- R/R ratio above 5
4-
5- 50MA above 200MA
6- Both 50MA and 200MA ascending
7- Golden cross circled in may 2023
8- ATR climbing, more volatility
9- Post formed with volume
10- Descending volume during pennant forming
Cons:
1- Figure is not confirmed
2- No break out yet
3- 250RSI No data yet. Young stock.
If confirmed, target price is 0,34$
Again, stay humble, have fun, make money!
MAAX!
Continuation pattern on RNDRLooking at a bearish pennant, target at circle.
Will the blood continue?

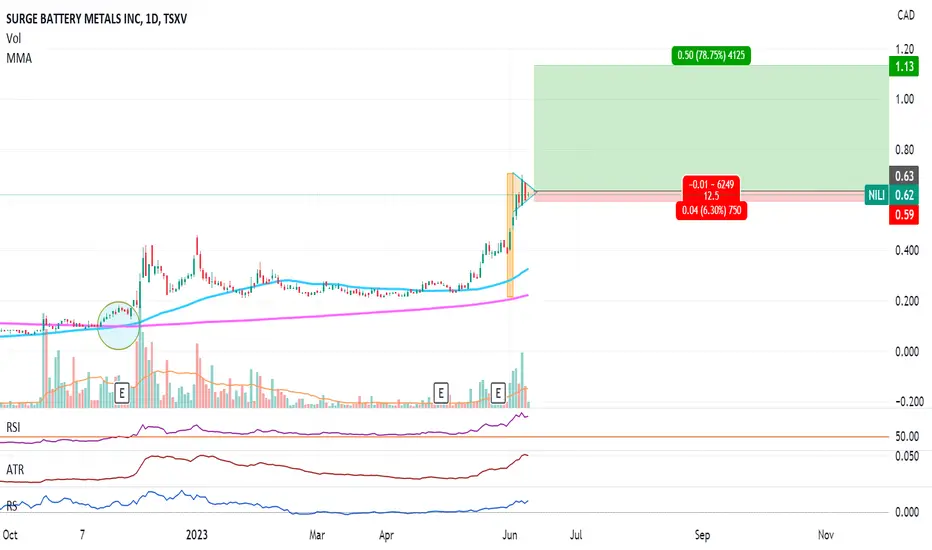
NILI.CA: Bullish Pennant, not confirmed (78%)Bullish pennant for NILI on TSX.
Not confirmed yet but metal for batteries is a hot topic right now.
Pros:
1- PPS above 50MA and 200MA
2- RS above 0 and climbing
3- R/R ratio above 5
4- 250RSI above 50 and climbing
5- 50MA above 200MA
6- Both 50MA and 200MA ascending
7- Golden cross circled in blue
8- ATR climbing
9- Post formed with volume
10- Descending volume during pennant forming
Cons:
1- Figure is not confirmed
2- No break out yet
Target price is 1,13$
Again, stay humble, have fun, make money!
MAAX!
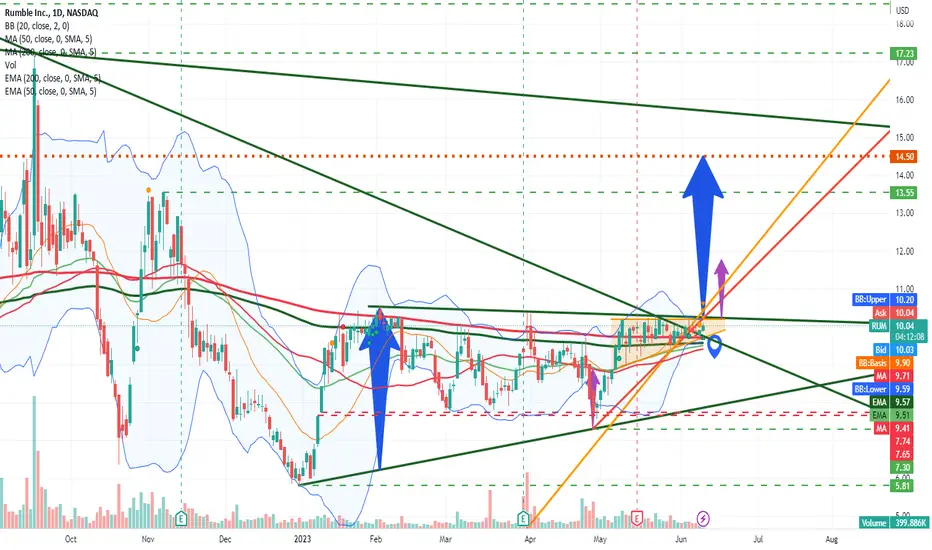
RUM - Two Technical Patterns Warrant AttentionLarger Pattern - Triangle and Upside Risk NASDAQ:RUM
In the making now for 5-6 months. Projects to ~$14.50 on a bullish resolution but would need to give it up to 6 months to achieve that level. Assuming this target is achieved then the overall downtrend line originating from the all-time high becomes the next technical target which is above $15 and declining at the current time.
Smaller Pattern - Pennant and Upside Risk
In the making for approximately a month. Projects to ~$11.80 on bullish resolution in 3 - 5 weeks.
Confirmation
Look for a close and a sustained move above $10.30 on higher volume. This area represents the upper resistance for essentially both patterns at roughly this point in time and a move above this area would represent a bullish resolution to both patterns. Targets noted assume bullish resolution in the short-term.
Downside Risk
Failure of smaller pattern points to the lower trendline of the larger pattern. Failure of the smaller pattern can also indicate an enlargement of the pennant but would arguably weaken the potential. At prima facie a break below the pennant would be bearish. Below that look for support areas indicated. Failure of the smaller pattern would reduce the bullishness overall but could have the larger pattern remain in play as a potential.
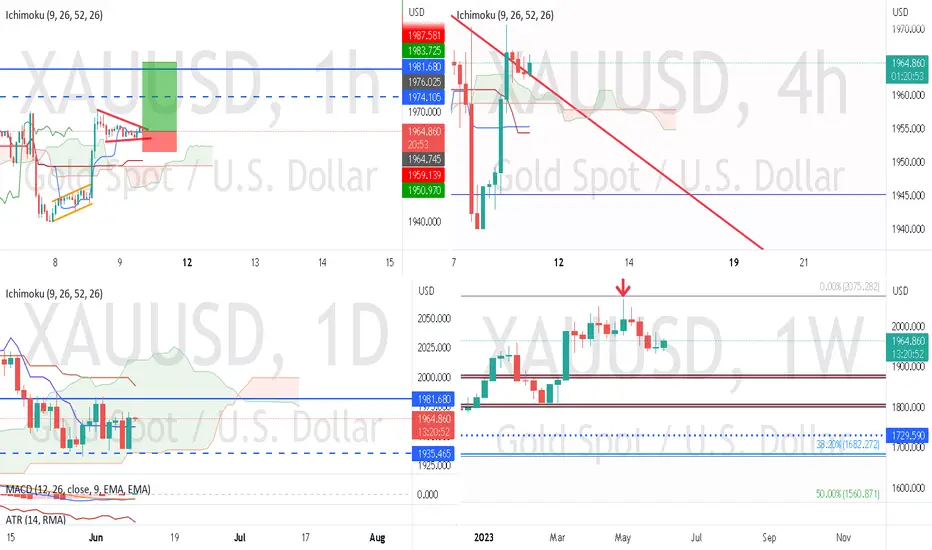
Gold pennant potentialTrade Idea: Buying Gold
Reasoning:
• Weekly – Potentially forming a Morning Doji Formation (Bullish)
• Daily – Bullish engulfing candle yesterday (Bullish)
• 4hr - Price action above downward trend resistance and Ichimoku cloud (Bullish)
• 1hr – Forming Bullish Pennant (Bullish)
Entry Level: 1964.745
Take Profit Level: 1983.725
Stop Loss: 1959.139
Risk/Reward: 3.39:1
Disclaimer – Signal Centre. Please be reminded – you alone are responsible for your trading – both gains and losses. There is a very high degree of risk involved in trading. The technical analysis, like all indicators, strategies, columns, articles and other features accessible on/though this site is for informational purposes only and should not be construed as investment advice by you. Your use of the technical analysis, as would also your use of all mentioned indicators, strategies, columns, articles and all other features, is entirely at your own risk and it is your sole responsibility to evaluate the accuracy, completeness and usefulness (including suitability) of the information. You should assess the risk of any trade with your financial adviser and make your own independent decision(s) regarding any tradable products which may be the subject matter of the technical analysis or any of the said indicators, strategies, columns, articles and all other features.
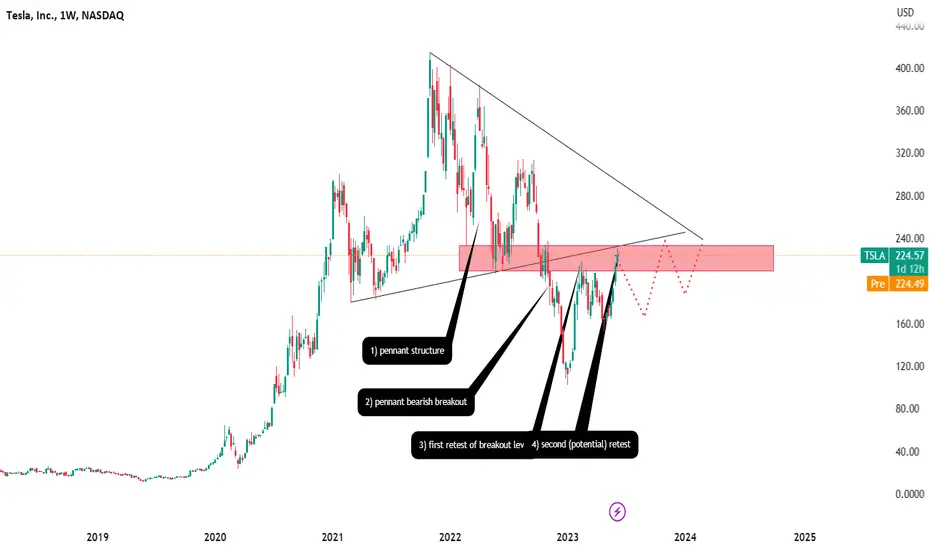
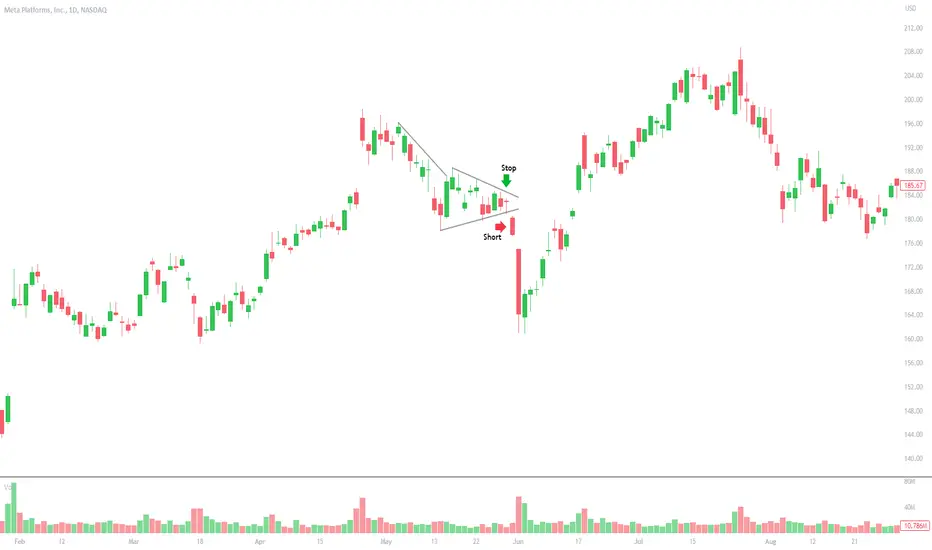
Should you sell your TESLA shares? ▼We can see price breaking out of a bearish pennant, resulting in a solid move down, retesting first, going down again and now going for a potential second retest of the previous support which now becomes resistance.
Looking for continuation to the downside.
Fundamental backup as the average analyst price target is 180$ a share which is about 20% lower than current prices
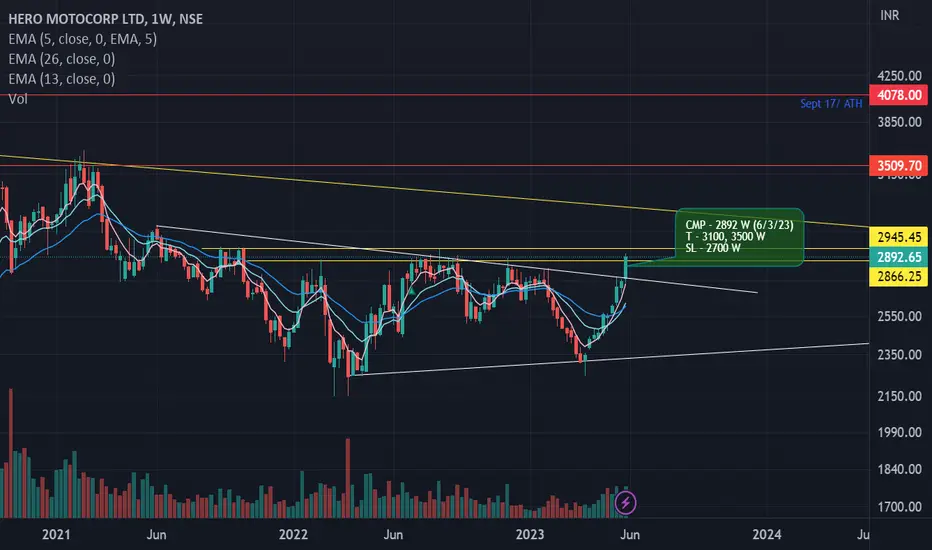
Techno-Funda pickHero Motor is consolidating since Feb 21 and now it has given a Pennant / Bullish wedge breakout with good Volume. Hero is a market leader and consistently showed great growth on YOY basis. Still there is a significant upside left for the stock so in my opinion, one can do SIP in this stock without being worried for Stop loss simply because it has a great fundamentals. Buy it in instalments or on each dips and there will be few resistances before it tests its all time high ie 4000.
CMP - 2892 W (6/3/23)
T - 3100, 3500 W
SL - 2700 W
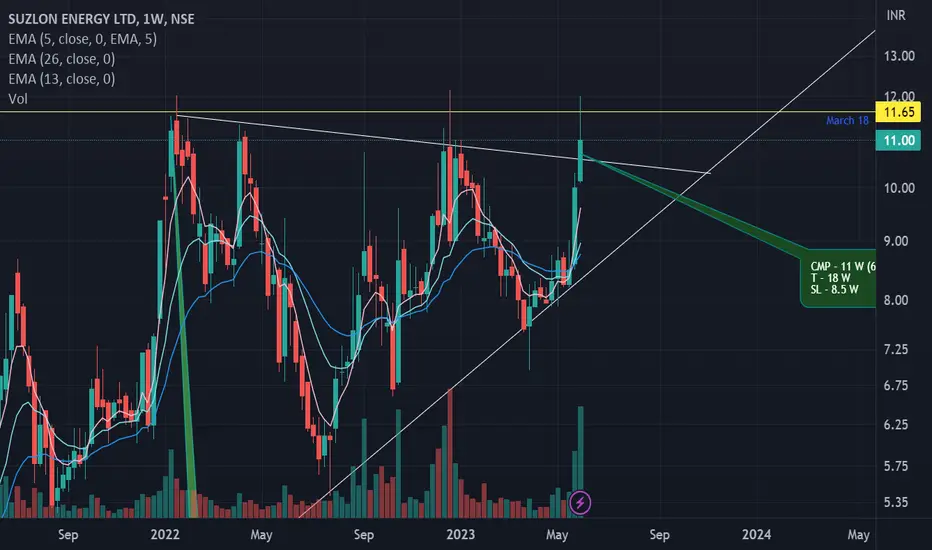
High risk pick of the week!I had recommended Suzlon in Jan last year as chart of the week. Once can see a detailed analysis on the same page. Today again I'm recommending to buy Suzlon @ 11. One must understand that it is a well beaten stock, hence, it's a High risk trade and patience is required to earn profits. If you take this call, invest as per your risk appetite.
CMP - 11 W (6/2/23)
T - 18 W
SL - 8.5 W
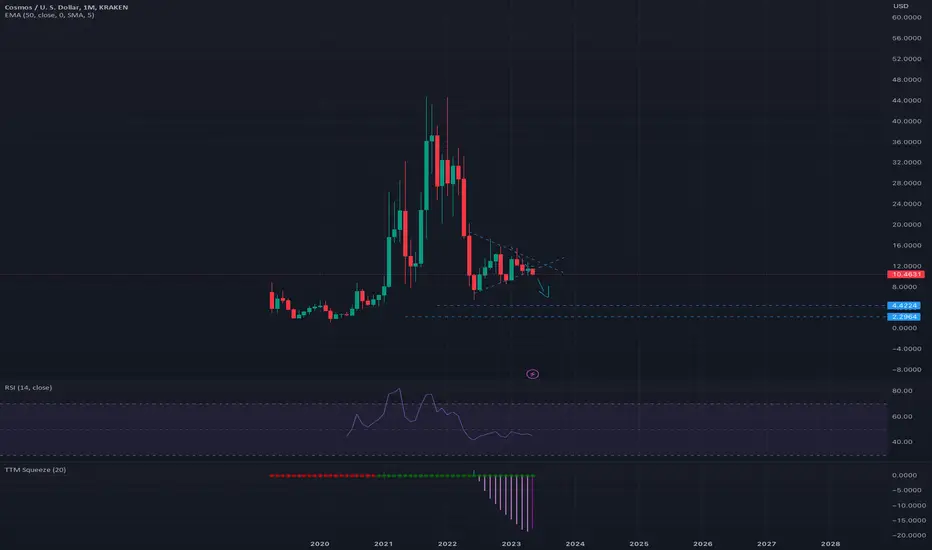
Bearish Pennant Bearish pennant on the monthly has been in formation for some time now. I expect atom to retrace down to the $6-8 range.
FINNIFTY Expiry Day Trade Setup (30-May-2023)This will be my personal trade Setup, This is not an advice of any kind to initiate trade according to this setup. This is for only for my learning purpose and maintaining my trading journal.
So with gap up today and from days price action forming like pennant or bull flag. Breaking this pattern could give good move if price opens flat only.
For trade setup:
1.) If open flat will look for break of this pattern on either side if breaks on upside target will be Today's High (19615) then 19630. On Break of downside target will be 19431 then 19392.
2.) If opens gap up then will wait for price action to form and will trade only if it forms some pattern or if there is good setup.
3.) If open gap down setup will be same as point 2.
As on expiry due to theta decay and because of some gamma moves premium values erode fast and they won't gain. so will only trade solid setup with small stop.
Hit like to keep me motivated for keeping my trading journal as it only take less then few seconds to hit like but it gives me motivation for preparing for my session. Also one can comment on how I can make this trade journal better any improvements I need in it :) .

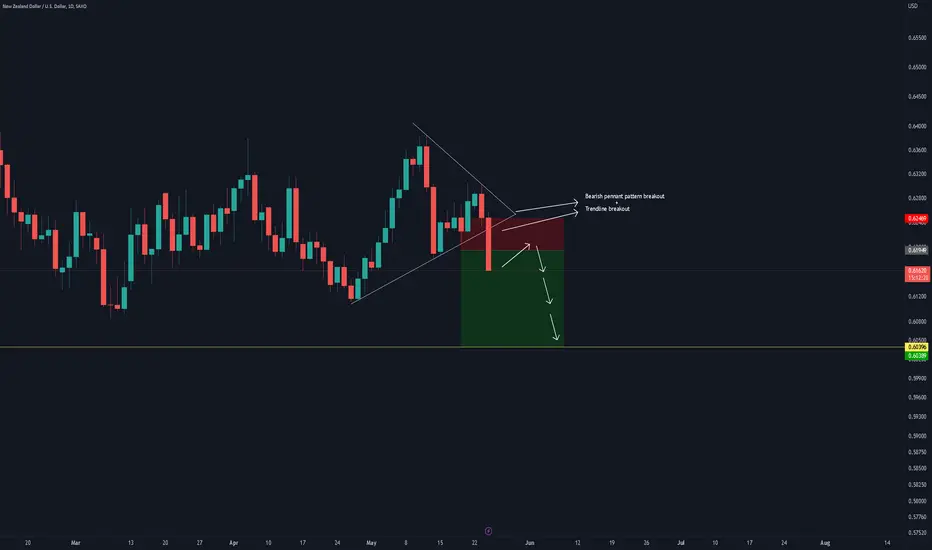
NZDUSD Bearish Pennant Pattern BreakoutVery simple trading pattern forming in the direction of bigger picture trend. We will wait until we see a bullish correction
on the smaller time frames before looking for an entry. Once this correction is complete we will then enter short as long
as we think we can achieve a minimum of 1 to 3 risk reward on this particular trade.
Beatiful pictures: USDCAD triangle + triangleBeautiful pictures: USDCAD triangle + triangle
Weekly: triangle in formation
Wave D is formed by ABC which is formed by a triangle

Bitcoin Growth with Bullish 🚩Pennant🚩 Pattern🚀Bitcoin managed to break the resistance line successfully.
Now Bitcoin is pulling back to the resistance zone and the resistance line that has been broken.
The pullback structure is in the form of a falling wedge pattern, and if we look closely at the chart, we can also see a bullish pennant pattern.
I expect Bitcoin to grow up to the resistance zone after breaking the upper line of the falling wedge pattern.
Bitcoin Analyze ( BTCUSDT ), 15-minute time frame ⏰.
Do not forget to put Stop loss for your positions (For every position you want to open).
Please follow your strategy, this is just my Idea, and I will be glad to see your ideas in this post.
Please do not forget the ✅' like '✅ button 🙏😊 & Share it with your friends; thanks, and Trade safe.

Got more Doge?POLONIEX:DOGEUSD Dogecoin is showing this repeating pattern. I like to call it a Pump and Pump :-)
Maybe it will ultimately become a Pump and Dump . So I am not going all in.
However, a small holding of Doge has the potential of creating a large return.
This is an asymmetric risk-to-reward play.
I write off all the money I put in. So it is a small loss on my portfolio immediately, but if the trade plays out it will generate a significant gain on my overall portfolio.
One fundamental consideration:
Doge was meant as a meme coin. Its intended use is 'tipping'. Dogecoins are not defisable. So if Doge goes up by a lot, the tipping and maybe even payment functionality will become less useful or practical.
All and all, this is a very speculative trade. Please be aware of that and act accordingly.

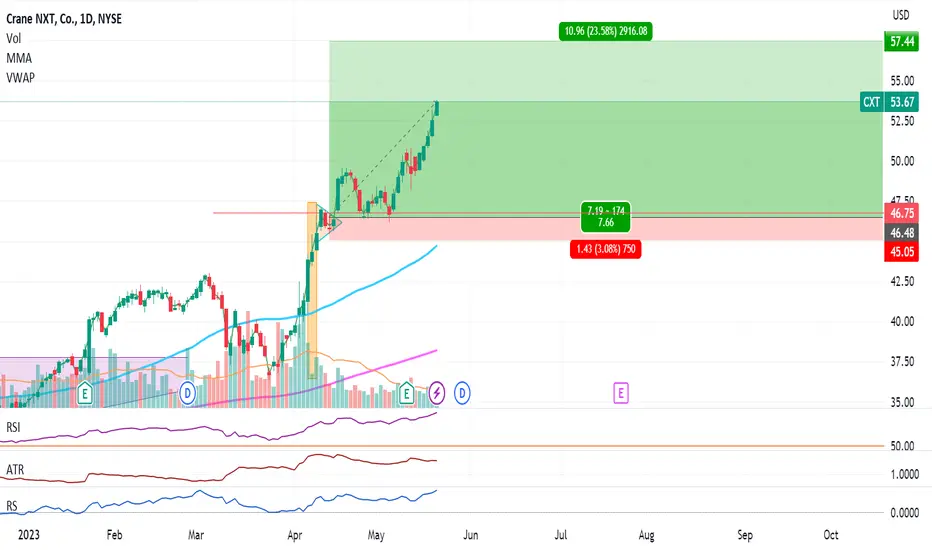
CXT: Bullish Pennant updateHope some of you guys jumped in. CXT is currently climbing pretty steadily.
Pennant is still on target to attain its 57ish $ goal.
Should see this price it prior to dividend (June 8th).
Stay humble, have fun, make money!
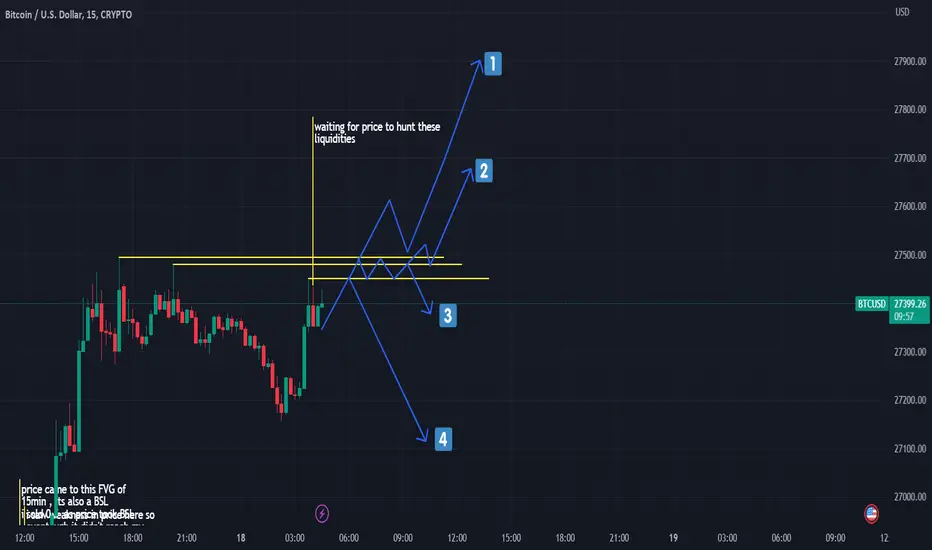
Which Scenario ?Just by looking at it it makes sense for price to hunt all those untouched liquidity , right ?
but what's gonna happen next ?
as i indicated here there are 4 scenarios for me , but i think 4 is the most possible one , why u ask ?
well , if u follow my ideas i am bearish on BTC and i have a whole bunch of reasons and all i see here and in the recent move was just a liquidity hunt .
i predict prices bellow 25K for BTC cause i yet recognize exhaustion in price move , and it is not a good sign if u want to see a bull run ...
so yeah , here it is , make ur own judgment .