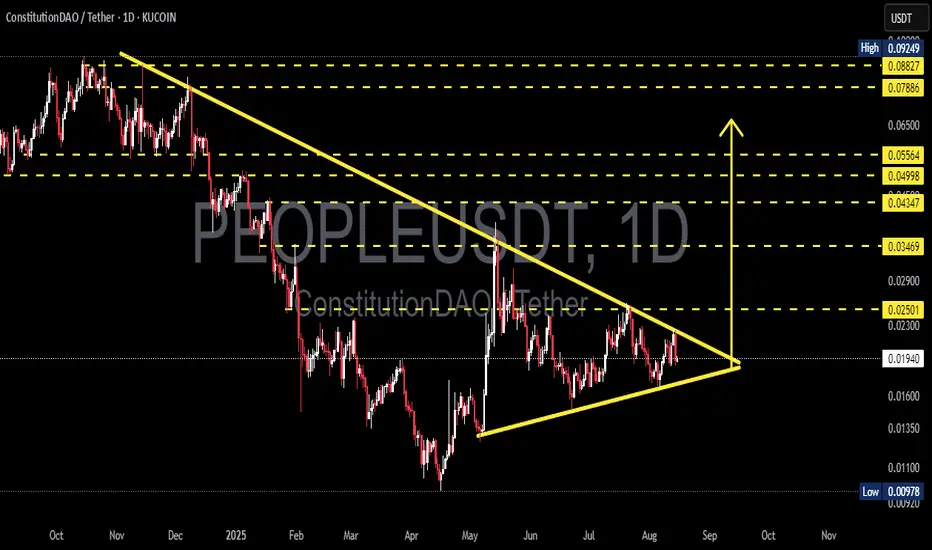
PEOPLEUSDT – Symmetrical Triangle Near Apex: Ready for a Break?Overview
Structure: Symmetrical Triangle — a long-term descending trendline (lower highs) converging with an ascending trendline (higher lows) since May. Volatility is tightening as price approaches the apex (late August–early September).
Current Price: ± 0.0194
Key Levels:
Resistance: 0.0230 → 0.0250 → 0.0290 → 0.0347 → 0.0435
Support: rising trendline (~0.018–0.0185) → 0.0160 → 0.0135 → 0.0110 → 0.0098 (YTD low)
---
Pattern Details
Symmetrical Triangle formed by a descending supply line connecting lower highs from Q4 2024 and an ascending demand line from the May 2025 swing low.
This is a neutral pattern — direction can go either way, with probabilities close to 50/50. Breakout confirmation requires a daily close outside the triangle with increased volume.
Measured move: the initial triangle height is ~0.012–0.014. Adding/subtracting this from the breakout point gives a projected move to:
Upside target: ~0.033–0.035 (aligning with 0.0347 resistance)
Downside target: ~0.007–0.010 (aligning with 0.0098 support zone)
---
Bullish Scenario
Trigger:
Daily close above the upper trendline (~0.021–0.022) with strong volume
Possible Path & Targets:
1. 0.0230 (first retest)
2. 0.0250 (minor supply)
3. 0.0290 (major resistance)
4. 0.0347 (measured move target & key historical resistance)
5. Extended run: 0.0435 if momentum continues
Invalidation: close back below 0.021 after breakout. Stop-loss often set just below breakout retest.
---
Bearish Scenario
Trigger:
Daily close below the lower trendline (~0.018–0.0185) with strong volume
Possible Path & Targets:
1. 0.0160
2. 0.0135
3. 0.0110
4. 0.0098 (low; break here could open room to 0.007–0.010 range per measured move)
Invalidation: close back above 0.0185 after a downside break.
---
Trade Notes & Risk Management
Symmetrical triangles typically break between two-thirds and three-quarters of the way to the apex — we are currently near that zone. Waiting for confirmation is safer than guessing direction.
Prefer the break–retest–go approach over chasing the first breakout candle.
Use laddered take-profit at horizontal levels and keep risk ≤1–2% per trade.
Be aware of fakeouts near the apex — volume is a key filter.
#PEOPLE #PEOPLEUSDT #ConstitutionDAO #TrianglePattern #SymmetricalTriangle #Breakout #PriceAction #CryptoTA #Altcoin #SupportResistance
Peopleusdtanalysis
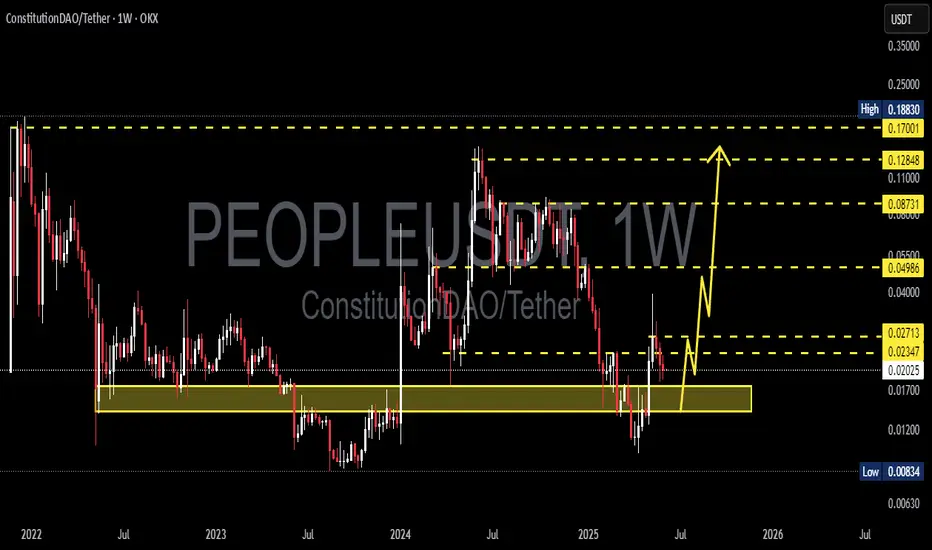
PEOPLEUSDT 1W AnalysisPEOPLE ~ 1W Analysis
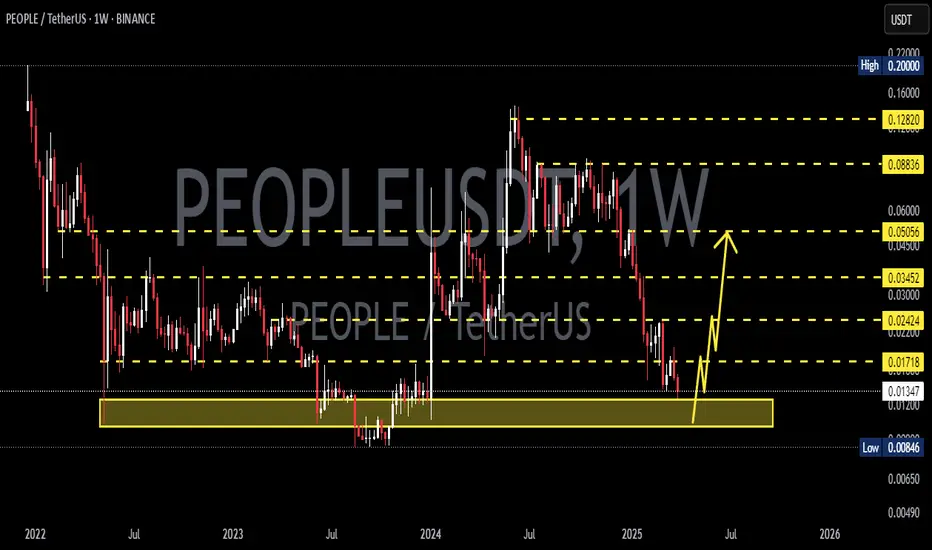
#PEOPLE Buy back on retest of this support block with short term target of at least 20%+ from here.
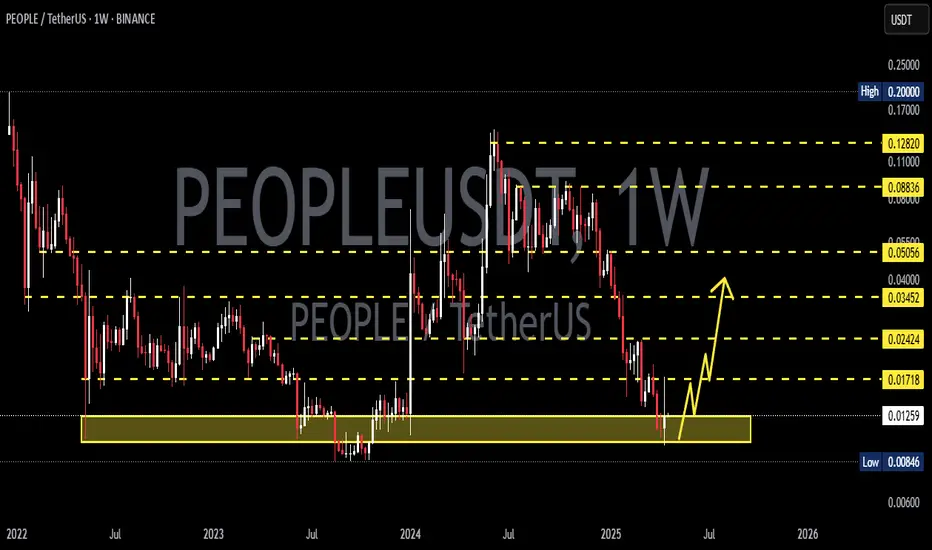
PEOPLEUSDT 1W AnalysisPEOPLE ~ 1W Analysis
#PEOPLE Buy back gradually from here with a short -term target of at least 20%+. This is the lowest support for now.
PEOPLEUSDT 1WPEOPLE ~ 1W Analysis
#PEOPLE Buy back from here if you still have a Conviction on this coin with a short -term target of at least 20%+.
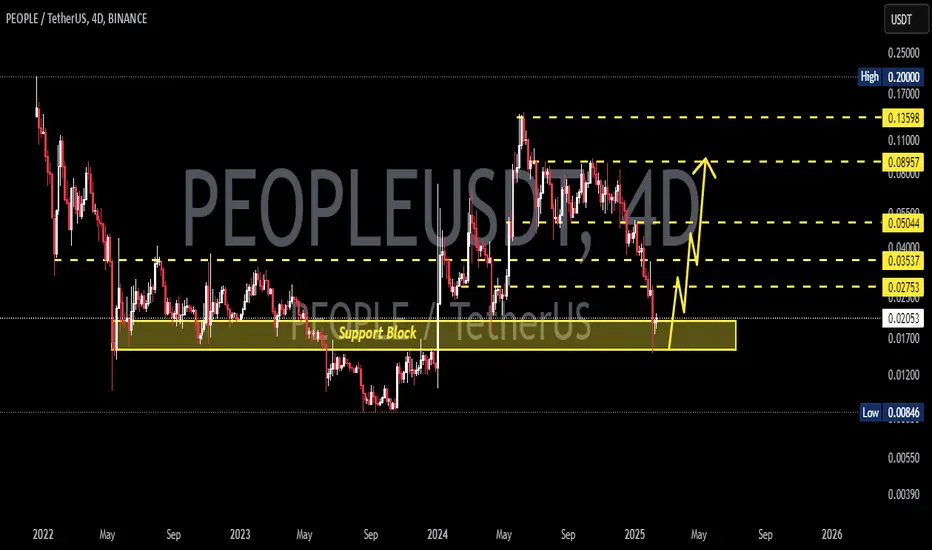
PEOPLEUSDT 4DPEOPLE ~ 4D Analysis
#PEOPLE Buy from here if you still have a Conviction on this coin with a minimum target of 20%+.
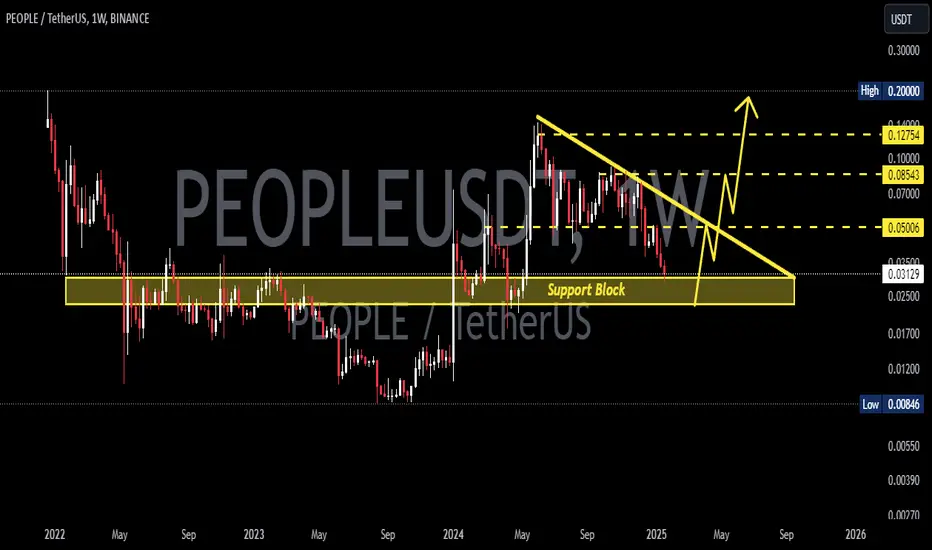
PEOPLEUSDT 1WPEOPLE ~ 1W
#PEOPLE If you still have Conviction on this coin,. this support block would be a very good buying place for now,. with a minimum target of 20%++
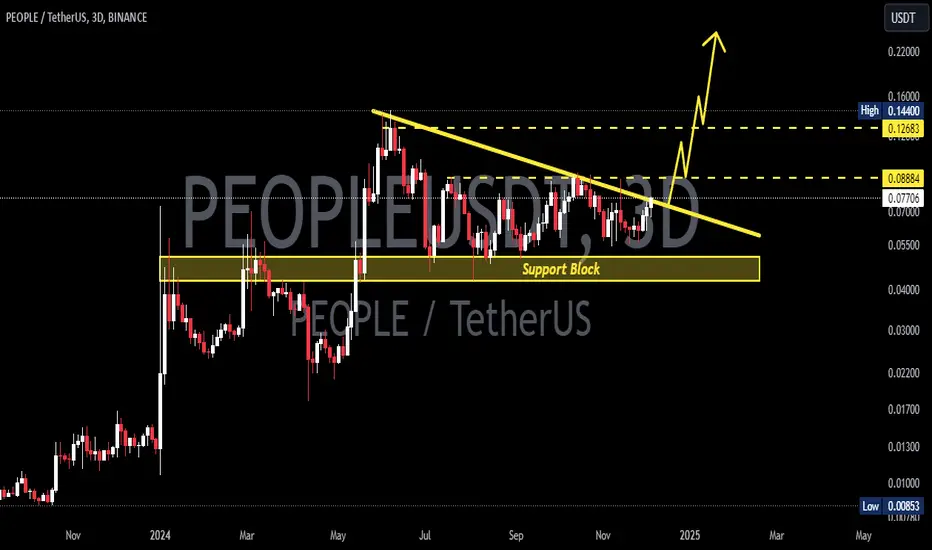
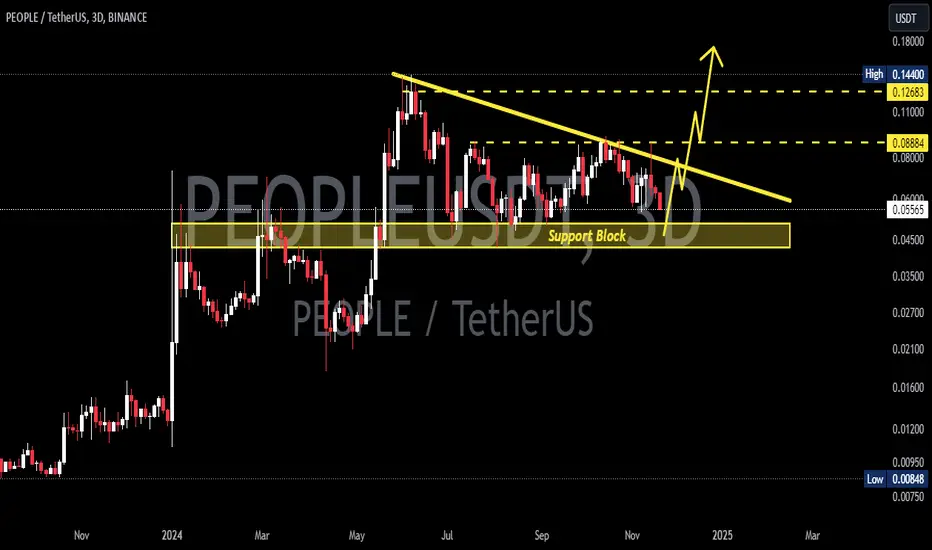
PEOPLEUSDT 3DPEOPLE ~ 3D
#PEOPLE If you still have Conviction on the coin,. Buy in stages from here. with a minimum target of 20%++
PEOPLEUSDTPEOPLE ~ 3D
#PEOPLE If you are still interested in this coin. Buy on this support block,. We think this will be retested. short term target of at least 15%++
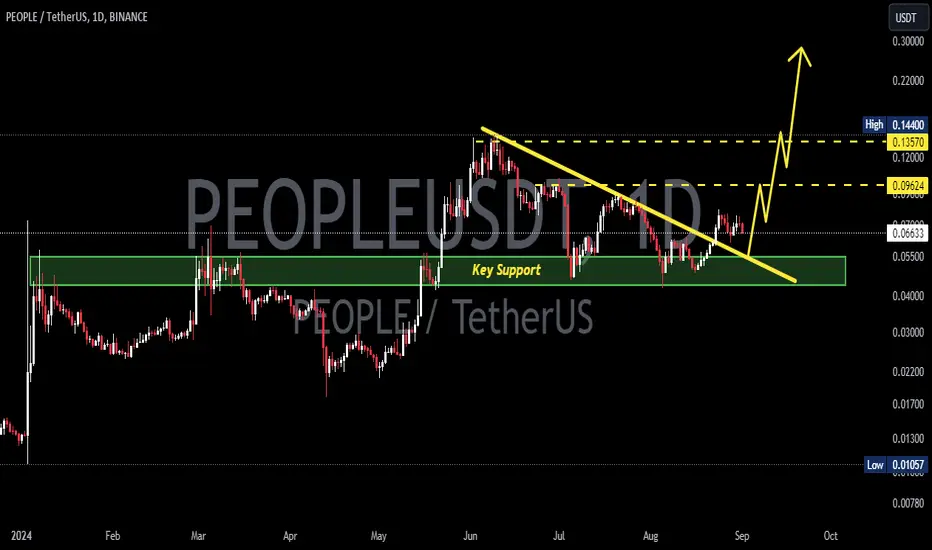
PEOPLEUSDTPEOPLE ~ 1D ✅
#PEOPLE Make purchases Gradually, We Think this is a very good Chart for now.
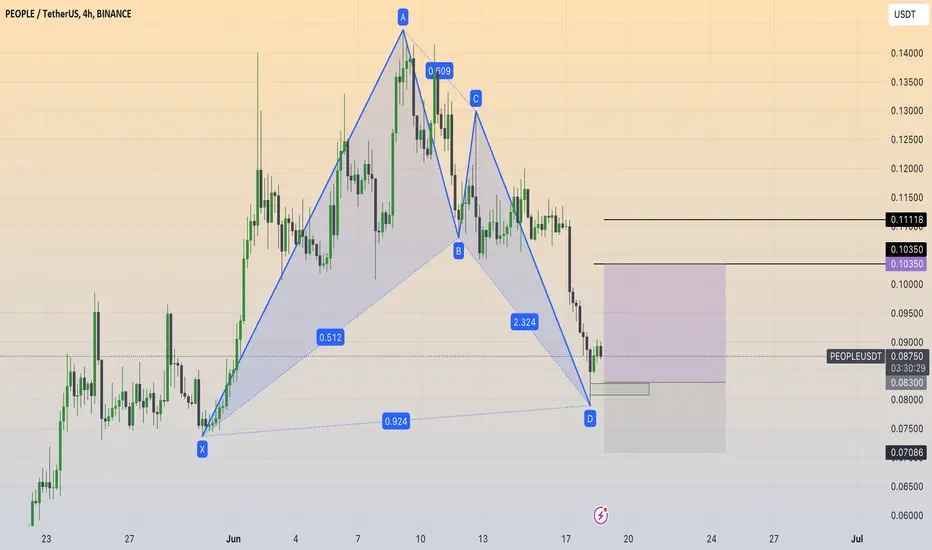
$PEOPLE LONG Risky SetupMaking bullish bat pattern and also bounced from a strong support.
But keep eye on BTC before jumping in.
Cheers 🥂
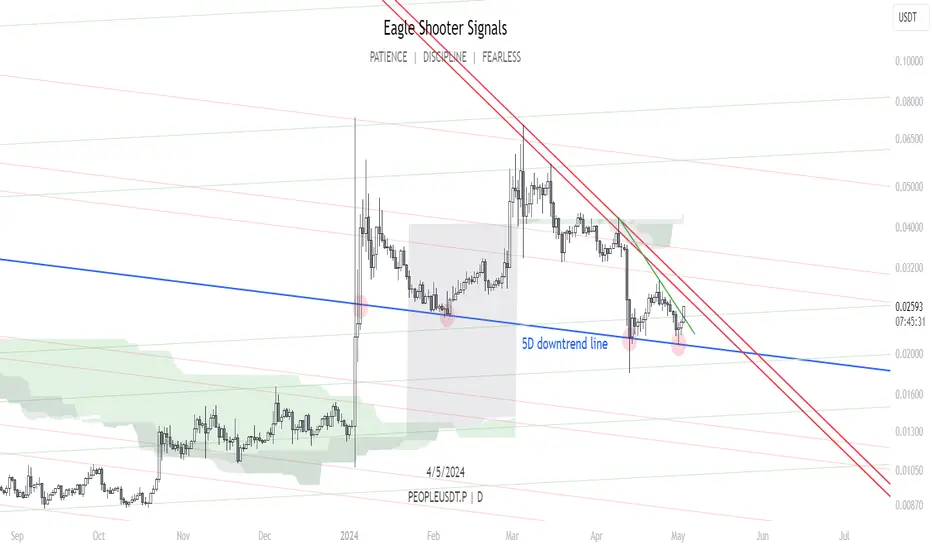
PEOPLEUSDT, We are the one!Hello, people!
This is ESS team.
Let's see the PEOPLE chart.
Chart which has been supported multiple times by the BLUE 5day's downtrend line, have recently broken through the GREEN short-term trend line and headed for the RED downtrend line.
If it breaks through the RED downtrend line and confirms retest, you can enter the long position more stably.
Even if it falls after being resisted the RED downtrend line, If it is once again supported the 5D downtrend line, It could re-take a chance for a long position.
If it breaks strongly down the BLUE downtrend line, Please note that there may be a strong bearish.