$PEPE: the big picture, 1W analysis.August 1st, 2025 – A tough day for altcoins, hit once again by tariff concerns.
But let’s talk about CRYPTOCAP:PEPE , one of my favorite altcoins to track. Why? No VC backing, the entire supply is community-held, and volume is consistently strong—making it a reliable market sentiment indicator.
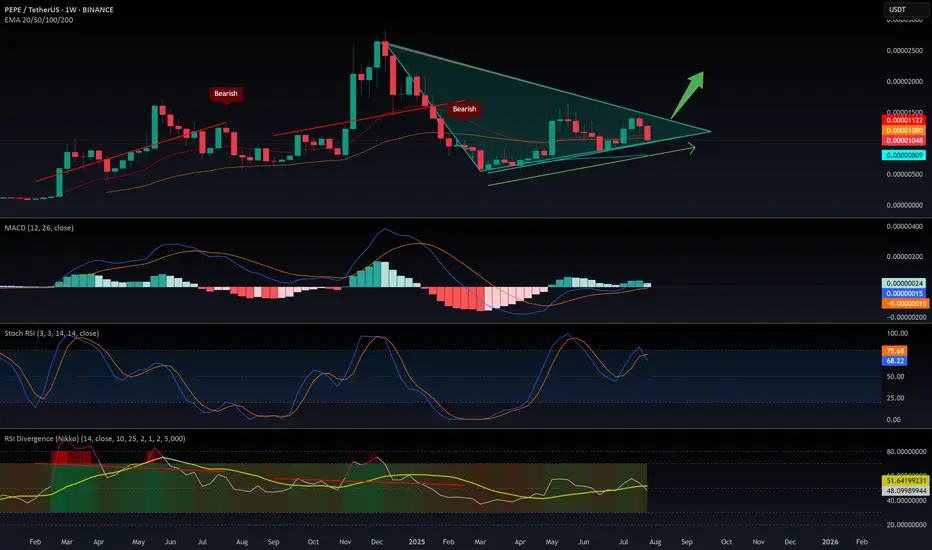
Weekly Outlook:
CRYPTOCAP:PEPE remains in a macro uptrend, riding above the 100 EMA.
- My Momentum indicator has triggered two buy signals: at 0.00000634 and 0.00001040
- RSI is rising but still mid-range—there’s plenty of room to move higher.
- MACD is gradually ramping up.
- Stochastic RSI is cooling off, but given the strength of the other signals, further downside looks limited.
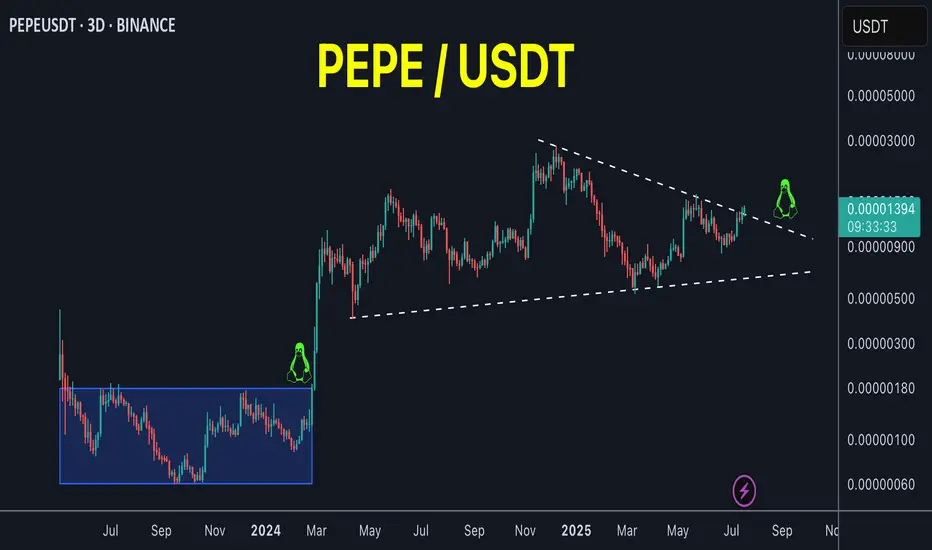
Technically, we’re seeing a bullish flag pattern. Price is currently testing support at the lower range—likely setting the stage for a decisive move in the coming weeks.
Conclusion:
Based on the current indicators and structure, the odds favor a bullish breakout and continuation of the uptrend—though, as always, DYOR.
Pepe
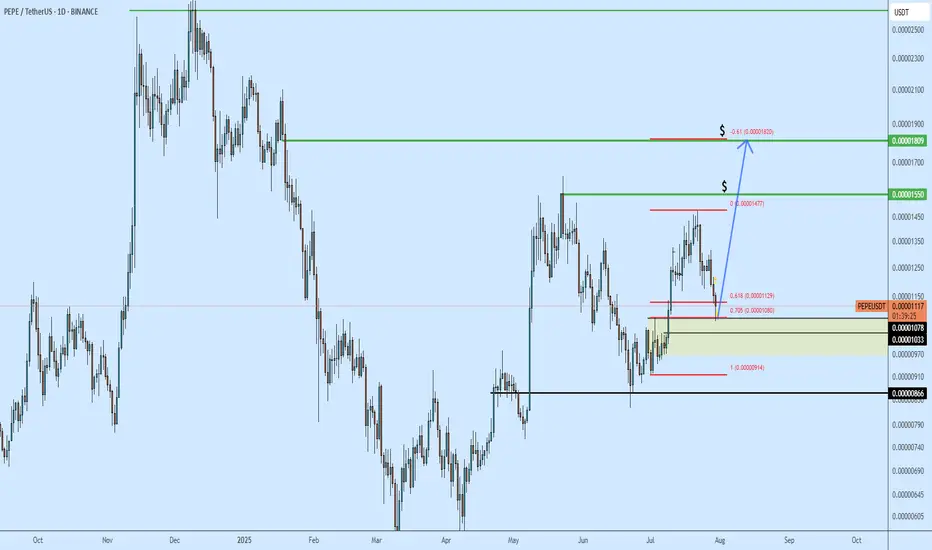
PEPE Uptrend continuation?PEPE has been trending higher over the last few weeks. Today it hit the fib level - seems to be getting a reaction. PEPE is a good hold for upside targets labeled ($).
I would keep thi bias unless we start invalidating (closing-below) 0.00000918
PEPEUSDT: Bearish Outlook After Internal Trendline BreakHello guys.
PEPE has tested the internal trendline multiple times and finally broke below it, signaling potential weakness. Price also failed to reclaim the key supply zone above.
Internal trendline broken
Rejection from a key supply zone
Potential move toward the demand zone around 0.00000262–0.00000365
Unless bulls reclaim the broken trendline and break above the recent highs, the bias remains bearish with a possible continuation to the downside.

PEPE Daily Setup Holding Strong
This is PEPE on the daily
Price recently crossed above the 50MA which is currently resting on the 200MA after a golden cross
It was rejected at the 0.5 Fib but is now holding above the 0.618 Fib as well as the 50MA and 200MA
RSI is finding support at the mid level while MACD just turned bearish
Chances are we see a pullback first, a search for support, before the next possible move up
We’ll be here to watch it unfold
Always take profits and manage risk.
Interaction is welcome.

PEPEUSDT – Downtrend Breakout & Golden Zone Retest in Play!📊 Chart Analysis:
On this daily timeframe chart of PEPEUSDT, price has successfully broken above the descending trendline that had capped the price since late 2024. This breakout is a strong early signal that bearish momentum is weakening and a potential trend reversal may be underway.
After the breakout, the price is now performing a retest at a key confluence support zone, including:
Fibonacci Retracement levels 0.5 (0.000011580) and 0.618 (0.000010835) — the Golden Zone
Previous horizontal demand zone (highlighted in yellow)
Retest of the broken descending trendline
This retest area will be crucial for determining the next directional move.
---
🐂 Bullish Scenario:
If price holds above the Fibonacci Golden Zone and forms a bullish confirmation candle, we could see a continuation of the uptrend toward:
0.000014191
0.000015000
0.000016836
0.000021533 (medium-term target)
Possibly retesting the High at 0.000028364
This would confirm the start of a major trend reversal and renewed bullish momentum.
---
🐻 Bearish Scenario:
If price fails to hold above the 0.000010835 level and breaks down below the Golden Zone:
Expect a drop toward psychological support around 0.000010000
And potentially further down to the strong support near 0.000007000
Such a move would invalidate the breakout and put PEPE back into a consolidation or extended downtrend phase.
---
🧠 Chart Pattern Notes:
Descending Trendline Breakout
Golden Zone Retest (Fibonacci 0.5 & 0.618)
Potential formation of an Inverted Head & Shoulders pattern (in early stages)
---
🎯 Conclusion:
PEPEUSDT is at a critical turning point after breaking out of a long-term downtrend. If the support at the Golden Zone holds, there is strong potential for a sustained bullish rally. However, traders should remain cautious and apply proper risk management in case of a breakdown below key levels.
#PEPEUSDT #CryptoBreakout #GoldenZoneRetest #TechnicalAnalysis #FibonacciLevels #PEPECoin #AltcoinAnalysis #TrendReversal #BullishSetup #BearishRisk

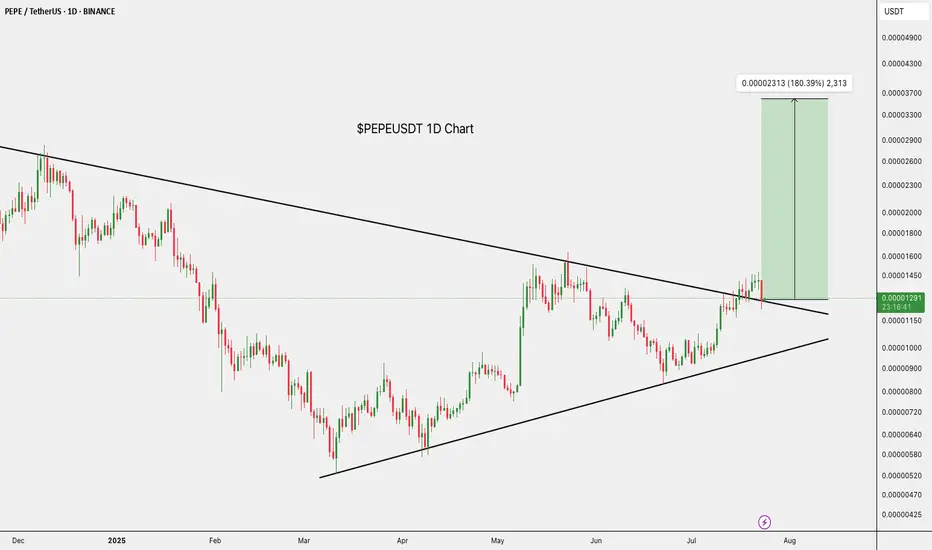
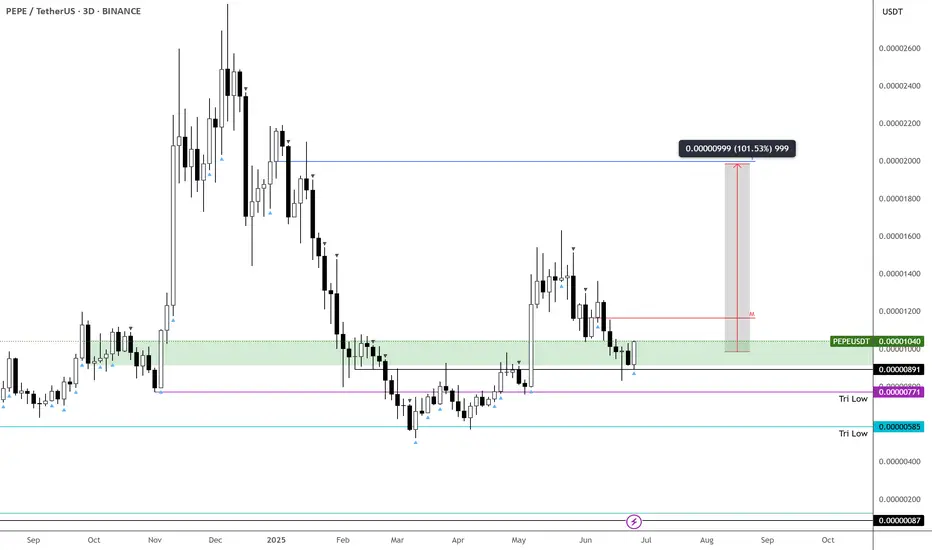
$PEPEUSDT Breakout: 180% Ahead?CRYPTOCAP:PEPE just broke out of a long-term triangle.
If the move holds, it could pump up to 0.00002313, that’s a potential 180% gain.
Watch for a retest before making a decision.
DYOR, NFA
Was that all the offseason was for Pepe?PEPE
This is not a little suspicious to me. H&S is forming on a 1-month timeframe. I also discovered 4 divergences on a 4-hour timeframe looking back at the past few weeks, which may support my assumption that this is what the off-season was all about and a longer break may be in order.

PEPE on the verge of breakout!PEPE / USDT
Price is trying to breakout massive downtrend line since 7 months
Incase of breakout we will see strong bullish momentum
Keep an eye on it
PEPE WILL WE GO TO .000035 ? Evening
so if we can break this orange level here ie this top in price action then a nice run up to .000035 makes send.
stay tuned this is wild one
what do you think Pepe will do ?
Kris/ Mindbloome Exchange

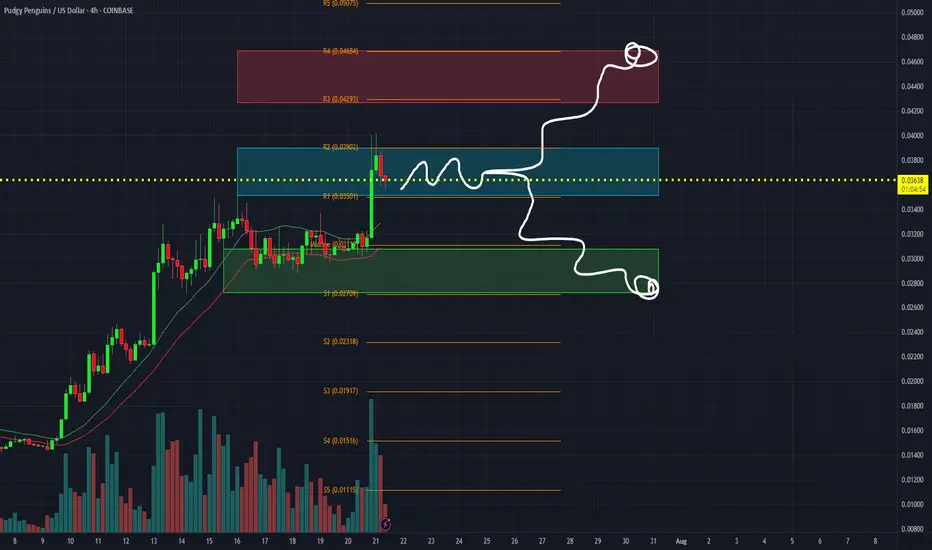
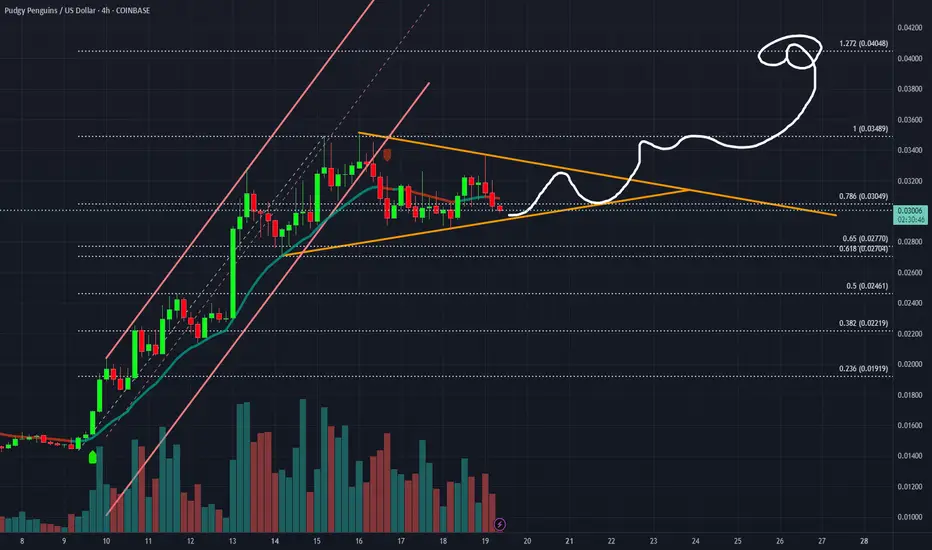
$PENGU Penguin consolidation at the moment.As long as CSECY:PENGU remains between .039 and .035 I consider it in consolidation. Breaks above or below these levels should see the targets posted.
that bozo pepe fractal is wildthe bozobenk chart has built the exact same fractal from pepe before its big pump into 2023:
steep initial climb (pole)
flag formation pullback
swept the pivot
double bottom at mid
breaking out!
pepe ran a 45x from here, supply:ratio suggests bozo will run more

$PENGU Pudgy PenguinsWithout a breakout to the DOWNside, CSECY:PENGU is still looking bullish for at least a hit to .04.
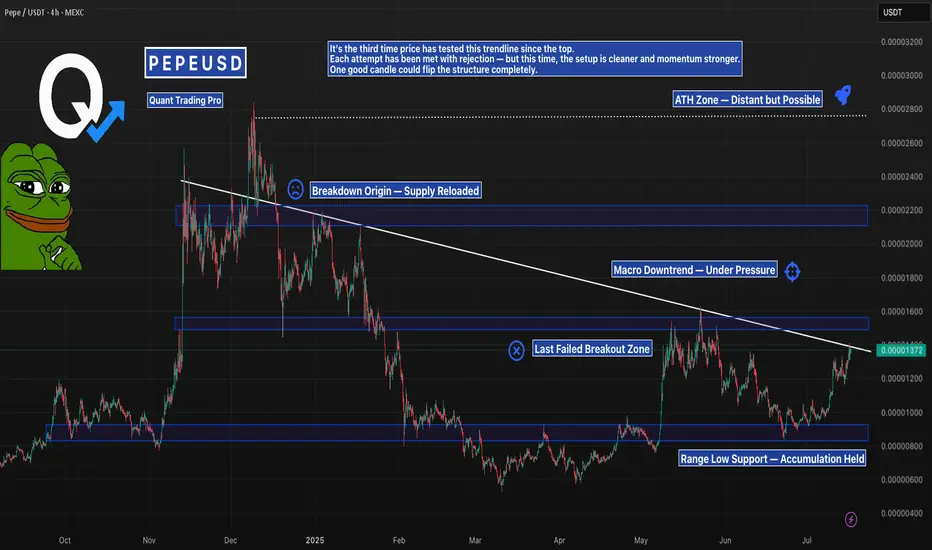
PEPE Faces Key Resistances – Is a -8% Pullback Coming?The PEPE memecoin ( BINANCE:PEPEUSDT ) is currently near the Resistance zone($0.00001392-$0.00001330) and Important Resistance lines . This is the third time that PEPE has attacked the Important Resistance lines .
In terms of Elliott wave theory , it seems that PEPE is completing the microwave 5 of the main wave 3 , so that the main wave 3 is of the extended type .
Also, we can see the Regular Divergence(RD-) between Consecutive Peaks.
I expect a -8% drop for PEPE in the coming hours.
First Target: $0.00001251
Second Target: $0.00001212
Note: Stop Loss(SL)= $0.00001400
Please respect each other's ideas and express them politely if you agree or disagree.
PEPE Analyze (PEPEUSDT), 4-hour time frame.
Be sure to follow the updated ideas.
Do not forget to put a Stop loss for your positions (For every position you want to open).
Please follow your strategy and updates; this is just my Idea, and I will gladly see your ideas in this post.
Please do not forget the ✅' like '✅ button 🙏😊 & Share it with your friends; thanks, and Trade safe.

PEPE Pressing Into Its Macro Downtrend — AgainPEPE is back at the same trendline that’s slapped it down twice before — but this third attempt comes with strength.
We’ve got higher lows, reclaimed support, and a solid grind into resistance.
Still, a macro downtrend is a macro downtrend… until it breaks.
This next move will decide if this is the real deal or just another fakeout.
#PEPE #PEPEUSDT #MemeCoinCharts #CryptoAnalysis #TrendlineTest #BacktestEverything #TradingView #QuantTradingPro #CryptoBreakout
Pepe's Bullish Bias Intensifies · 217% PP = 1085% 5X Lev.The bullish bias for PEPEUSDT is starting to intensify, still early of course. It is still early on this one because the action is still lower than the 19-May high. There are many projects that are already trading above their last high. So it is good news to find a pair that is moving below because we know that soon it will be moving above. In the coming days.
While the 19-May wick high reached 0.00001632, the weekly close happened at 0.00001361. As you can see from the chart, the current price is already higher than the highest weekly close and this gives us a strong bullish signal.
Notice again how the action moved above EMA89 back in mid-April. When the retrace happened, May-June, the recovery happened above this level. A signal of strength.
PEPEUSDT moved briefly below EMA55 only two recover and this is the second week above this level. Trading weekly above EMA55 & EMA89 means that the bullish bias is fully confirmed. A fully confirmed bullish bias means we are set to witness a higher high, and a higher high means prices moving above 0.00001953, short-term. In a matter of days.
The main target for this move is 0.00004264 giving us a nice 217%. With 5X leverage, relatively low risk, that would be beyond 11X (1,085%).
In a matter of days, the entire altcoins market will be bullish and moving higher. Make sure you are fully invested by the time everybody is rushing to buy. That is, you should be all-in now. It is not too late.
Thank you for reading and for your continued support, it is truly appreciated.
Namaste.

PEPEUSDT – Back Into the Trap Box | Fib Support BelowPEPE is retesting the same high-volume resistance that sparked a selloff in May.
With price pressing into the top box again, this becomes a key decision point.
A breakout sends us higher — but rejection could send price back toward the golden pocket between 0.00001104 and 0.00000979.
Watch the reaction closely.
This is where the next major move begins.
#PEPEUSDT #MemeCoin #SupportResistance #FibRetracement #QuantTradingPro #TradingView

4:1 R:R trade setup for PEPEAre you a fan of memes? This trade setup offers a 4:1 R:R
Entry: 0.00001308
Stop Loss: 0.000009649
Target: 0.00002679
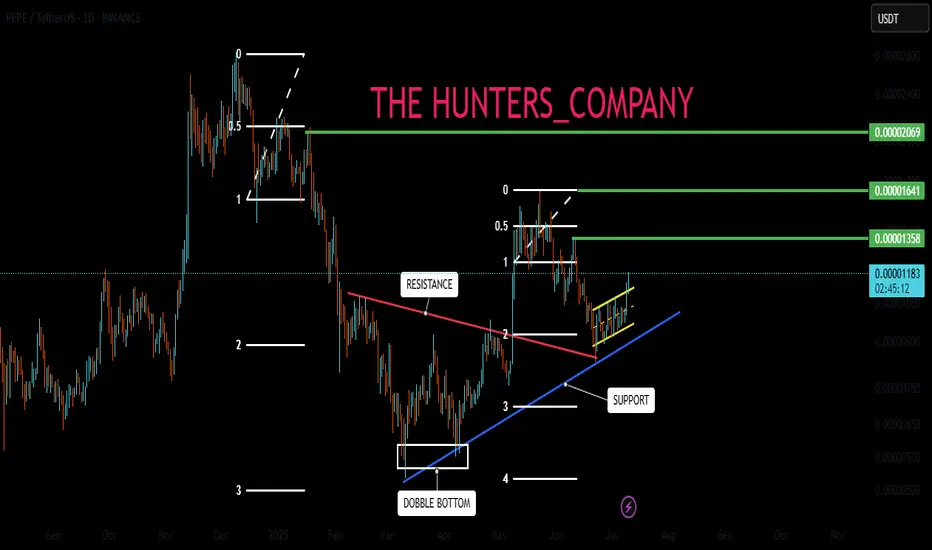
Is Pepe growing? Read the caption, it's important.Hello friends🙌
✔Some factors caused the price to fall, but in a support area that we have drawn for you with several Fibonacci waves, you can see that a classic double bottom pattern has been formed and buyers have entered.
🔊Now there is no more news of a fall and buyers have raised the price to the point where it has created a higher ceiling and floor, and this is very important and signals a change in trend.
📈Now that the price has broken the specified resistance line and is well supported by the specified support line, we can expect the price to move to the specified areas, but do not forget that the most important thing to observe in trading is capital management⚠
🔥Follow us for more signals🔥
*Trade safely with us*
Ethereum Breaks $3,000: Hype Meets UtilityEthereum (ETH) has surged above $3,000, driven by a wave of retail and institutional momentum following the presale success of Little Pepe (LILPEPE), a meme coin built on a new Ethereum-compatible Layer 2 network. With over $5 million raised during the presale, the appetite for meme-coin ecosystems continues to fuel Ethereum’s utility narrative, giving it both technical and psychological strength.
Key Levels to Watch:
• Short-term Structure (H4 Chart): ETH is currently forming a bullish flag pattern, a continuation structure that often precedes further upside.
• Upside Scenario: A confirmed breakout above $3,100 could extend the rally to $3,200, and potentially test $3,300, a level of major historical resistance.
• Downside Risk: Failure to hold current levels may see ETH retrace back toward $2,900, with the 50% Fibonacci retracement at $2,600 acting as the next support zone.
If sentiment in the broader crypto market remains elevated and Bitcoin holds firm near all-time highs, Ethereum’s bullish setup may have further room to run.

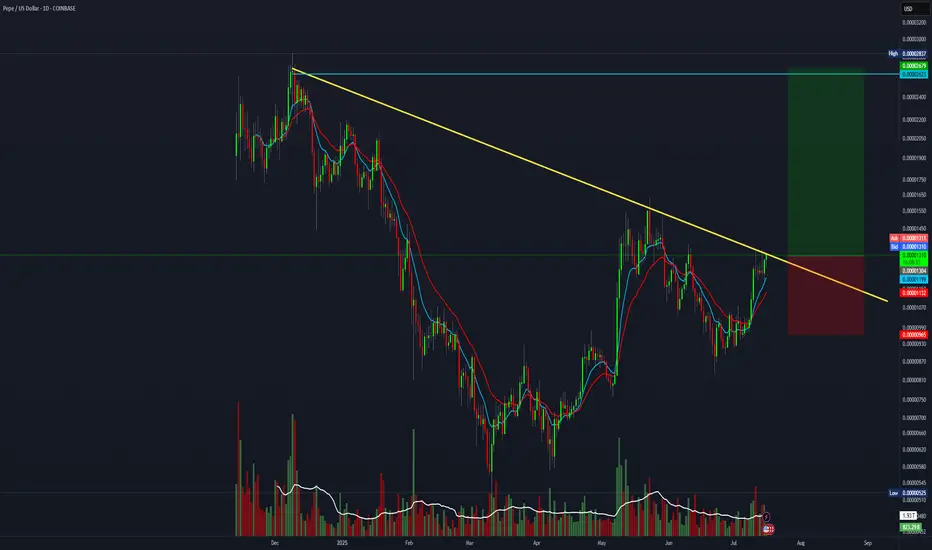
PEPE – Strongest Setup Among Top Meme Coins
Out of the higher-cap meme coins, I’m leaning more toward $PEPEUSDT.
From a price action perspective, it’s showing more strength than CRYPTOCAP:DOGE , CRYPTOCAP:SHIB , and $WIF. That’s not to say the others won’t pump—but personally, CRYPTOCAP:PEPE looks the most appealing here.
The green box is a solid area to build a position. It’s held the trimester lows well and continues to test them while responding bullishly.
Let’s see how it plays out over the next two months—but I like the odds of upside from here.
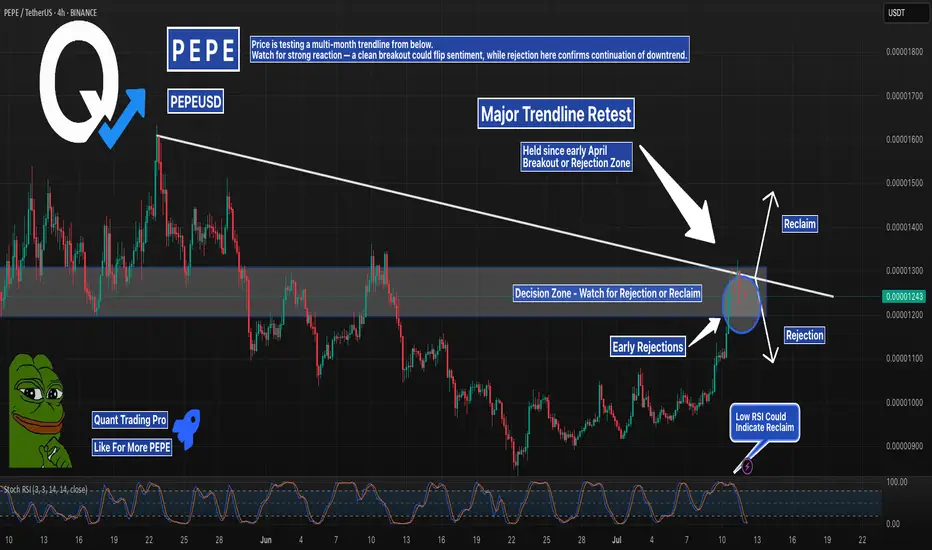
PEPE Trendline Retest – Reclaim Incoming or Final Rejection?PEPE is testing a major descending trendline that has capped price action since early April. After a strong breakout push, price is now consolidating directly under this resistance — inside a tight decision zone.
We’re watching for one of two outcomes:
A reclaim of the trendline + confirmation = potential continuation toward 0.00001350+
A rejection from this level could signal another leg down, continuing the macro bearish trend
🧠 Note: Stoch RSI is reset, hinting that bulls could make another attempt.
📍 Key Levels:
🔼 Reclaim above 0.00001317 = bullish breakout
🔽 Breakdown below 0.00001200 = rejection confirmed
This level will define the next major move.
#PEPE #PEPEUSDT #TrendlineTest #CryptoBreakout #ReclaimSetup #AltcoinWatch #QuantTradingPro #TradingView
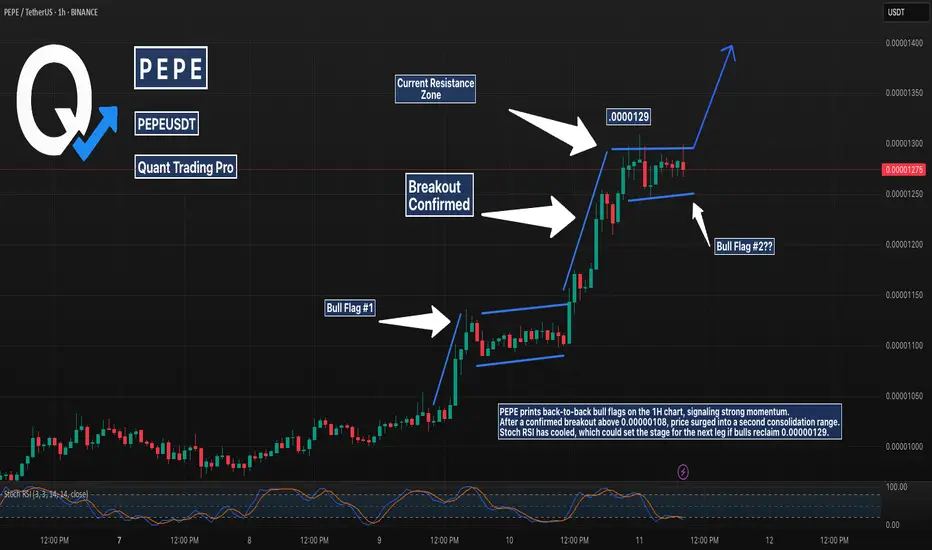
PEPE Breakout Sequence – Double Flag Pattern Forming?PEPE continues its breakout sequence on the 1H chart, forming a classic bull flag followed by another possible setup in real time. The first breakout above 0.00000108 triggered strong follow-through. Now, a second flag is forming just under 0.00000130. With Stoch RSI cooling down, this could be the reset needed for continuation.
📍 Watch for confirmation above 0.00000129 to validate the next leg.
#PEPE #BullFlag #Altcoins #MomentumTrading #QuantTradingPro #CryptoBreakout #TradingView
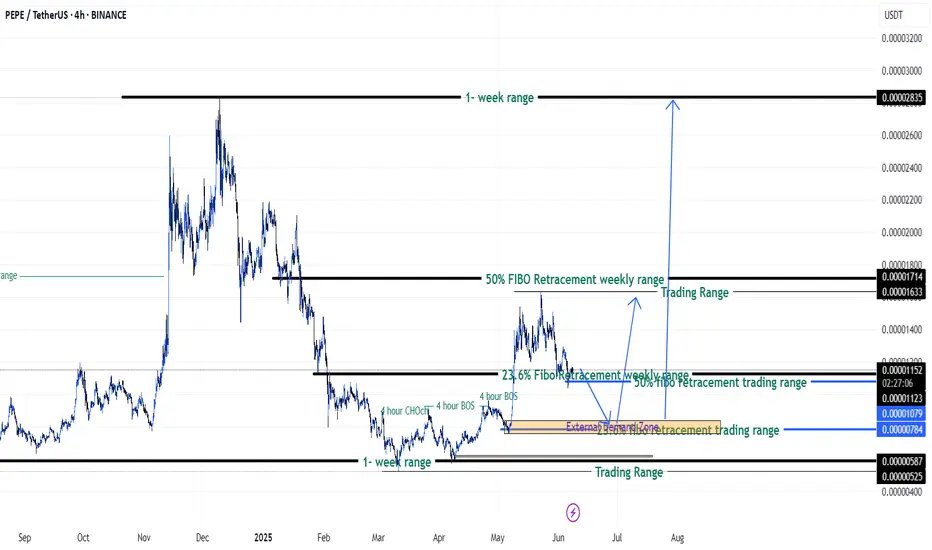
PEPEUSD going to moon according to my analysis. {08/june/2025}Educational Analysis says that PEPEUSD may give trend Trading opportunities from this range, according to my technical analysis.
Broker - binance
So, my analysis is based on a top-down approach from weekly to trend range to internal trend range.
So my analysis comprises of two structures: 1) Break of structure on weekly range and 2) Trading Range to fill the remaining fair value gap
Let's see what this pair brings to the table for us in the future.
Please check the comment section to see how this turned out.
DISCLAIMER:-
This is not an entry signal. THIS IS FOR EDUCATIONAL PURPOSES ONLY.
I HAVE NO CONCERNS WITH YOUR PROFIT OR LOSS,
Happy Trading, Fx Dollars.