Pepe 5X Lev. Full PREMIUM Trade-Numbers (PP: 1670%)The market always offers a second chance. The full trade-numbers below have targets up to 0.00003381 for a maximum profits potential for 1670%. The chart goes higher and reaches 2235% (0.00004264) and 3715% at 0.00006575.
How far up it goes and how fast is for the market to decide.
These trade setups are good if we can catch the bullish breakout, once the breakout is in, the rest is an easy wait.
I know some people that are happy to secure their trades after 200-300%, some even at 100%. Others wait long-term because these are awesome chart setups and can reach much higher. In past cycles we've done trades with more than 10X easily. This is one of those.
The question is, will it hit or will it fall?
The market always offers a second chance and a second chance is upon us, now.
Full trade-numbers below:
_____
LONG PEPEUSDT
Leverage: 5X
Entry levels:
1) 0.00000810
2) 0.00000715
3) 0.00000690
4) 0.00000630
Targets:
3) 0.00000867
4) 0.00001071
5) 0.00001222
6) 0.00001408
7) 0.00001681
8) 0.00001953
9) 0.00002342
10) 0.00002836
11) 0.00003381
Stop-loss:
Close weekly below 0.00000625
Potential profits: 1670%
Capital allocation: 5%
_____
Why Pepe and not some other Altcoin?
I shared trade-numbers for you for pairs as varied as Bitcoin and Ethereum, Notcoin and Dogs, Solana and Filecoin, Pepe, EOS, XRP, Cardano and Compound, to name a few. The truth is that I pick what in the moment looks good.
Market conditions can always change, but at the time of writing the chart looks great.
Notice that the action is 100% full red, that's the time to buy as I always remind and say; Buy when prices are low or trading near support; buy when the market is red.
The market is red now and that's the time to buy before a reversal happens. You will see, our time to sell comes when the market turns green.
Many average players will do it in reverse, right now they are selling and they will buy at the top of the bullish wave. I know, it is tempting, it is the market impulse but we have to learn to control our emotions if want success in this game.
There is risk involved. Leveraged trading is for experts only.
Thanks a lot for your continued support.
Namaste.
Pepe

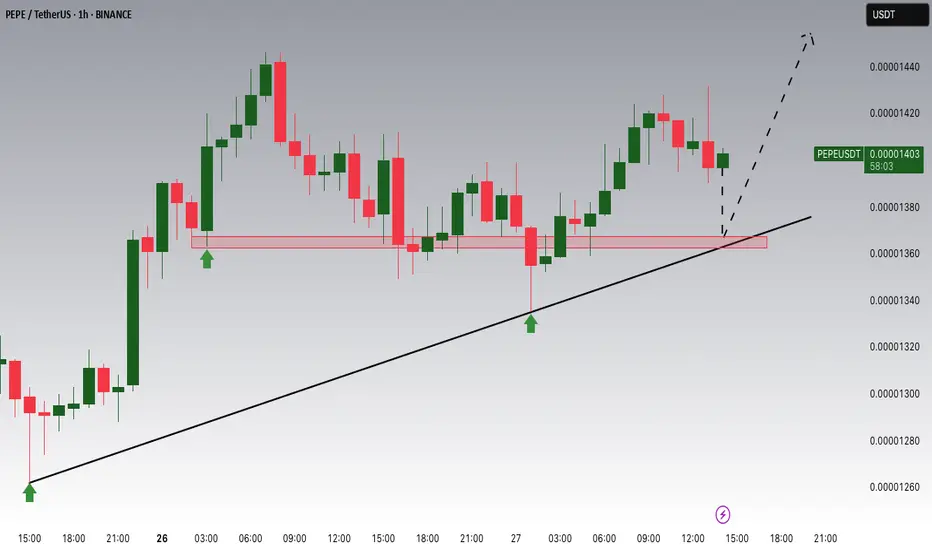
PEPE/USDT Potential UpsidesHey Traders, in today's trading session we are monitoring PEPE/USDT for a buying opportunity around 0.00001360 zone, PEPE/USDT is trading in an uptrend and currently is in a correction phase in which it is approaching the trend at 0.00001360 support and resistance area.
Trade safe, Joe.
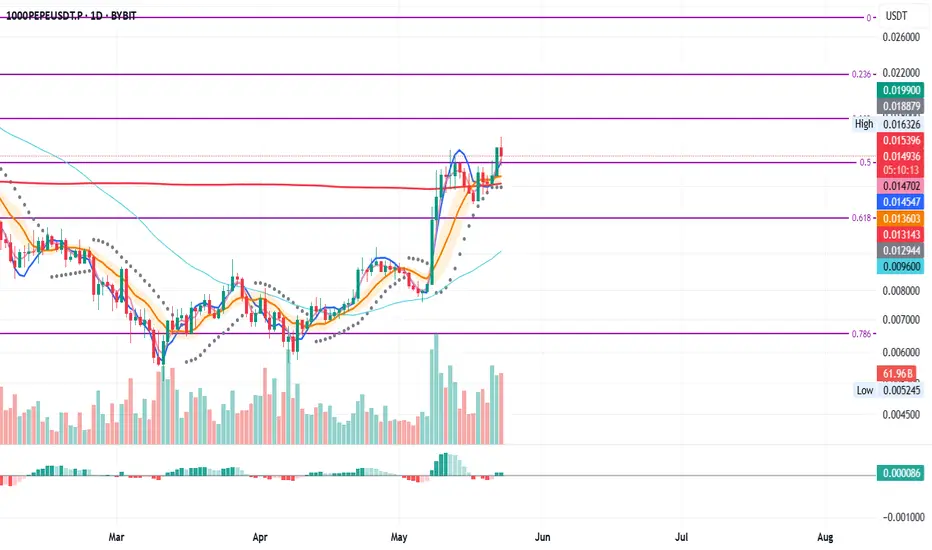
Phemex Analysis #84: Pro Tips for Trading PEPEIn the vibrant and ever-changing landscape of cryptocurrency trading, PEPE ( PHEMEX:1000PEPEUSDT.P ) has recently captured significant attention from investors. Over the past 30 days, PEPE surged an impressive 130%, showcasing strong bullish momentum after a prolonged downtrend. This recent rally has rekindled investor interest, suggesting that a potential bullish reversal may be underway.
Yet, with volatility remaining high, traders should remain cautious.
Let’s explore several possible price scenarios and strategies to capitalize effectively on PEPE’s movements.
Possible Scenarios
1. Accumulation Followed by Breakout Rise
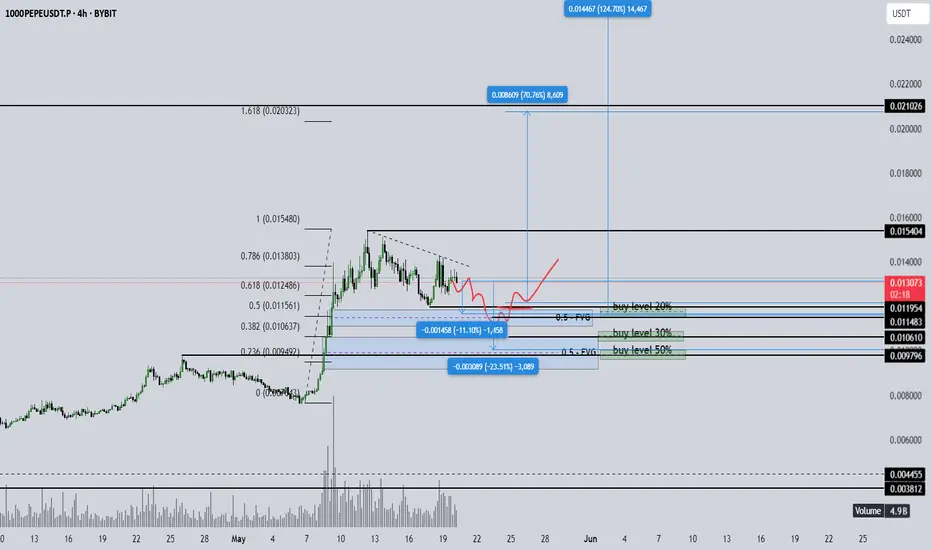
Currently, PEPE is showing signs of accumulation in the $0.015 to $0.012 range. This sideways consolidation typically indicates that market participants are gathering positions before a potentially significant upward move. If PEPE breaks decisively above the critical resistance at $0.0163, especially accompanied by a notable spike in trading volume, it would be a strong confirmation of bullish sentiment.
Pro Tips:
Entry Strategy: Consider accumulating positions within the consolidation range ($0.015 - $0.012). Wait for confirmation of a breakout above $0.0163 to scale up your positions confidently.
Risk Management: Place stop-loss orders below $0.012 to mitigate downside risk should the breakout fail to materialize.
2. Retesting the $0.007 Support Area
A pullback scenario could also unfold, bringing PEPE’s price down to retest the critical support zone around $0.007. If this retest occurs with relatively low trading volume and the RSI remains higher compared to previous lows—signaling a Double Bottom formation with RSI divergence—this could provide an excellent accumulation opportunity.
Pro Tips:
Accumulation Signals: Monitor trading volume and RSI closely. A successful retest at $0.007 with bullish divergence could indicate strong buying pressure.
Entry Confirmation: Conservative traders may prefer waiting for a confirmed breakout upward from the $0.007 support area before entering positions.
3. Bearish Drop Scenario
Despite the recent bullish signs, a bearish scenario remains possible. If PEPE declines towards the support level at $0.012 with increasing trading volume, and subsequently drops to $0.007 with even higher volume, it could indicate strong bearish momentum and weak market sentiment. Under these conditions, caution is highly recommended.
Pro Tips:
Market Caution: If price action unfolds this way, it’s advisable to refrain from entering positions immediately.
Wait and Observe: Allow price to stabilize before reconsidering any potential entry points, ensuring clear evidence of support.
Conclusion
PEPE’s recent 130% surge represents promising signs of a bullish reversal, yet navigating such volatility demands careful planning and strategic execution. By closely monitoring the outlined scenarios—recognizing accumulation signals, bullish divergences, and maintaining disciplined risk management—traders can maximize their potential returns while minimizing risk exposure. Always stay alert, responsive to market signals, and ready to adapt to changing conditions to trade PEPE confidently and profitably.
Tips:
Trade Smarter, Not Harder with Phemex. Benefit from cutting-edge features like multiple watchlists, basket orders, and real-time strategy adjustments. Our unique scaled order system and iceberg order functionality give you a competitive edge.
Disclaimer: This is NOT financial or investment advice. Please conduct your own research (DYOR). Phemex is not responsible, directly or indirectly, for any damage or loss incurred or claimed to be caused by or in association with the use of or reliance on any content, goods, or services mentioned in this article.

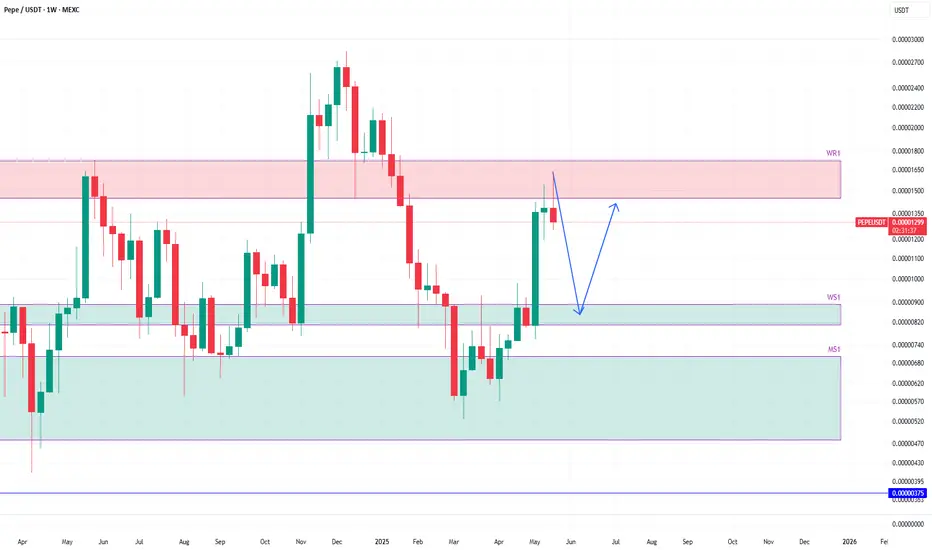
PEPEUSDT heading towards weekly supportThis is something I shared last year for PEPEUSDT. The price had hit monthly resistance MS1 and bounced from there towards weekly resistance WR1.
The current price action says it is in pullback mode of the current move up that we experienced for a few weeks.
I think the price will continue this pullback towards weekly support WS1 where the price will bounce. However, we have be watchful if the price attempts again at WR1 and succeeds before reaching to WR1.
If the price, hits WR1, a long is a very high probability trade and I will share a long setup there.
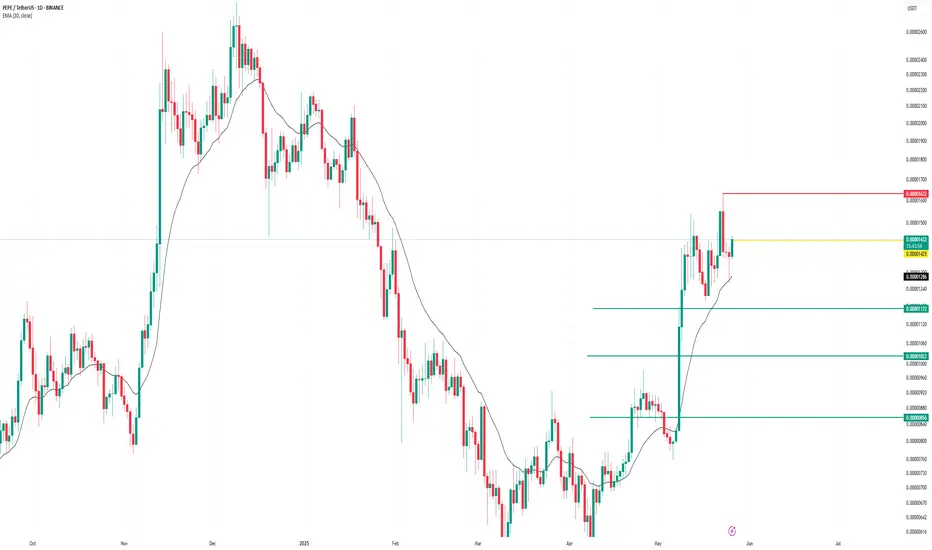
PEPE Daily – Testing Key Fib Support
After getting rejected at the 0.5 Fibonacci level on May 14, PEPE is now retesting it as support.
On the way down, price found support at the 200MA, even after briefly closing below it on the daily chart.
You could argue MLR > SMA, but both are still above the BB center and the 200MA, which maintains the overall bullish structure.
⚠️ Watch for a daily close below the 0.5 Fib—that would weaken the structure and could lead to further downside.
Look closer at smaller time frames.
Thanks for reading—if you found this engaging, react or comment.
Always manage risk and take profits. 📊
Impulse or Illusion? Key Level to Watch If you find this information inspiring/helpful, please consider a boost and follow! Any questions or comments, please leave a comment!
Recap
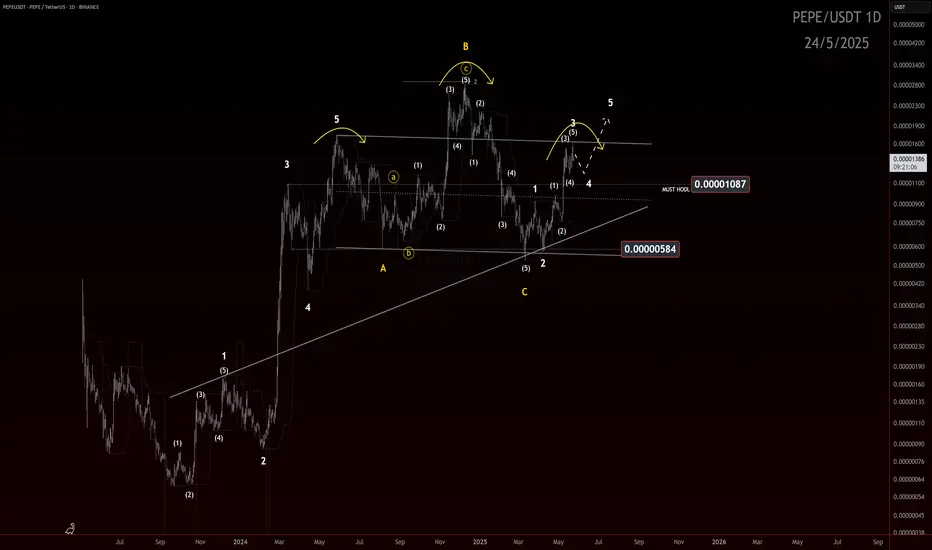
Since the price surge off the March 11 low, structure appears to be developing into a potential 5-wave impulse. However, with only three legs printed so far, it remains premature to confirm the full impulse structure.
Structure Assessment
The move resembles a possible ABC zigzag, but the center leg (possible wave 3) is showing strong impulsive characteristics — momentum, follow-through, and vertical lift. That raises the probability of it being an unfolding wave 3, rather than just a C wave.
What’s missing? A clear wave 4.
Until a fourth wave correction is established, and followed by a decisive wave 5, the bullish impulsive count remains tentative.
Outlook
📌 Key level: 0.00001087
The hold of this level will make the look of the structure ideal.
A break below 0.00001087 would dip into unacceptable territory for a developing wave 4 and opens the door to a bearish reassessment — and if the PA enters the price territory of the wave 1 cause a conclusive invalidation of the potential impulse.
✅ If price holds the level and a shallow wave 4 consolidates, we can then watch for signs of wave 5 to confirm the impulse and unlock bullish continuation potential.
Watch this level. Structure will confirm or collapse soon. More updates to follow.
Trade safe, trade smart, trade clarity.
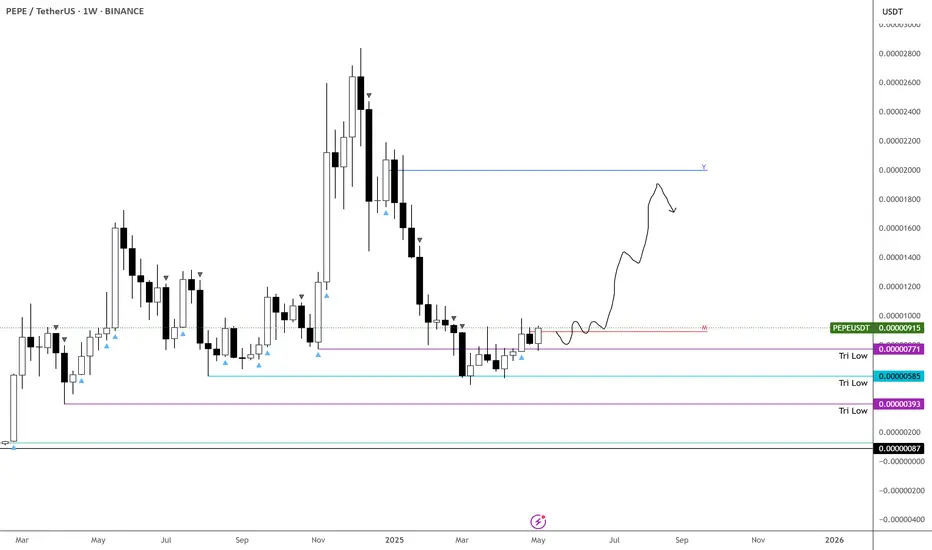
Pepe Hits New Daily High, What Now?Pepe just hit a new high today, and the highest price since late January 2025. A full correction recovery is now in place but the action is never flat on this pair. We can see down-waves and up-waves. It alternates.
This new high is good. It is not so strong but still, slow and steady growth which is bullish. Trading volume is still low which at this point we take as a continuation signal, which means that there is plenty of room left available for additional growth.
Imagine this pair keeps rising and rising, still low volume. When huge volume comes in, that's when the strong advance will happen and we see 200-300% in a matter of days. While the rest of the time, months and months of growth, the pair is always growing but slowly. That is why patience is key.
See this, PEPEUSDT has grown by almost 200% since its March/April low, wow. And it will continue growing.
Thanks a lot for your continued support.
You can see the related publications for the full trade-numbers with leverage for this pair.
Thank you for reading.
Namaste.
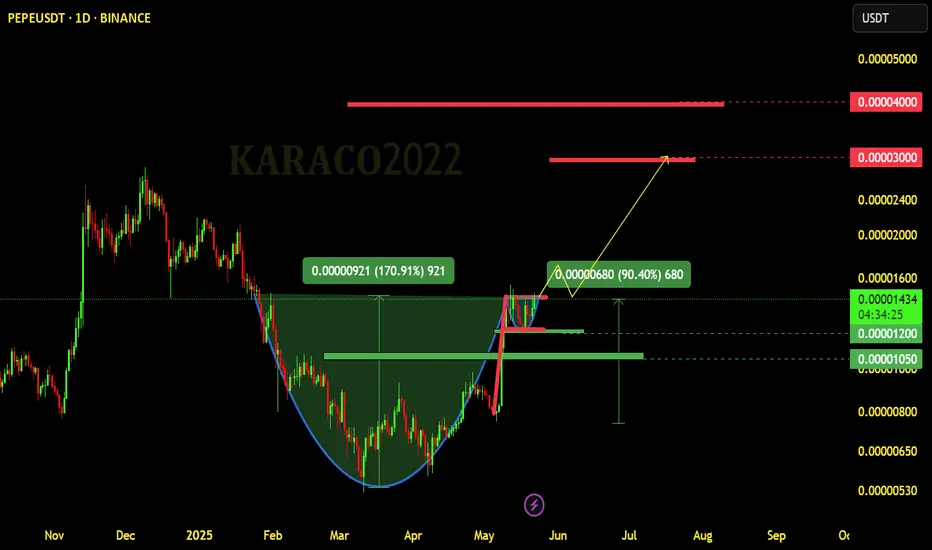
PEPE Technical Analysis – Daily TimeframePEPE Technical Analysis – Daily Timeframe
PEPE is currently forming two strong bullish technical patterns, both suggesting significant upside potential if a key resistance level is broken with confirmation.
📌 Scenario 1 : Bullish Flag Pattern
If the price breaks and holds above the $0.00001500 resistance on the daily timeframe, the bullish flag pattern may become active.
This pattern projects a potential move toward the $0.00003000 level, which aligns with the previous all-time high (ATH).
📈 Estimated upside: +90% from the current price.
📌 Scenario 2 : Cup Formation
In the broader structure, PEPE appears to be forming a cup pattern.
A confirmed breakout above $0.00001500 could open the door to a new all-time high around the $0.00004000 level.
📈 Estimated upside: +170%, assuming full pattern completion.
✅ In both scenarios, a strong breakout above $0.00001500 with volume is the key condition for bullish continuation.
Until then, short-term volatility or consolidation remains possible.
📌 This analysis is for educational and informational purposes only and does not constitute financial advice.
This cryptocurrency has two key support levels.
As long as the price remains above these supports, there is still hope for a potential reversal and continuation of the uptrend.
The first support is at $0.00001200
The second support is at $0.00001050
📝 Follow me for updates and more crypto analyses.
PEPE AGAIN!!!Hello friends
Considering the good growth we had, you can see that the price has made a correction and entered a range after reaching its ceiling.
Now, with the price correction, there is a good opportunity to buy in a pipeline and with capital management and move with it to the specified goals.
*Trade safely with us*
PEPE key levelsBINANCE:PEPEUSDT
The chart shows partial zones for buying this asset.
Further on there will be a good profit to risk ratio.
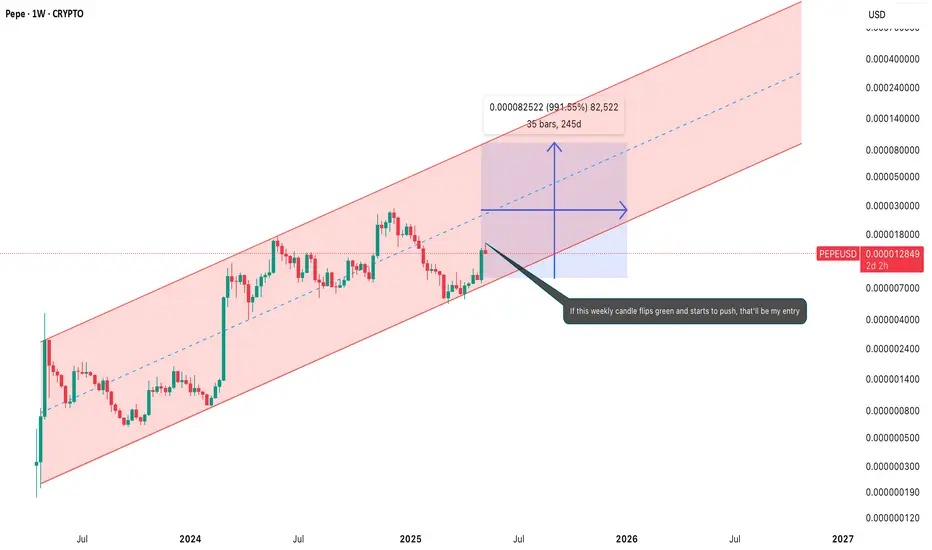
Is this how I should outperform bitcoin? $PEPE-trending channel
-log scale (weekly candles)
-PEPE was first listed April 2023, this will be its first bull
-this is bitcoins world and we're just living in it, when it climbs, this upside is available to be captured
-price rising up its upper channel gets you 1000% (a reasonable target) (much higher upside probable)
-blue box is dated until last week Dec 2025
Is this a trade you'd be willing to take modern man?
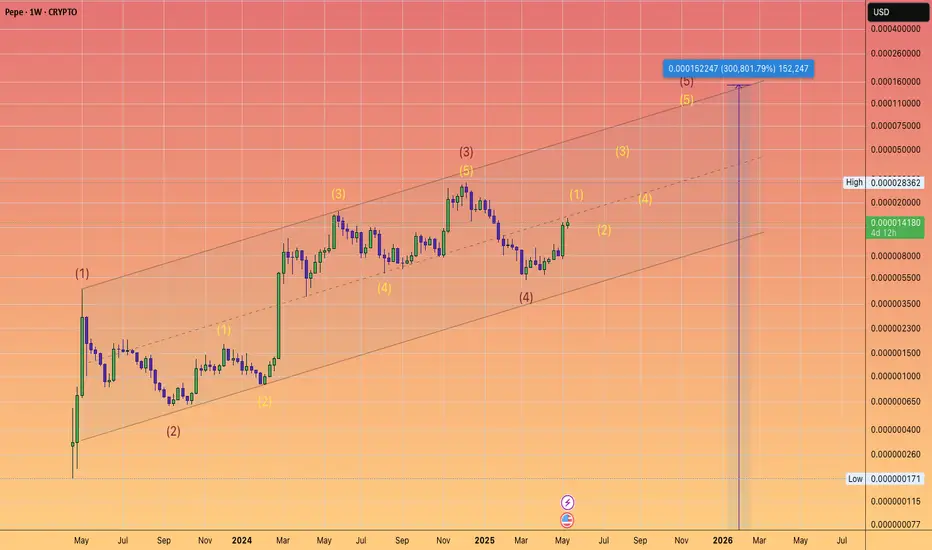
PEPEUSD broke and closed last week above its 1week MA50.Inside its historic Channel Up, this is the earliest confirmed buy signal and last time it priced the bottom of the pattern, confirming the start of the new bullish leg.
Note also that it just formed a Bullish Cross on the 1week MACD.
Last time the whole wave peaked at a massive +2756%. Repeating that gives 0.0001400 and that can be achieved by the end of the year.
Follow us, like the idea and leave a comment below!!

Could PEPE reach a staggering 3000X and hit a market cap of 69B...this year?
YES 69 BILLION Dollars for a Frog coin!
To assess the potential growth of a cryptocurrency, we first need to identify its all-time low price.
Coinpedia reports that PEPE's all-time low was $0.00000005514 on ETH via Uniswap on April 18, 2023, marking the lowest price recorded on a decentralized exchange.
For PEPE to achieve a 3000X increase, it would need to rise to $0.00016542 by December 31st.
Given its current price of $0.000014238, this represents an 11.5X increase from its present value.
With a total supply of 420.69 trillion tokens, reaching the target price would result in a market cap of $69.58 billion.
While this may seem ambitious for a memecoin lacking utility, the idea of hitting such a whimsical market cap is tempting.
I estimate the likelihood of this happening at around 2.5%.
(This scenario also suggests a reasonable portfolio allocation for those primarily holding #BTC and #ETH and I highly suggest rebalancing above 5%)
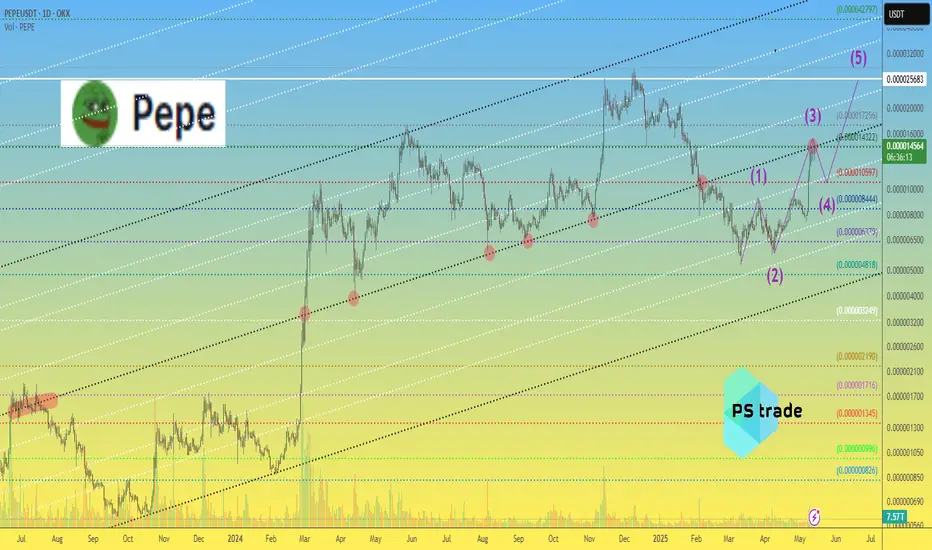
PEPE price analysisCRYPTOCAP:PEPE price has grown quite well over the past month.
Now the OKX:PEPEUSDT price, in our opinion, has reached a critical point from where it would be appropriate to correct a bit before continuing to grow:
1️⃣ correction to $0.0000100-0.0000105 can be considered “delicate”, which will only confirm the strength and serious further intentions of buyers.
2️⃣ correction to $0.0000084-0.0000085 can be considered “on the verge of a foul”, but the upward trend will continue and will not be broken.
3️⃣ or do you think there is no time for corrections, and we should continue to grow to ATH right now?
_____________________
Did you like our analysis? Leave a comment, like, and follow to get more
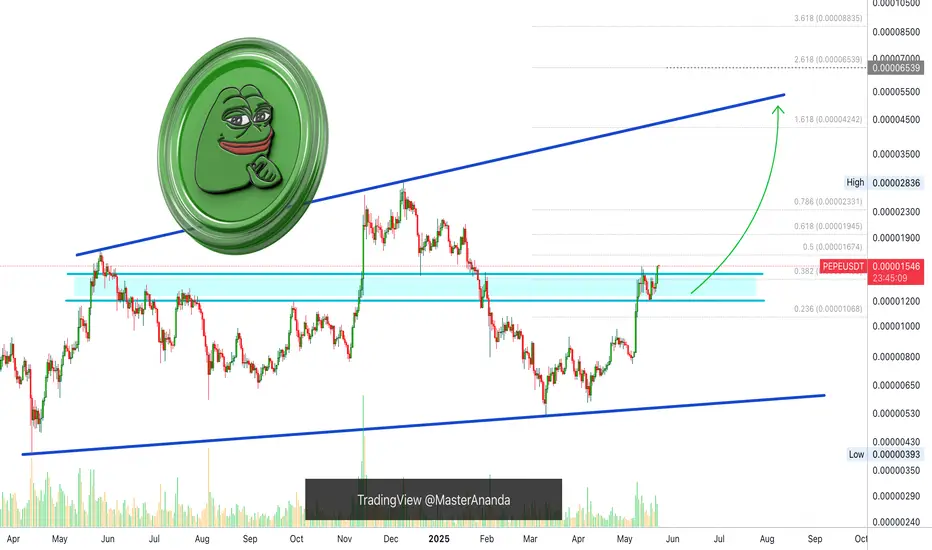
PEPE – 2x Move Looks ImminentOne of the strongest alt structures right now.
Given how well it’s held previous swing lows—and the recent deviation and retest—it’s pretty clear where this is headed.
This is a longer-term play. It might take weeks to reach the yearly open, where I’ll look to offload, or slightly earlier depending on how it reacts to the weekly block.
Also worth noting: PEPE is one of the few alts still maintaining an active weekly uptrend.
BINANCE:PEPEUSDT CRYPTOCAP:PEPE
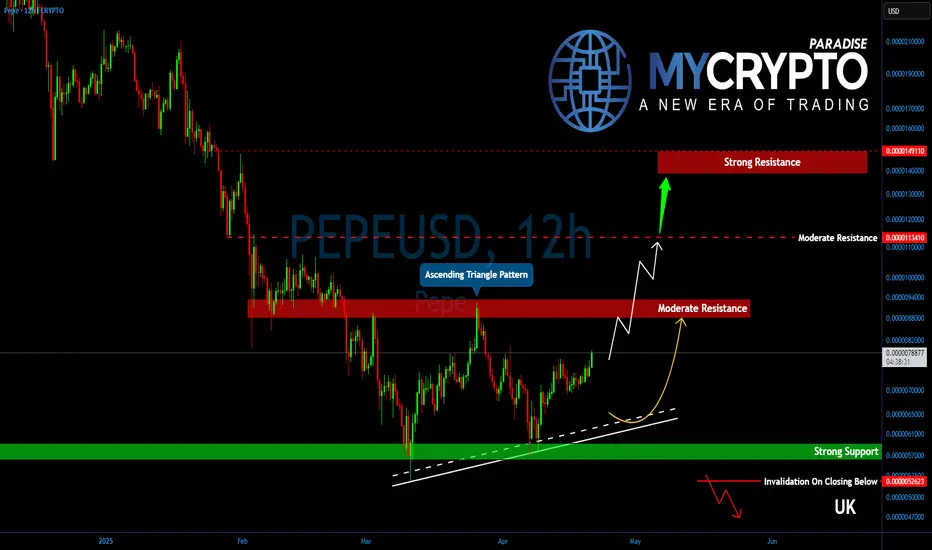
Is PEPE About to Explode? Critical Breakout Level Incoming!Yello, Paradisers! Are you ready for what could be the breakout #PEPE bulls have been waiting for since February?
💎After a long, painful downside grind, PEPE is finally shaping up for a potential bullish reversal. The price action has entered an ascending triangle, often a reliable pattern that hints at an incoming breakout. This setup is now flashing signals that momentum is shifting but it all hinges on one critical zone.
💎#PEPEUSDT is currently eyeing the $0.0000088 – $0.0000090 region, a heavy resistance that’s proven itself multiple times since February 24th. Bulls have failed to conquer this level on several occasions, and now, the 12-hour EMA-200 is also sitting in this area, a dynamic resistance reinforcing this as a crucial inflection point.
💎If the bulls can finally break through $0.0000090 with clear volume confirmation, PEPE could open up upside potential towards $0.00001135. This level is likely to attract some short-term profit-taking, but if momentum holds, we could see a push towards the much stronger $0.00001400 – $0.00001490 zone. This region lines up with a multi-point confluence, including a significant horizontal resistance and the 38.20% Fibonacci retracement level — both strong technical barriers that may define the next major move.
💎Support is also well-defined for now. The 12-hour EMA-50 is acting as dynamic support and currently sits around the $0.00000720 level. PEPE has been respecting this level well, and any temporary pullbacks may bounce from here. Below this, the $0.00000650 – $0.00000570 range remains the key support zone. This zone held firm during the last dips and is likely to absorb any upcoming selling pressure if the breakout fails short-term.
Paradisers, strive for consistency, not quick profits. Treat the market as a businessman, not as a gambler.
MyCryptoParadise
iFeel the success🌴
Is PEPE Ready for Its Next Leg Up? Key Support Levels to Watch! PEPE/USDT Analysis: Bullish Trend, Pullback, and Opportunity 🚀🐸
👋 Today, I’m taking a look at the PEPE/USDT chart. We’ve seen PEPE in a strong bullish trend lately, riding a strong momentum wave. Theres a shift at the moment when you look at the broader market—US dollar strength is still in play, and we’re seeing some pullbacks in Bitcoin and other major cryptos. 💵📉
PEPE is starting to pull back. This isn’t a bad thing—in fact, healthy pullbacks are what set up the next big moves. What I’m watching for is a retracement down into a key support zone. If price can hold there and we see a bullish break of structure, that’s my cue to look for a buy opportunity. 🛑➡️📈
The key here is patience. I want to see confirmation that buyers are stepping back in—i.e. strong bullish candles, a clear break of the recent lower high (BoS), or even a spike in volume. If we get that, I’ll be ready to ride the next leg up. Until then, I’m biding my time and letting the market come to me. 🕰️
Remember, no FOMO—let the setup come to you, and always manage your risk.🍀

PEPE/USDT Potential UpsdesHey Traders, in today's trading session we are monitoring PEPE/USDT for a buying opportunity around 0.00001260 zone, PEPE/USDT is trading in an uptrend and currently is in a correction phase in which it is approaching the trend at 0.00001260 support and resistance area.
Trade safe, Joe.

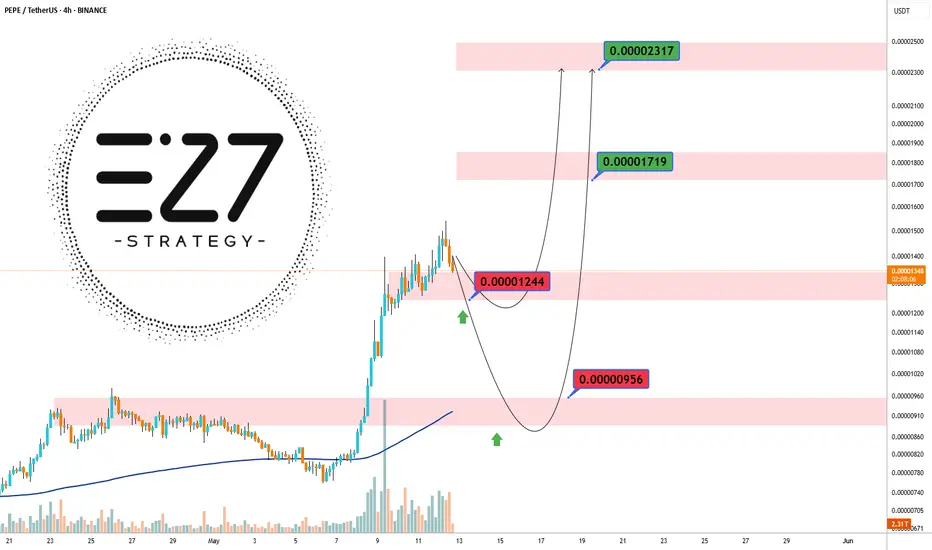
PEPE 80% Profit🚀 BINANCE:PEPEUSDT just made a big move!
It surged from 0.00000820 to 0.00001244 and then corrected to 0.00000956 📉
Now it’s sitting on strong support — and if it holds, another rally could be on the way! 💥
🎯 Next resistance levels:
0.00001244 (recent high)
0.00001719 (next key level)
0.00002317 (major long-term target) 🏁
📌 Key support zones:
0.00000956 (current support)
0.00000820 (late May support)
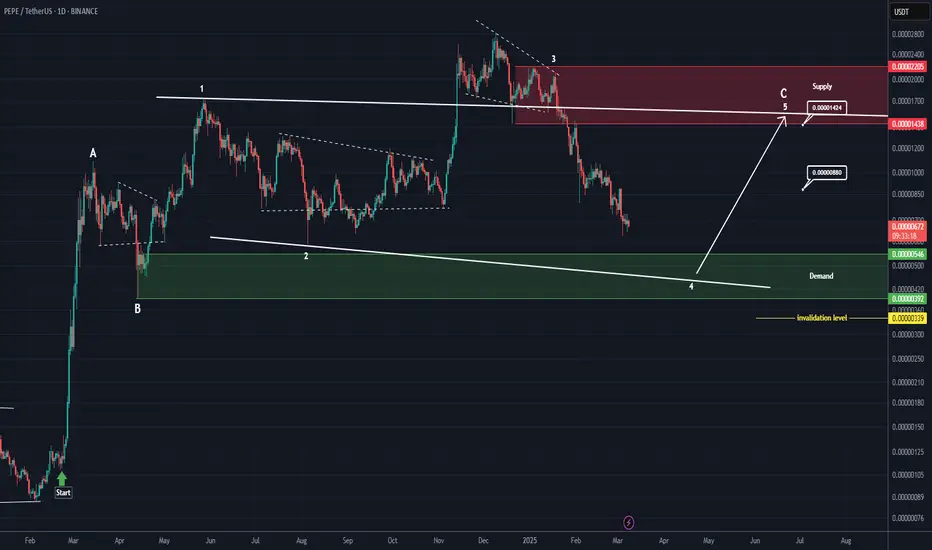
PEPE will be bullish soon (12H)It appears that we have an ABC pattern on the chart, with wave C forming as a terminal wave.
Currently, we seem to be in wave 4 of C. Wave 4 may complete within the green zone, leading to wave 5 of C, which is a bullish wave.
We are looking for buy/long positions in the green zone.
Targets are marked on the chart.
A daily candle closing below the invalidation level will invalidate this analysis.
For risk management, please don't forget stop loss and capital management
Comment if you have any questions
Thank You
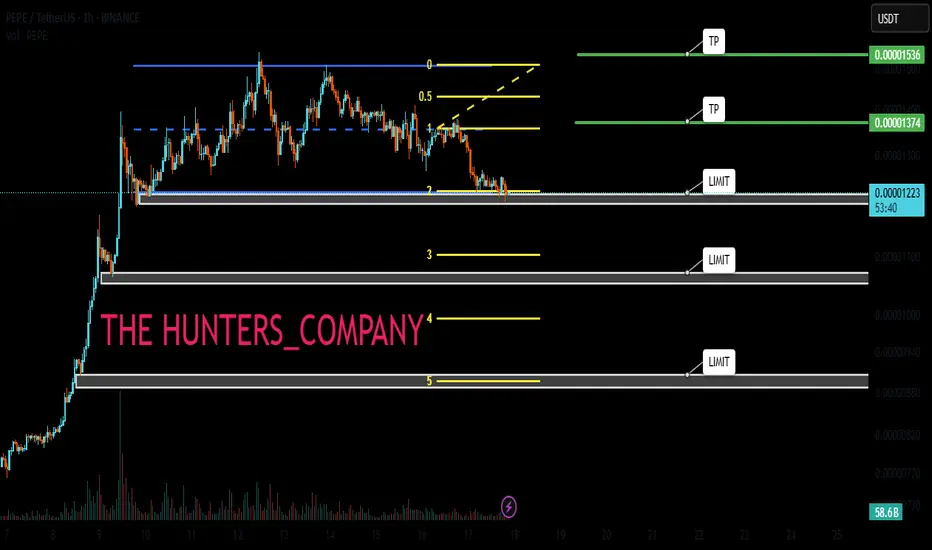
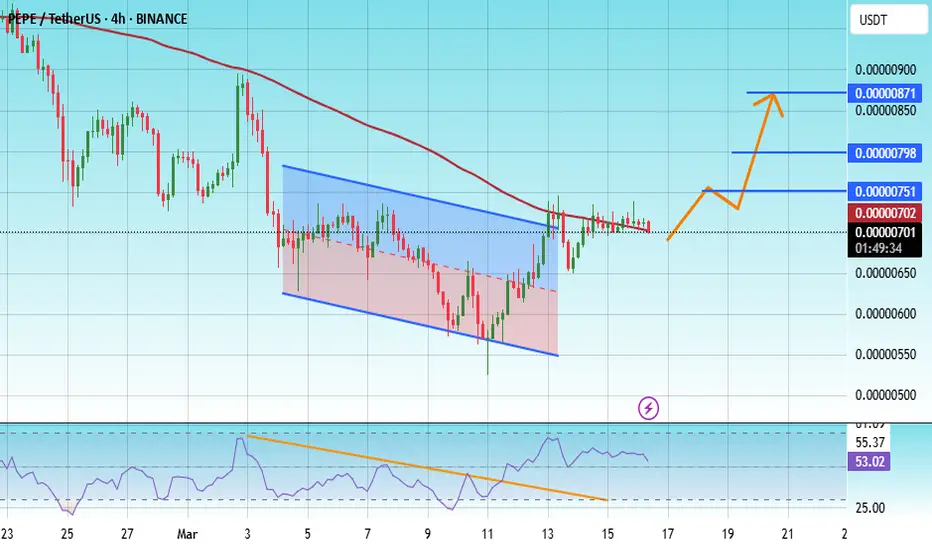
#PEPE/USDT#PEPE
The price is moving within a descending channel on the 1-hour frame, adhering well to it, and is on its way to breaking it strongly upwards and retesting it.
We are seeing a bounce from the lower boundary of the descending channel. This support is at 0.00000570.
We have a downtrend on the RSI indicator that is about to break and retest, supporting the upward trend.
We are looking for stability above the 100 moving average.
Entry price: 0.00000700
First target: 0.00000751
Second target: 0.00000798
Third target: 0.00000871
An important bifurcation point in the market, we are reducing poTo date, the market has shown itself quite positively, but, as I wrote earlier, it will be possible to talk about a trend change only after the opening of the second half of the quarter. The first half is so far only a pullback and retest of the broken key levels in the first quarter. Today and tomorrow we are passing an important bifurcation point. At the moment, 2500 for ether and 100k for bitcoin are only retest levels. However, over the past two weeks, the chances of a trend change have increased significantly, where the targets may be 210k for bitcoin and up to 7500k for ether. This scenario is possible when the second half of the quarter opens above 2500 and 100k, respectively. Oil growth in the new week, weak statistics on the United States in the second half of the week, or strong GDP in Europe and Britain, as well as a possible temporary truce in Ukraine, which will give impulses to the stock market and the cryptocurrency market, including.
The seasonal sales wave begins on May 11-12. In a positive scenario, today and tomorrow, the ether will be able to take 2500 and the new week will open above the level. In this case, in the first half of the week, we will only see sales within the shadow of a new weekly candle, and from Tuesday to Wednesday, the altcoin market will begin to return to growth, which may last until the end of the half–year if the second half of the quarter also opens above 2500. In this scenario, most coins will additionally show an increase of up to 50-150% from current levels.
In a more negative and technically more likely scenario, the new week will open below 2500, which will lead to a significant drop in the altcoin market at the beginning of the week and a return of ether to 1900-2000 with a further struggle for a new test of 2500 before the end of the month or continued sales to 1400-1500.
Due to the dangerous situation, it is worthwhile to carefully weigh the amount of funds in the work and reduce positions with further additions to coins in the event of a week opening above 2500 on ether. The most undervalued today are only fantokens, which can show good growth even in a negative market, as they will remain the most interesting option for speculators in the event of a drawdown of ether. Among them, I am primarily considering atm city and acm. It is also worth keeping an eye on coins with the monitoring tag, as they are sold most actively when the market correction is approaching. They can also contribute to the overall drawdown of altcoins.
