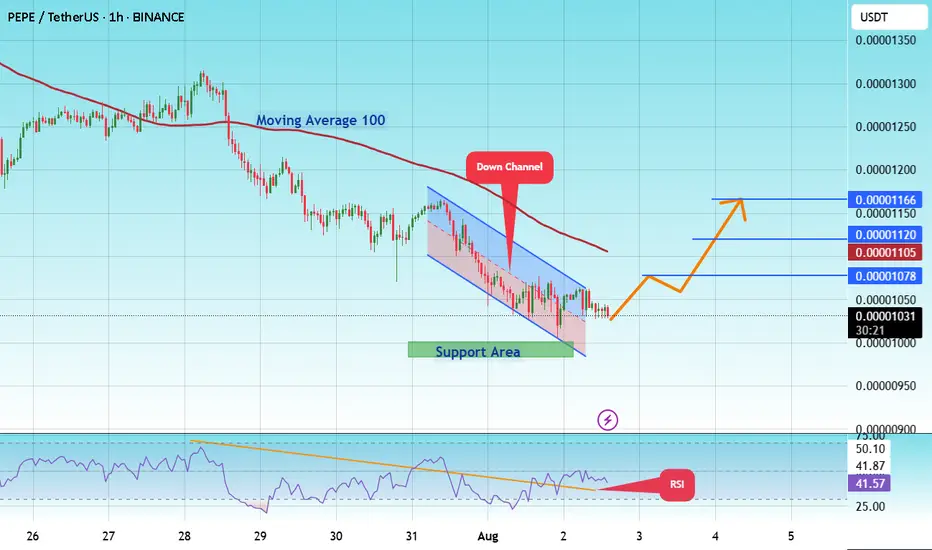
#PEPE/USDT or Breakdown? PEPE Eyes 0.00001166 Target !#PEPE
The price is moving within a descending channel on the 1-hour frame and is expected to break and continue upward.
We have a trend to stabilize above the 100 moving average once again.
We have a downtrend on the RSI indicator that supports the upward break.
We have a support area at the lower boundary of the channel at 0.00000980, acting as a strong support from which the price can rebound.
We have a major support area in green that pushed the price upward at 0.00000990.
Entry price: 0.00001030.
First target: 0.00001075.
Second target: 0.00001120.
Third target: 0.00001166.
To manage risk, don't forget stop loss and capital management.
When you reach the first target, save some profits and then change the stop order to an entry order.
For inquiries, please comment.
Thank you.
Pepelong
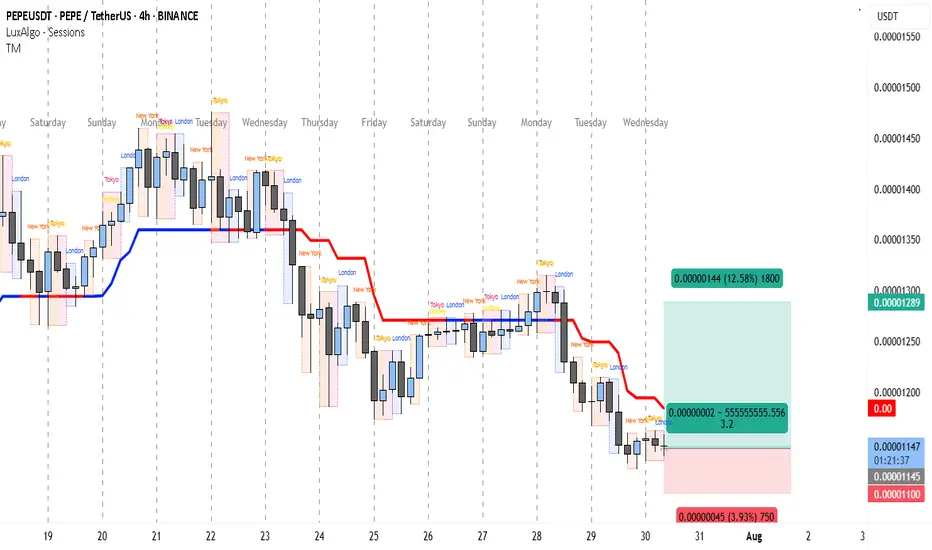
High R:R Play on PEPE — 3.2X Reward WaitingThe PEPEUSDT 4H chart clearly shows that the market has been in a downtrend since late July, forming consistent lower highs and lower lows. The trend indicator lines (red above price, blue below) suggest that bearish momentum has been dominant for several sessions.
From July 28 onwards, price tested the short-term moving average multiple times but failed to break above it, confirming that sellers remain in control. However, over the past few candles, we can see that price has started to slow its decline and is now consolidating near the 0.00001145 support zone. This is an area where buyers have previously stepped in, making it a potential pivot point for a short-term bounce.
The marked trade idea on the chart suggests a countertrend long trade. This makes sense because the market is oversold on lower timeframes and showing signs of accumulation. The upside target is set just below a prior reaction level at 0.00001289, which has historically acted as resistance. This creates an opportunity for a clean bounce if buying pressure increases.
Trade Setup
• Entry: 0.00001145 (at current support)
• Stop Loss: 0.00001100 (below recent swing low)
• Take Profit: 0.00001289 (targeting prior resistance)
• Risk-to-Reward Ratio: ~1:3.2
• Trade Bias: Short-term countertrend long
PEPE on the verge of breakout!PEPE / USDT
Price is trying to breakout massive downtrend line since 7 months
Incase of breakout we will see strong bullish momentum
Keep an eye on it
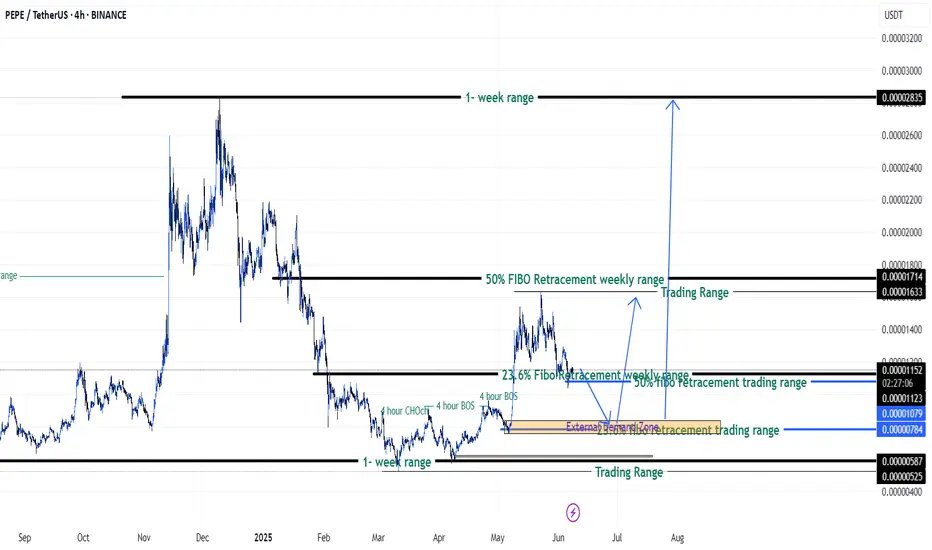
PEPEUSD going to moon according to my analysis. {08/june/2025}Educational Analysis says that PEPEUSD may give trend Trading opportunities from this range, according to my technical analysis.
Broker - binance
So, my analysis is based on a top-down approach from weekly to trend range to internal trend range.
So my analysis comprises of two structures: 1) Break of structure on weekly range and 2) Trading Range to fill the remaining fair value gap
Let's see what this pair brings to the table for us in the future.
Please check the comment section to see how this turned out.
DISCLAIMER:-
This is not an entry signal. THIS IS FOR EDUCATIONAL PURPOSES ONLY.
I HAVE NO CONCERNS WITH YOUR PROFIT OR LOSS,
Happy Trading, Fx Dollars.
Pepe update hello friends✋️
Considering the drop we had, you can see that the price was well supported in the specified area and buyers came in. Now in the return of the price, we can buy step by step in the specified support areas and move with it until the specified goals, of course, with the management of shame and risk...
*Trade safely with us*
PEPE Ready to Rip? 3 Take-Profits Lined Up from This Key SupportPEPEUSD is currently forming a potential bullish reversal near the key support zone between 0.00001060 and 0.00001099. This level has acted as a solid demand zone previously, with price bouncing off this range multiple times in the recent past. The current price action suggests consolidation above this level, hinting at potential accumulation by buyers.
We can observe a compression in volatility, with recent candles showing smaller bodies and longer wicks near support—classic signs of weakening bearish momentum. The prior price rejection from the 0.00001318 zone and the smooth retracement to support further confirm this as a healthy correction rather than a trend breakdown.
The DPO (Detrended Price Oscillator) is hovering close to zero, suggesting the asset is entering a potential pivot zone. A move into positive territory would support the bullish scenario, ideally confirmed by an increase in volume on the breakout above short-term resistance.
This setup is particularly attractive for scalpers or short-term traders, aiming to capture quick momentum surges across multiple resistance levels.
📌 Trade Setup
• Entry Zone: 0.00001167–0.00001177
• Stop-Loss (SL1): 0.00001060
• Take-Profit 1 (TP1): 0.00001318
• Take-Profit 2 (TP2): 0.00001443
• Take-Profit 3 (TP3): 0.00001603
Strategy Note: The risk-to-reward ratio is highly favorable, particularly for TP2 and TP3. The setup allows for flexible scaling of positions as price hits each resistance level. With no immediate macro threats on the 4H structure and price defending support, this setup offers a clean bullish opportunity.

Don't miss today's signal.Hello friends
Given the good growth we had, the price has corrected and now we can buy in steps in the specified areas with capital and risk management and move with it to the set goals.
*Trade safely with us*
High R/R Swing Setup on PEPE – Eyes on 100%+ MoveThe 1D chart for PEPEUSDT is showing a clean bullish structure, supported by repeated rejections from a key support level and a recent breakout above short-term resistance. This setup offers a simple yet potentially high-reward trade opportunity for swing traders.
📊 Trade Setup
Entry: 0.00001269 USDT
Price has confirmed a bullish reversal and is currently hovering above a minor consolidation range, presenting a strong opportunity for a long position.
Stop Loss: 0.00001079 USDT
Placed just below the previous local lows to invalidate the setup in case of a breakdown.
Take Profit 1 (TP1): 0.00002135 USDT
This level represents a previous high and a clear horizontal resistance zone.
Take Profit 2 (TP2): 0.00002844 USDT
A higher resistance level, also aligning with historical price action, offering a potential 103% gain from entry.
📈 Technical Justification
Key Support Holding: Price has shown multiple rejections near the 0.00000565 USDT level, forming a strong support base. Each rejection has resulted in a higher low, indicating increasing bullish momentum.
Trendline Confirmation: The ascending trendline shows sustained bullish pressure and confirms the strength of the ongoing trend.
Breakout Setup: Current price action indicates a breakout from consolidation, supported by volume. The bullish structure remains intact as long as the price holds above the 0.00001079 SL region.
Risk-to-Reward: The setup offers an attractive 4.5 R/R ratio, making it highly favorable for swing trading.
📌 Summary
This is a clean, trend-continuation trade with defined risk and strong technical backing. Traders looking for a mid-term opportunity should keep an eye on volume and price action around TP1 for potential partial exits or trailing stop adjustments.

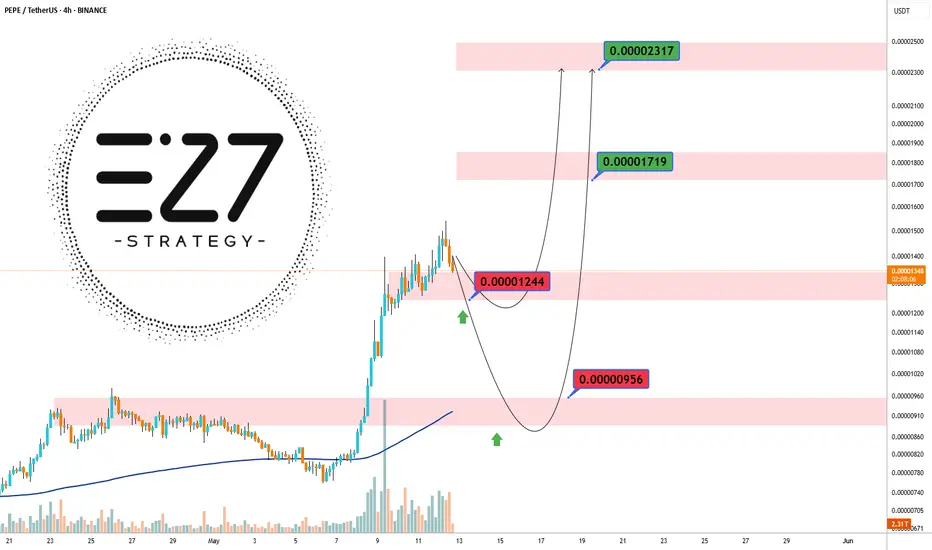
PEPE 80% Profit🚀 BINANCE:PEPEUSDT just made a big move!
It surged from 0.00000820 to 0.00001244 and then corrected to 0.00000956 📉
Now it’s sitting on strong support — and if it holds, another rally could be on the way! 💥
🎯 Next resistance levels:
0.00001244 (recent high)
0.00001719 (next key level)
0.00002317 (major long-term target) 🏁
📌 Key support zones:
0.00000956 (current support)
0.00000820 (late May support)
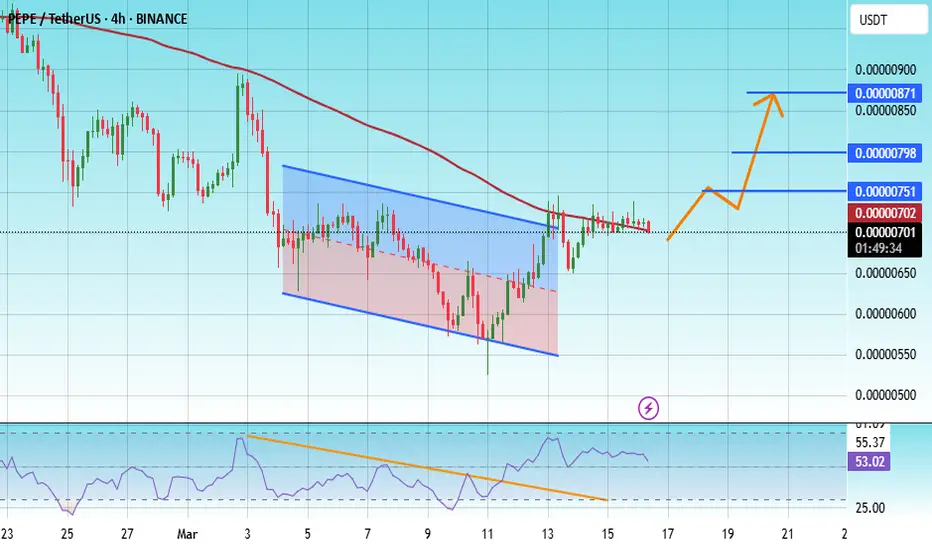
#PEPE/USDT#PEPE
The price is moving within a descending channel on the 1-hour frame, adhering well to it, and is on its way to breaking it strongly upwards and retesting it.
We are seeing a bounce from the lower boundary of the descending channel. This support is at 0.00000570.
We have a downtrend on the RSI indicator that is about to break and retest, supporting the upward trend.
We are looking for stability above the 100 moving average.
Entry price: 0.00000700
First target: 0.00000751
Second target: 0.00000798
Third target: 0.00000871
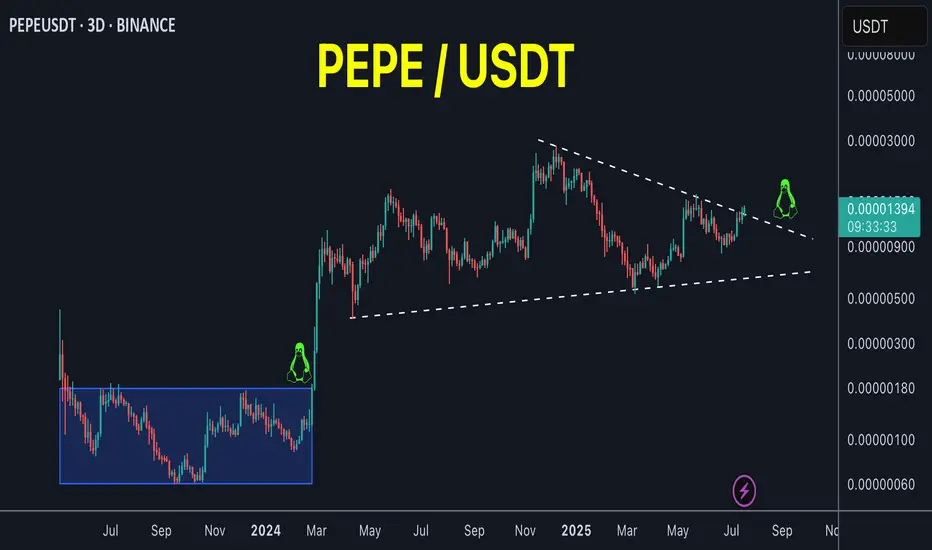
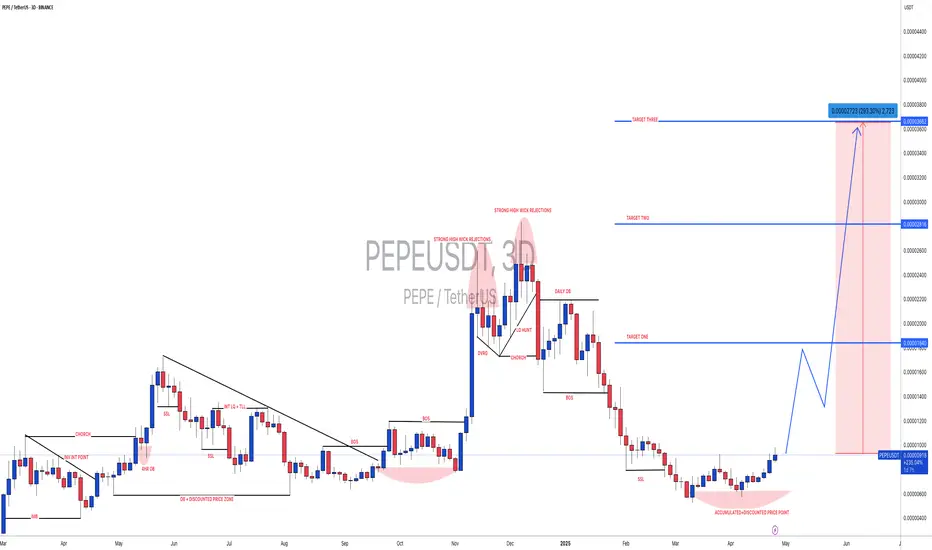
PEPEUSDT - Now waiting for another 100% move.It already made a 100% move from the zone we mentioned earlier, breaking the downtrend line with a massive bullish candle on the 3-day timeframe.
It’s now on its way to forming a new all-time high (ATH).
Best regards Ceciliones 🎯

#PEPEUSDT: Ready to launch | Will price hit previous high? EPEUSDT’s price has accumulated and is currently in the distribution phase, where we can anticipate a bullish impulse pattern. There are three targets, but our long-term objective is for the price to surpass its previous record high. We anticipate the price to reach or even surpass the previous high.
Wishing you good luck and safe trading!
Thank you for your unwavering support! 😊
If you’d like to contribute, here are a few ways you can help us:
- Like our ideas
- Comment on our ideas
- Share our ideas
Team Setupsfx_
❤️🚀
PEPE : WHAT WE WANT?Hello friends
Given the good price growth, we see that we had a correction, which we found the support area using Fibonacci, and the price has returned from that area by buyers and is now in an ascending channel, which we expect to move to the specified targets.
Trade safely with us

PEPEUSDT - bottomed out!Pepe has dropped by more than 80% in the past period, making it one of the most heavily declining coins.
The coin is now sitting on a very strong key support level, so we expect a strong rebound in the coming days.

PEPE BUY (UPDATE)hello friends
Considering the recent drop, the price has now returned well and it can be said that buyers are coming in little by little...
Now we have identified the good support points for you, which you can buy stepwise and with capital management.
*Trade safely with us*

PEPE/USDT Breakout Watch: Key Level to Trigger a Bullish SurgeKey Level Analysis
The phrase "if the price closes above this level then" suggests a confirmation level that must be broken for an upward move.
The highlighted level seems to be an area of previous support-turned-resistance (around 0.00001150 - 0.00001200 USDT).
If the price closes above this level on the weekly timeframe, it signals:
Breakout confirmation → Likely leading to a strong bullish rally.
Trend reversal → A shift from bearish to bullish structure.
Momentum entry point → A trigger for potential buy positions.
Potential Price Movement
If the weekly close is above the key level:
The price could rally significantly (illustrated by the large blue arrow).
Next resistance levels could be around 0.00001700 - 0.00002200 USDT.
If the price fails to close above the level:
It could mean a continuation of the downtrend.
Retesting lower support areas around 0.00000650 - 0.00000550 USDT.

PEPE Spot Long Trade Psychological trade
the market behavior and trader psychology that can drive price movements during breakout events. Traders often react to certain price levels, trends, and patterns in ways that influence decision-making and price action.
How to Manage Psychological Challenges in Breakout Trades:
Plan and Discipline: Having a clear plan helps avoid the emotional traps that can lead to rash decisions. This includes setting entry points, stop losses, and take profits ahead of time, so traders don’t rely on emotional reactions to price moves.
Risk Management: Proper position sizing, stop losses, and using a risk-reward ratio can help mitigate the psychological stress of a breakout trade. When risk is controlled, traders are less likely to panic during a false breakout or sudden market reversal.
Avoiding Overtrading: Traders who become overzealous or overly excited about breakouts can end up entering trades without proper confirmation or at bad risk-reward ratios. Sticking to a strategy and being selective with trades helps in avoiding emotional burnout.
Recognize False Breakouts:
False breakouts can be psychologically draining, especially when traders experience significant losses. Being able to step back, reassess, and avoid chasing every breakout can help reduce the psychological impact.

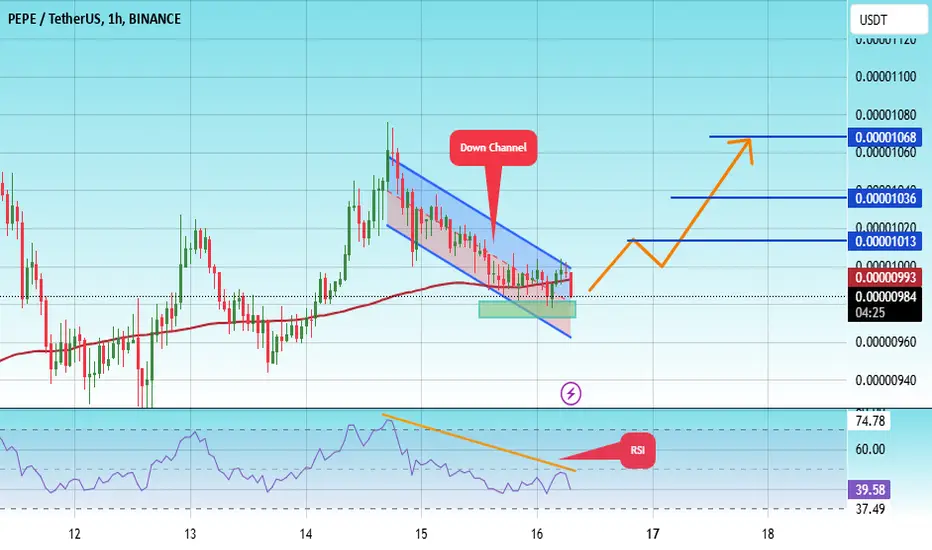
#PEPE/USDT#PEPE
The price is moving in a descending channel on the 1-hour frame and is adhering to it well and is heading to break it strongly upwards and retest it
We have a bounce from the lower limit of the descending channel, this support is at a price of 0.0.00000970
We have a downtrend on the RSI indicator that is about to break and retest, which supports the rise
We have a trend to stabilize above the moving average 100
Entry price 0.0.00000986
First target 0.000001013
Second target 0.00000103
Third target 0.000001068
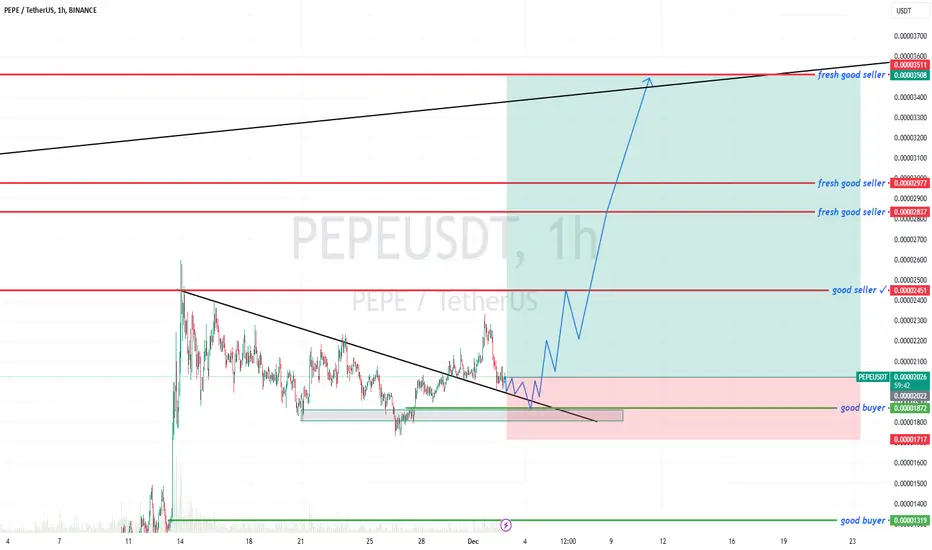
PEPE 10x imminentPay your attention to PEPE. This is an underestimated project that will easily show 10x on the current market. From a technical point of view the asset is very oversold, we should wait for a strong push up. Wintermute made their asset 2 times cheaper and finished accumulation. Growth start next week.
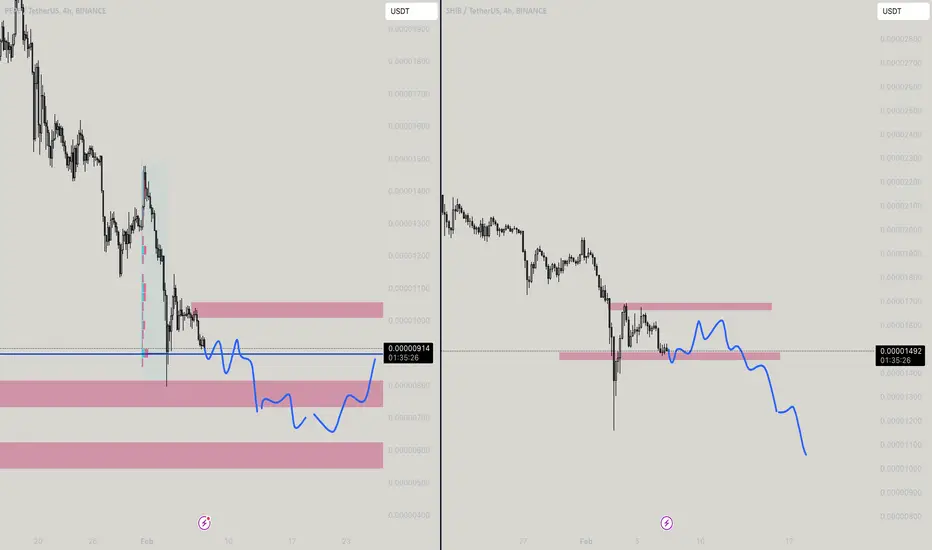
SHIB vs PEPE! Who will fall first?Pretty Obvious for me they both look weak as a stick to me. Nothing much to explain when overall stances are negative for me! Plan your trades accordingly
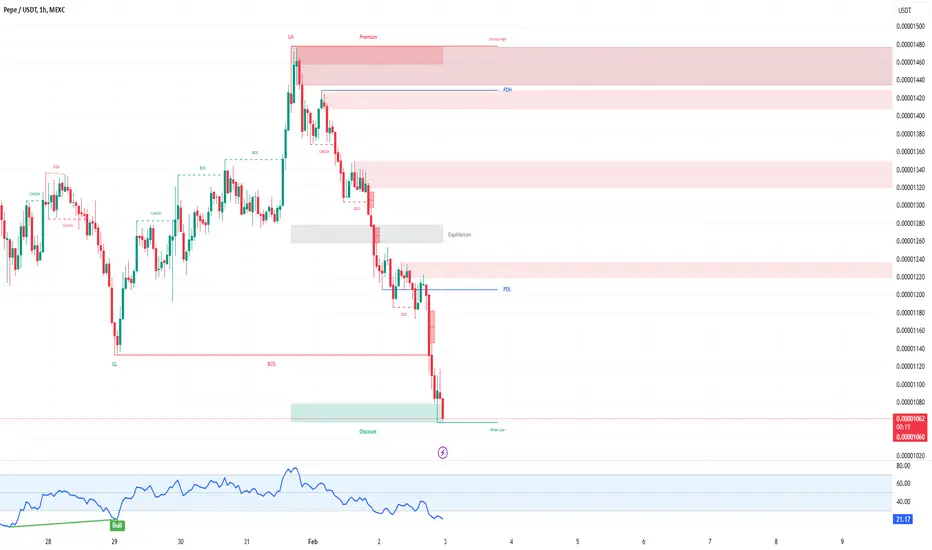
PEPE/USDT 1H: Oversold & Accumulating – Reversal Incoming?PEPE/USDT 1H Chart Analysis
📉 Follow me on TradingView if you respect our charts! 🚀Daily charts!
Market Condition:
Price: 0.00001064, showing strong bearish momentum.
Market Structure: Lower highs and lower lows confirm bearish trend.
RSI: 21.52, severely oversold with potential for a bounce.
Key Levels:
Major Resistance: 0.00001220 (Key breakout level).
Current Support: 0.00001000 (Psychological level).
Next Major Support: 0.00000950 (Critical discount zone).
Smart Money Analysis:
Market makers likely accumulating at discount zone below 0.00001000.
Hidden Bullish Divergence forming on RSI, suggesting a potential reversal.
Liquidity below 0.00001000 could be targeted before a bounce.
Risk Score:
8/10 (High-risk environment, approach with caution).
Recommendation:
📌 Wait for confirmation before entering longs. Look for:
Price reclaiming 0.00001220.
Bullish divergence completion on RSI.
Volume spike confirming institutional buying.
Potential Long Setup If Reversal Happens:
Entry: Above 0.00001220 (only if confirmation is present).
Targets:
T1: 0.00001340.
T2: 0.00001420.
T3: 0.00001500.
Stop Loss: Below 0.00000950.
Confidence Level:
7/10 for reversal play – monitor price action closely before entering.
📉 Follow me on TradingView if you respect our charts! 🚀Daily charts!
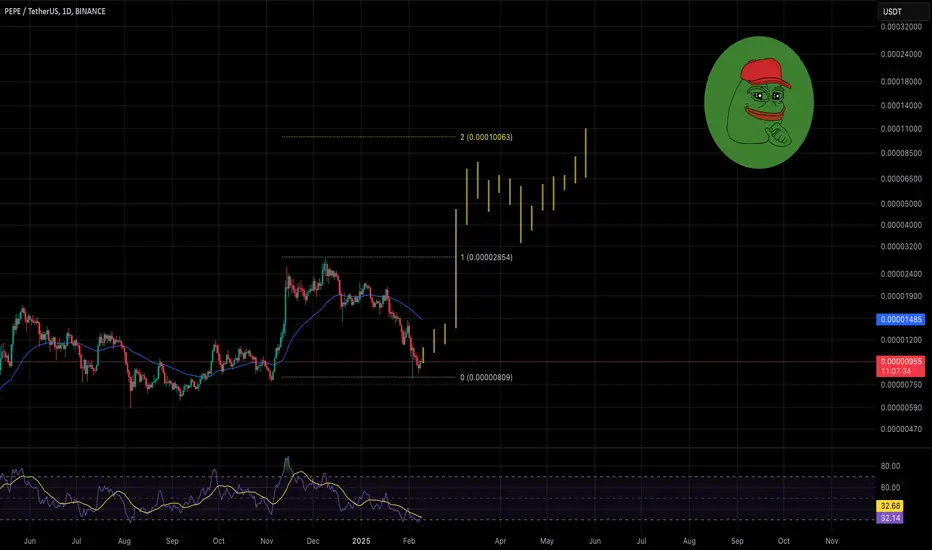
$PEPE will hit ATH again and again?analysis using SNR ORIGINAL Chart Pattern. trade at ur own risk ya. stick with SL
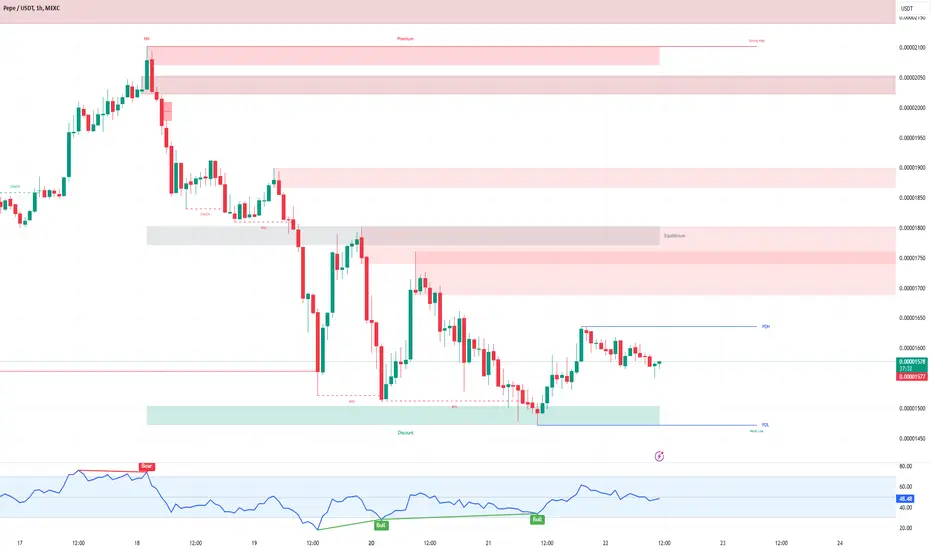
PEPE/USDT 1H: Bulls Poised for a Breakout to $0.00002100!PEPE/USDT 1H Chart Analysis
🚀 Follow me on Tradingview if you respect our charts 📈
Current Market Analysis:
Price: Consolidating in a tight range.
RSI: Bullish divergence at 40, indicating potential reversal.
Support: $0.00001450
Resistance: $0.00001750
Trade Setup (Confidence Level: 7.5/10):
Entry Zone: $0.00001500-$0.00001550
Targets:
T1: $0.00001750 (previous resistance).
T2: $0.00001900.
T3: $0.00002100.
Stop Loss: Below $0.00001400.
Risk/Reward: Favorable with a 1:3 ratio.
Smart Money Analysis:
Accumulation: Visible at support level, suggesting preparation for an upward move.
Liquidity Target: Market makers likely aiming above $0.00001900.
RSI Divergence: Hidden bullish divergence supports the bullish case.
Risk Score: 7/10 (moderate risk, manageable with position sizing).
Recommendation:
A long position is favorable within the entry zone.
Employ strict risk management to safeguard against potential downside.
Watch for volume confirmation as price approaches resistance levels.
Confidence Level: 7.5/10 for a bullish setup.
🚀 Follow me on Tradingview if you respect our charts 📈