PEPE IS IN A GOOD BUY ZONE, I WILL WAIT A LITTLE TO LONGPEPE has rallied up over 45% from the recent crash low. Sitting around FIB38.2, this asset may pull back a little toward the ascending TL before the northward rally continues.
I believe this PEPE will reward us some good money to investors & traders who can wait for this analysis to become reality.
I am bullish
Pepelong
PEPE Token Price SpeculationsBINANCE:PEPEUSDT
The price prediction for Pepe token (PEPE) over the next five days suggests a potential upward trend. According to various sources:
1. Short-term Forecast:
July 7, 2024: $0.000008866
July 8, 2024: $0.000009345 (+1.39%)
July 9, 2024: $0.000009963 (+8.09%)
July 10, 2024: $0.00001072 (+16.31%)
July 11, 2024: $0.00001156 (+25.42%) .
2. Market Sentiment and Influences:
• Current Sentiment: The market sentiment for Pepe token is currently mixed. Despite short-term bullish predictions, some indicators suggest caution due to market volatility and speculative nature of meme coins .
• Factors Influencing Price: External factors such as overall market trends, investor sentiment, and broader economic conditions can significantly influence PEPE’s price movements .
These projections indicate a potentially positive trajectory for Pepe token in the immediate future, with expected price increases over the next few days. However, it’s important to consider the inherent volatility and risks associated with meme coins and the broader cryptocurrency market when making investment decisions.
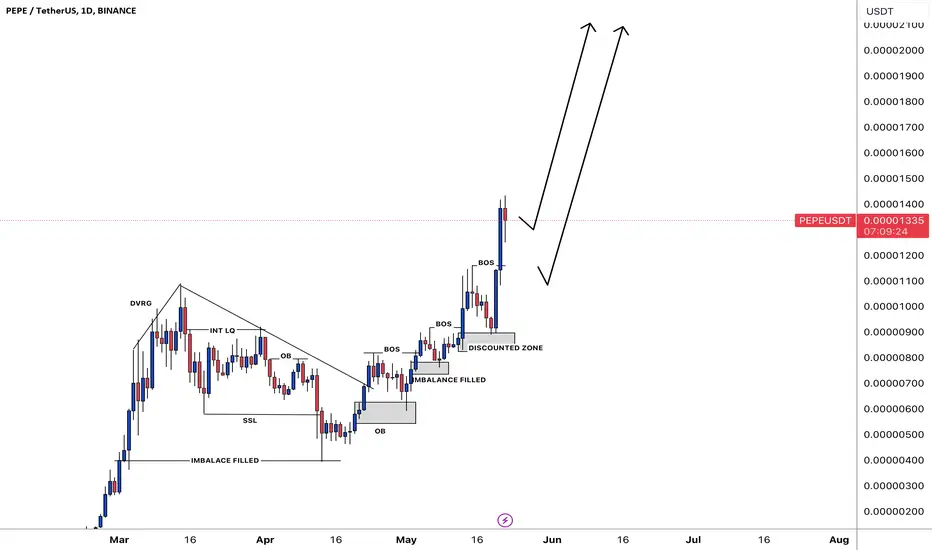
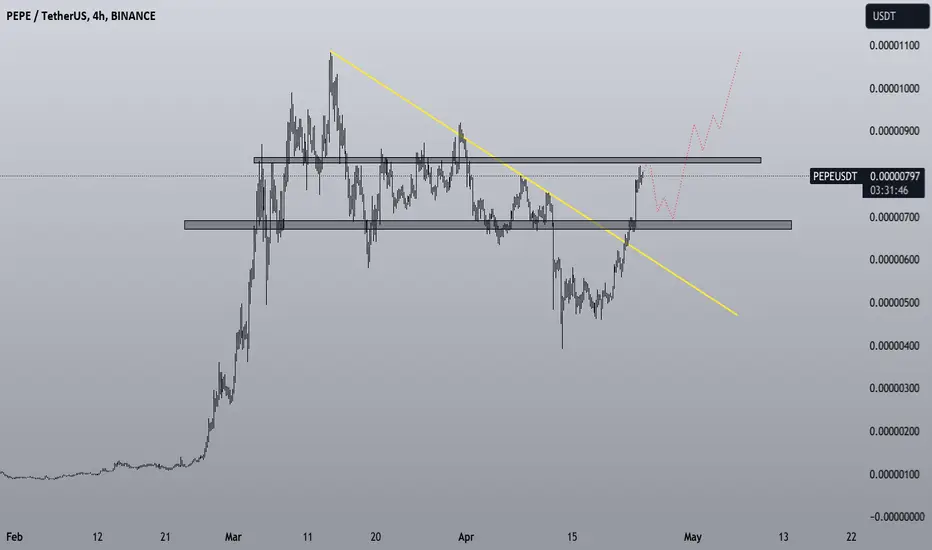
PEPE/USDT Trading ScenarioAfter hitting a new local high of $0.00001726, the price of PEPE entered a prolonged correction, dropping to $0.00000768, a decline of over 55%. In this range, the price found significant interest from market participants and nearly reached the high-volume level (Point of Control, POC), from which it bounced back and attempted to recover. Currently, the asset is in a consolidation phase, and according to the volume profile, interest in this price zone remains. The price might drop further, which could pressure new participants and provide an opportunity to buy at lower prices, closing out losing positions. A downward move and testing of the 200-day moving average appear promising for medium-term entry with the goal of setting a new local high.
PEPEUSDT.1DThis technical analysis of the PEPE/USDT (PepeCoin against US Dollar Tether) chart provides a comprehensive view of the market dynamics at play. Here’s an in-depth review of the current chart pattern and the critical levels:
Current Price Action:
PEPE is trading at 0.00001259 USDT. The chart reveals a sequence of bullish and bearish phases, now seemingly poised at a crucial juncture.
Key Levels on the Chart:
Support Levels:
S1: 0.00000780, a significant pivot point in recent trading sessions.
S2: 0.00000595, which has acted as both resistance and support in earlier price movements.
S3: 0.00000379, indicating a lower boundary from past pricing zones.
S4: Not shown but would imply a further significant drop.
Resistance Levels:
R1: 0.00001377, a previous support level that could now serve as a resistance.
R2: 0.00001724, the highest recent price and a psychological barrier.
Technical Indicators:
MACD (Moving Average Convergence Divergence): The MACD is hovering around the signal line, indicating a lack of strong momentum. The slight convergence above the signal line may suggest a budding bullish momentum, but it remains weak.
RSI (Relative Strength Index): The RSI is at 59.04, which is near the neutral zone but trending upwards, suggesting increasing buying interest without yet reaching overbought conditions.
Technical Analysis and Trading Strategy:
The chart presents a scenario where PEPE has bounced off the low support levels and is attempting to break through higher resistance. The current formation suggests a potential bullish reversal if the market sentiment continues to improve.
Buying Strategy: Consider taking long positions if PEPE maintains its level above S1 at 0.00000780, with a conservative target at R1 (0.00001377). A tight stop-loss just below S1 could help manage risk.
Selling Strategy: If PEPE reaches the resistance at R1, traders should watch for signs of reversal (e.g., bearish candlestick patterns, RSI divergence). Taking profits near R1 or holding out for R2 (0.00001724) with a trailing stop-loss can maximize gains while protecting from sudden declines.
Risk Management: Given the volatility and the lower price per coin, position sizing should be adjusted accordingly to manage exposure and avoid significant losses.
Conclusion:
The PEPE/USDT pair shows potential for short to medium-term gains if it can sustain above established support levels and break through the impending resistance levels. The key will be to watch how the indicators align over the next trading sessions, particularly the MACD for momentum shifts and the RSI for buyer exhaustion signs at higher levels. This approach combines technical signals with strategic entry and exit points to optimize the trading outcome while mitigating risk.

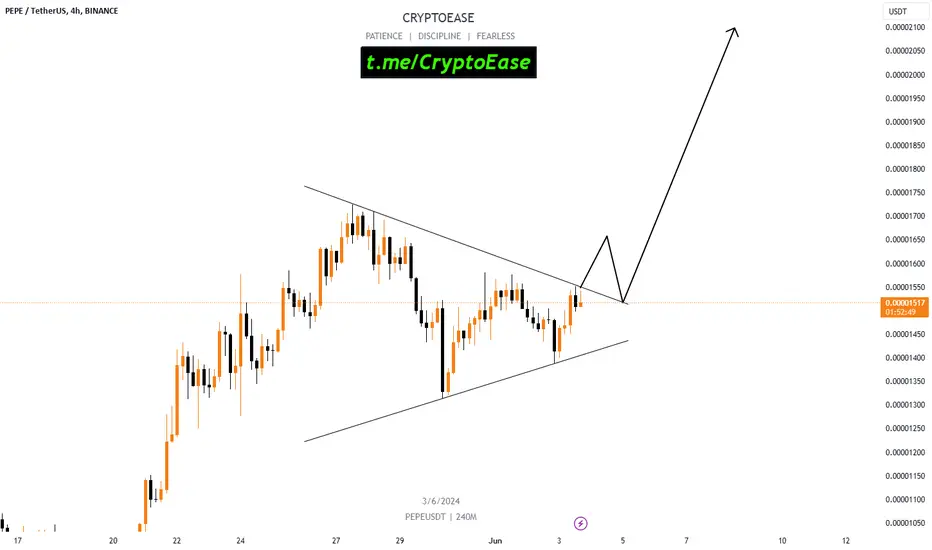
PEPEUSDT 4HPEPE ~ 4H
#PEPE For the short term, This is a Bullish pattern. Purchase after breaking through the Resistance line of this pattern.
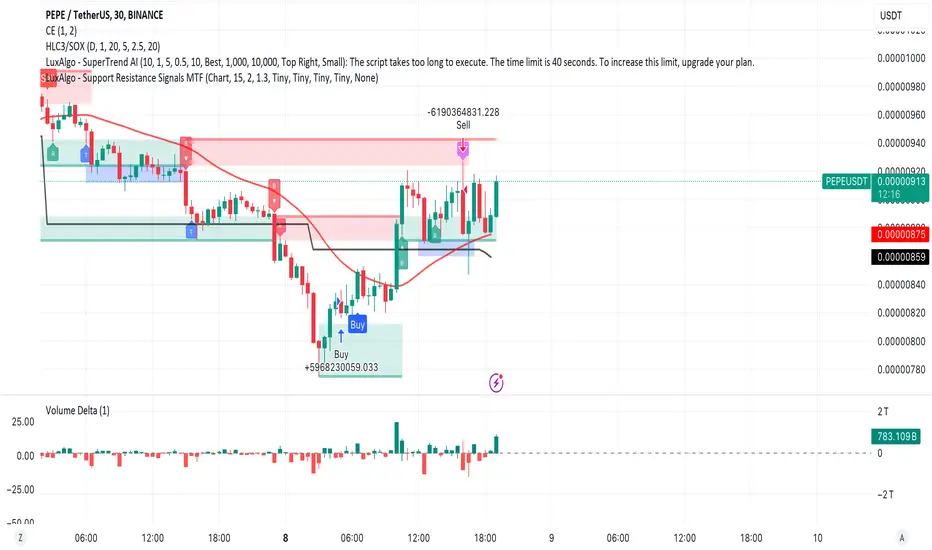
PEPE wait break S/R📊 PEPEUSDT Chart Analysis
Key Points:
Strong Resistance 💪:
A strong resistance is observed at the 0.00000991 - 0.00001032 zone. This level has acted as a barrier multiple times.
Indicated by the blue horizontal line.
Take Profit (TP) Levels 🎯:
TP-1: 0.00000991 🟢
TP-2: 0.00001032 🟢
TP-3: 0.00001082 🟢
TP-4: 0.00001131 🟢
TP-5: 0.00001208 🟢
Technical Analysis 🔍:
Previous Downtrend 📉:
The chart shows a strong downtrend previously, with the price dropping from around 0.00001313 to the low of approximately 0.00000763.
Current Zone 📈:
The current price is around 0.00000924, close to the strong resistance zone.
The red area represents the risk zone, indicating the potential for a price drop if this area is broken downward.
Potential Upside 🚀:
If the price can break the strong resistance around 0.00000991, there's potential for movement towards the subsequent TP levels.
Given the current position and the strong resistance, breaking this zone could signal a good buying opportunity.
Trading Strategy 💹:
Enter Long Position 🛒:
Consider entering a long position if the resistance at 0.00000991 is broken.
The take profit targets (TP) are sequentially TP-1 to TP-5.
Stop Loss 🛑:
Place the stop loss below the red zone (0.00000897) to limit losses in case of a sudden price drop.
Conclusion 📝:
The PEPEUSDT chart indicates a strong resistance zone. Breaking this resistance can lead to a potential price increase towards the specified TP levels. Therefore, entering a long position upon breaking this resistance and setting a stop loss below the red zone can be a sound strategy.

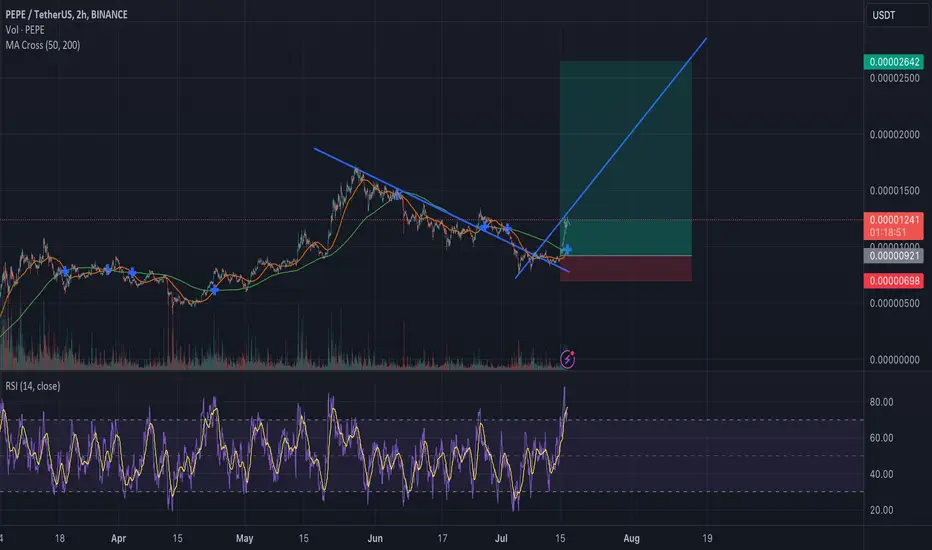
$PEPE trollololing from 0.00000920 to 0.0000260-270 price 185%upAfter hitting a low post-correction we are very much still in a bull market with BINANCE:PEPEUSDT after the correction from 0.00001600 happened. Majority selling volume sitting at 0.00002642.
Invest smart, invest hard.
Boost my post if you like this idea 💡
Also follow and subscribe for more uproars. Let's spread the word together.
Roaring Puppy 🐶 out.
BINANCE:PEPEUSDT
PEPE MOVESSilently whispers....The trend is your friend, the trend is my friend....the trend is my friend until the....
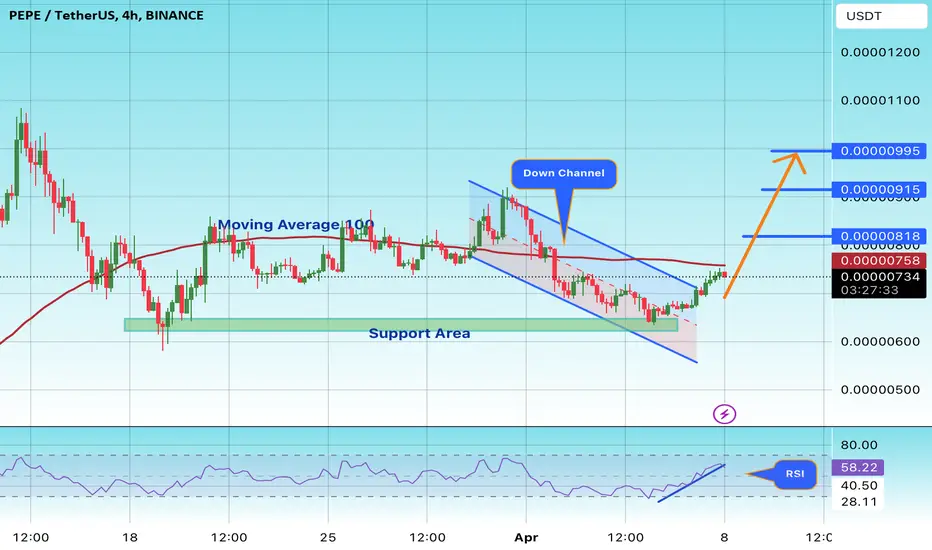
#PEPE/USDT#PEPE
We have a descending channel pattern on the 4-hour frame, the price is moving inside it and adhering to its borders well
We have a support area in green at a price of 0.0000950 after the price touched it and rebounded from it
We have a trend to stabilize above the moving average 100
We have a downtrend on the RSI indicator that supports the price upwards
Entry price 0.00001115
First target 0.00001300
Second target 0.00001435
Third target 0.00001595

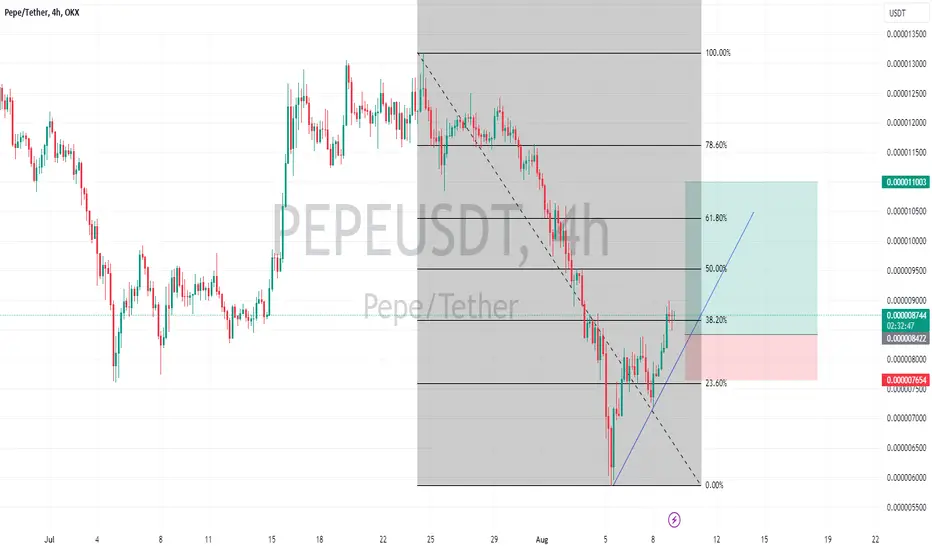
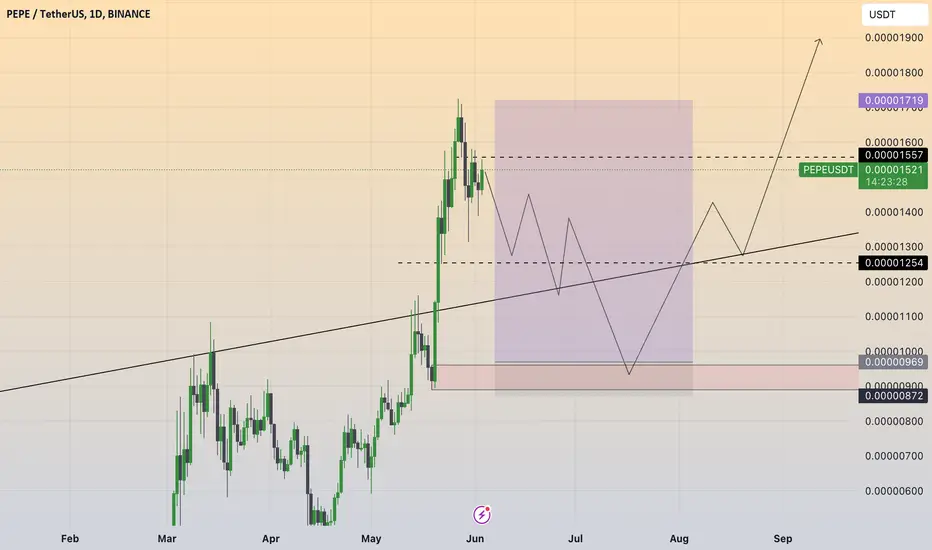
PEPE: Pullback in UptrendTrade setup : Price is in an Uptrend. Following a bullish breakout from Channel Up, price reached resistance at $0.000017, where it got rejected. Now we look for the right entry opportunity in Uptrend. Pull back near $0.000013 support could be a swing trade entry opportunity in Uptrend with +30% upside potential back to $0.000017. Stop Loss at $0.0000110. If price breaks above it's ATH of $0.0000173, the next possible resistance levels (price targets) based on Fibonacci Extensions are: $0.0000184 (61.80%), $0.0000200 (78.60%), $0.0000215 (100%) and $0.0000266 (161.80%).
Pattern : Pullback in Uptrend. Price remains in an Uptrend but has pulled back, which could present a 'buying dip' opportunity. Traders should look for the nearest support level where price could stabilize and resume its Uptrend. This support level could be a level where price bounced off of in the past, or a level that was previously resistance. (concept known as polarity).Learn to trade key levels in Lesson 3.
Trend : Short-term trend is Up, Medium-term trend is Strong Up and Long-term trend is Strong Up.
Momentum : Price is neither overbought nor oversold currently, based on RSI-14 levels (RSI > 30 and RSI < 70).
Support and Resistance : Nearest Support Zone is $0.000012, then $0.0000092. Nearest Resistance Zone is $0.000015, then $0.0000164.

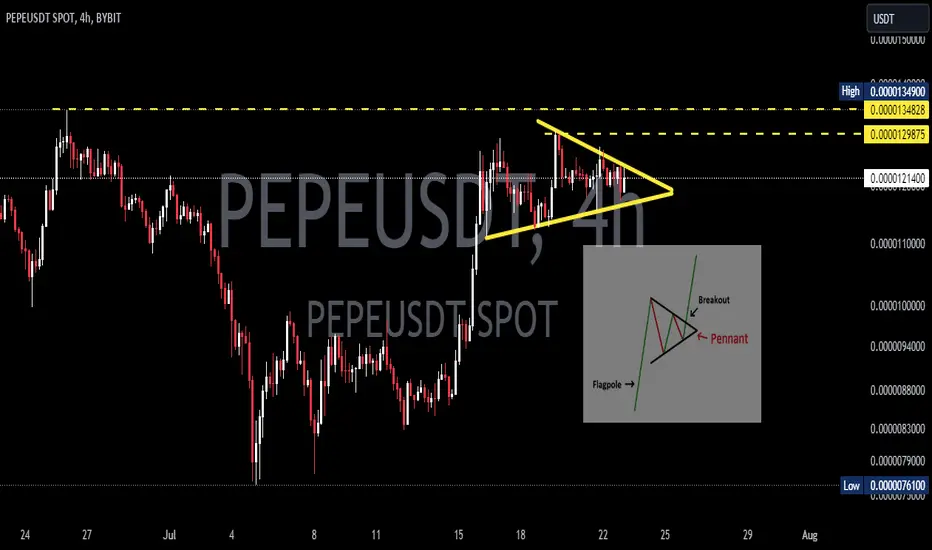
$PEPE LONG ANALYSISTime for a new #PEPE leg up! The price has consolidated long enough, formed a bullish pennant, and is ready to pump!
I open a long here, my targets are on the chart!
BINANCE:PEPEUSDT
FOLLOW US FOR MORE ANALYSIS
PEPE Long Term PlanPEPE is almost near to ATH, but we will wait for its retrace till the Daily demand zone marked.
Will see how it reacts on this OB+Demand Zone.
Keep bulls eyes on it. ;)
LONG CONSOLIDATION AHEAD FOR PEPEAs you can see we might facing a long consolidation for PEPE, this is needed to shake weak hands and reward the brave one. I would like this scenario for me to accumulate more of this volatile gem. If you believe in this project then DCA is the key. In My Own Opinion, this is very different from Safemoon. Warning, this is not for the weak hands. This is not financial advise and invest only what you can afford to lose.

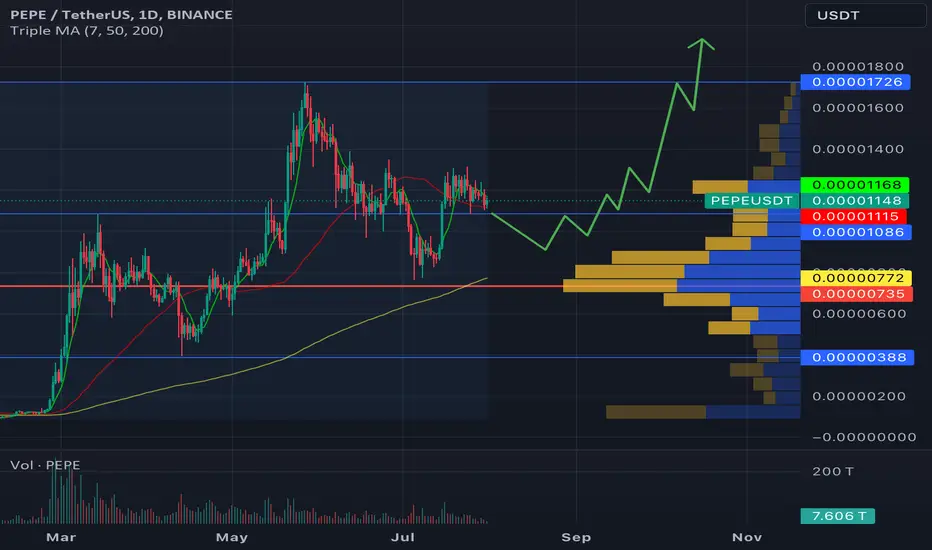
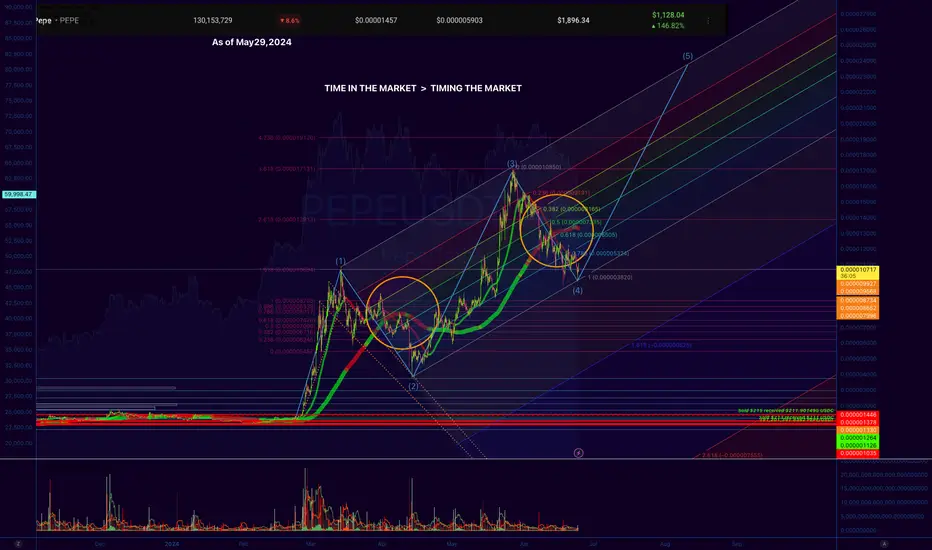
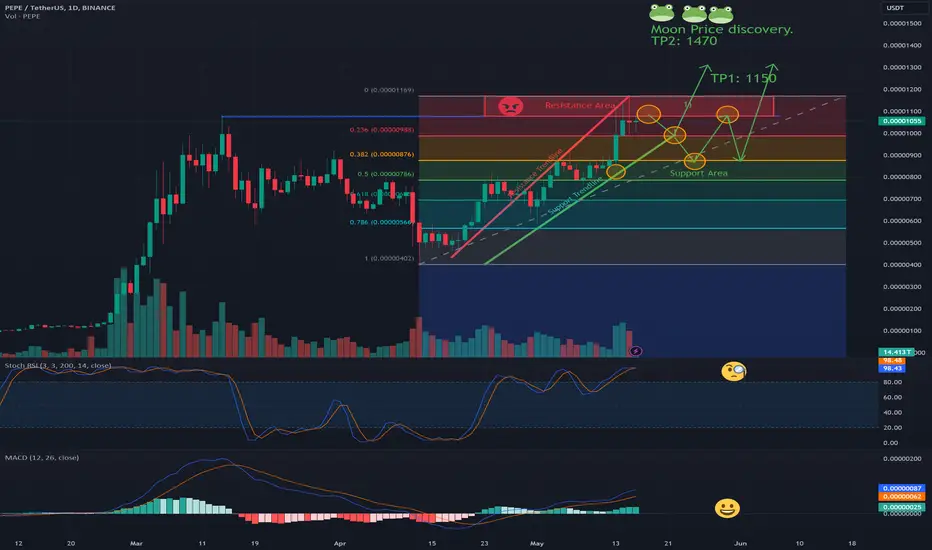
$PEPE short term trading planFollowing my previous long term trading plan and after we hit all the target, I am publishing a short-term plan. It is clear that trading CRYPTOCAP:PEPE from here will not be a straight line to the moon, so let's prepare to buy and sell when necessary.
Bear in mind that:
- CRYPTOCAP:PEPE is a new coin, making it difficult to chart due to its limited history.
- CRYPTOCAP:BTC can significantly impact this strategy. CRYPTOCAP:PEPE , like other altcoins, is very sensitive to CRYPTOCAP:BTC 's movements.
- I am overall very bullish on CRYPTOCAP:PEPE in the long term; it is a solid coin to hold.
Here are my concerns:
- After a huge pump, there is usually a correction. CRYPTOCAP:BTC is not going to $100k without some hesitation, so many factors could slow down CRYPTOCAP:PEPE 's momentum.
- There is a solid resistance area between 1076 and 1176. We can and will likely be rejected from here.
- The Stochastic RSI on the daily chart is showing signs of a crossover, which could negatively impact CRYPTOCAP:PEPE for a week.
Here are the positives:
- The MACD on the weekly and daily charts is open and growing, which will push CRYPTOCAP:PEPE up compared to other coins for the next month or two.
- CRYPTOCAP:PEPE might be listed on Coinbase Spot, which would be a major catalyst for a price pump.
- CRYPTOCAP:PEPE is gaining widespread attention, and its fans are extremely active.
- CRYPTOCAP:PEPE 's trading volume is higher than Ethereum's, attracting a large number of whale traders.
I see 2 scenarios. They are labelled 1) and 2) on the chart!
This is an opinion, not a financial advice, I might be wrong, so DYOR. Do not use leverage.
PEPE/USDT Analysis: Bullish Breakout and Key Targets📌In this video, we dive into the latest price action of PEPE/USDT on Binance. We analyze a significant bullish breakout from the support level and identify key resistance zones. Learn how to leverage these insights for potential trading opportunities. Don't miss out on this in-depth technical analysis using TradingView!
📊PEPE/USDT Analysis: Bullish Breakout and Key Targets

PEPEUSDT: On the way to create a record high!Dear Traders,
PEPEUSDT has some extreme bullish behaviour due to that in our view this crypto is likely to continue its bullish momentum for long period. It would be ideal for someone who has been looking to swing buy this crypto. Good Luck.
**If you like our chart analysis please do like and comment the idea and follow us, which will encourage us to bring you more**
PEPE Out of the flagMy previous setup for PEPE was correct, but i got stopped out due to an early entry. Pepe actually broke up from a bull flag after a break of major trendline, and i think we could see a continuation of the pump after a retest of the support zone at $0,..73. First target the resistance level at $0,..83
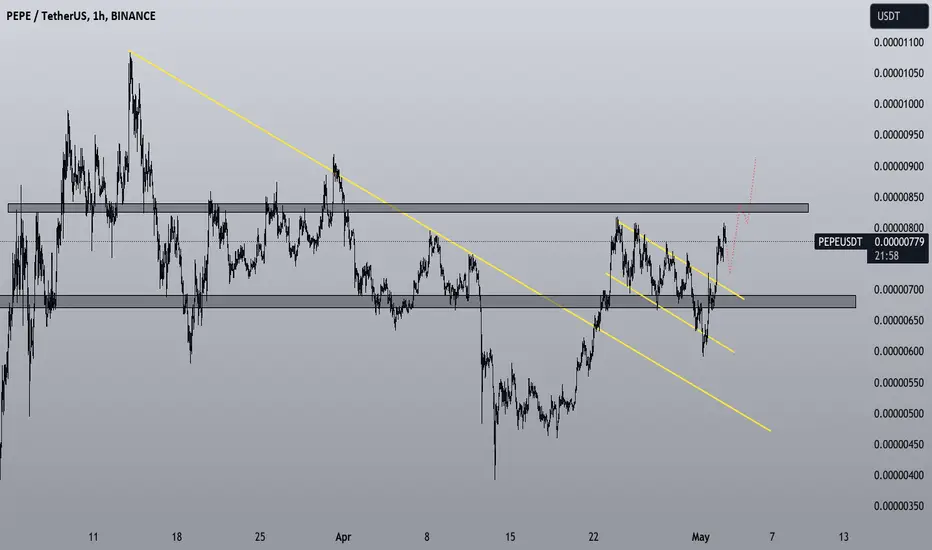
PEPE Following the setupI shared this setup for PEPE some days ago. Actually it's following pretty well and it's trying to bounce from mid term support zone. If this support hold, i think we will see a pump and a reclaim of the resistance area at 0,..8. R:R is pretty good to enter now

PEPE Moving to new highsPepe is looking strong and we can see a clean bullish trend. After the break of the main trendline, price make an interesting pump and looks like is not ready to stop yet. $0,..8 is a strong resistance area and i expect a possible pullback there, till $0,..65. This support level is where i will look to enter long waiting for new highs.
PEPEUSD 6HPEPE ~ 6H 📈
#PEPE Make purchases gradually in this pattern area with a minimum target of 15%++
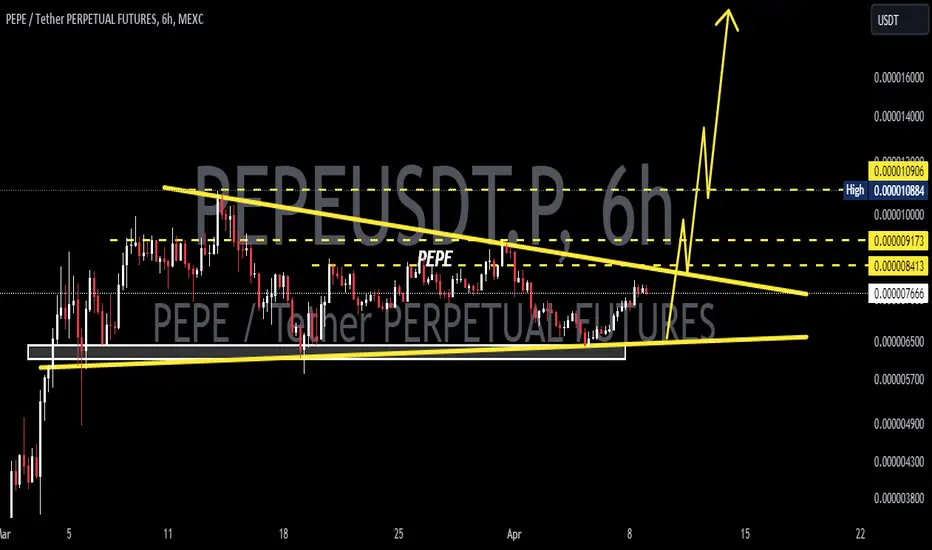
#PEPE/USDT#PEPE
The price is moving in a bearish channel on a 4-hour frame, the price is moving inside it and it was broken to the upside
We have a major support area at 0.00000600
We have a higher stability moving average of 100
We have an uptrend on the RSI indicator that supports the rise
Entry price is 0.0000730
The first goal is 0.000000820
The second goal is 0.0000915
The third goal is 0.00000995
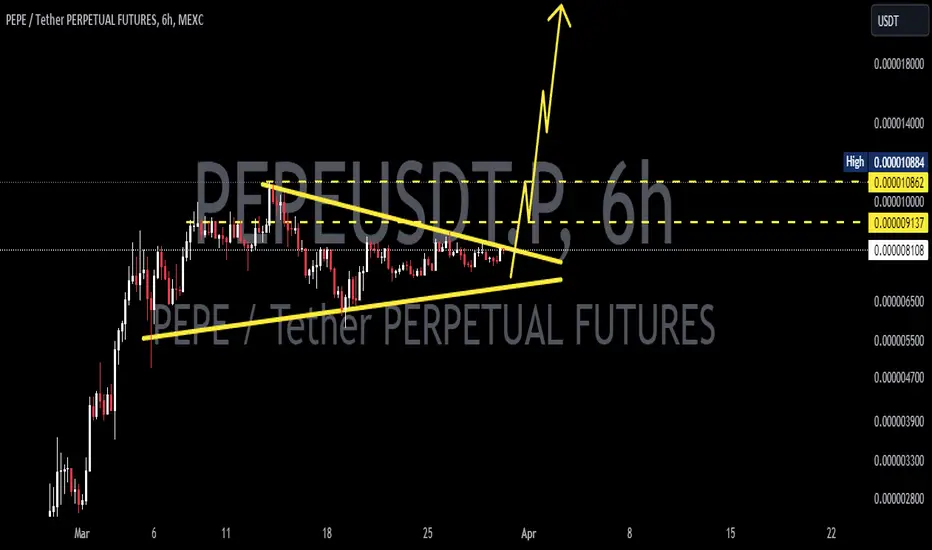
PEPEUSD 6HPEPE ~ 6H 📈
#PEPE Make purchases gradually after breaking through this resistance line with a target of at least 15%+ from here. this is a bull pattern,.
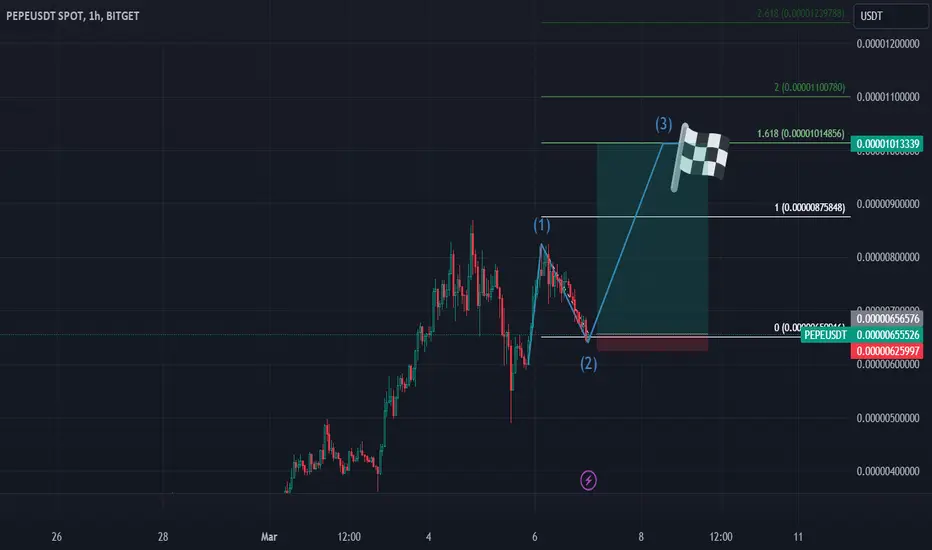
PEPE Long to Lose a 0PEPE has reached my lower target at the 0.786 Fibonacci level, signaling a prime opportunity to initiate a long position with a carefully placed stop loss. We're now poised for an ascent towards the 1.618 Fibonacci level. How to take profits
1.618 Level: Consider selling between 50% to 70% of your position. This is a significant target, marking a potential turn or pause in momentum.
2.0 Level: Take profit on another 15% of your holdings. This level represents a further stretch in price, warranting partial profit-taking.
2.618 Level: Aim to sell an additional 15%. Should the climb not extend to this lofty target, look to offload this portion anywhere in between the 2.0 and 2.618 levels.
Disclaimer: I’m not a financial advisor, and this should not be considered financial advice. These insights are shared from my personal perspective and are intended for educational purposes only. Always conduct your own research and consult with a professional before making investment decisions.