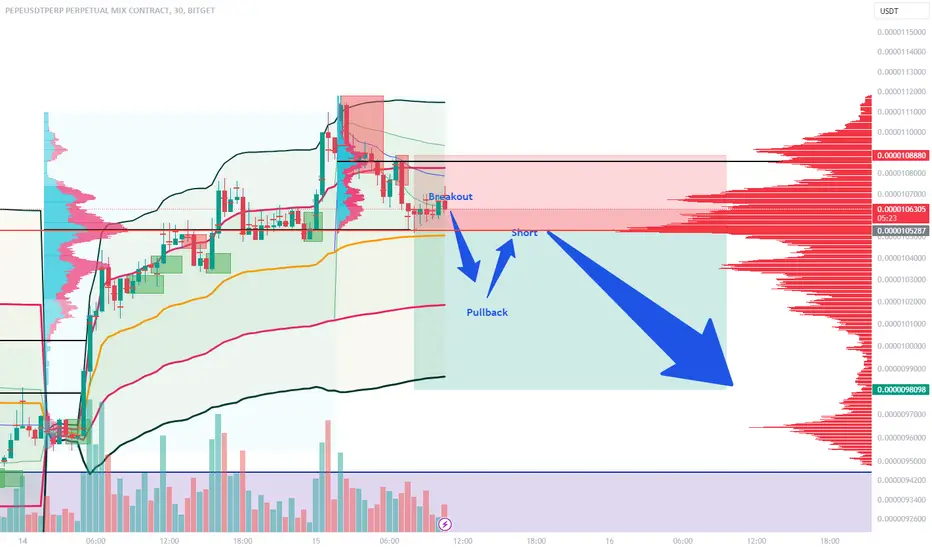
PEPEUSDT.P preview on 30m PEPE coin is on a strong support and I am waiting to see if it reaches a rebound, in case of breaking through the support I would like to see this Price Action, for short trading
PEPEUSDT
PEPE/USDT - Potential Breakdown from Ascending Channelhello guys.
Price Action:
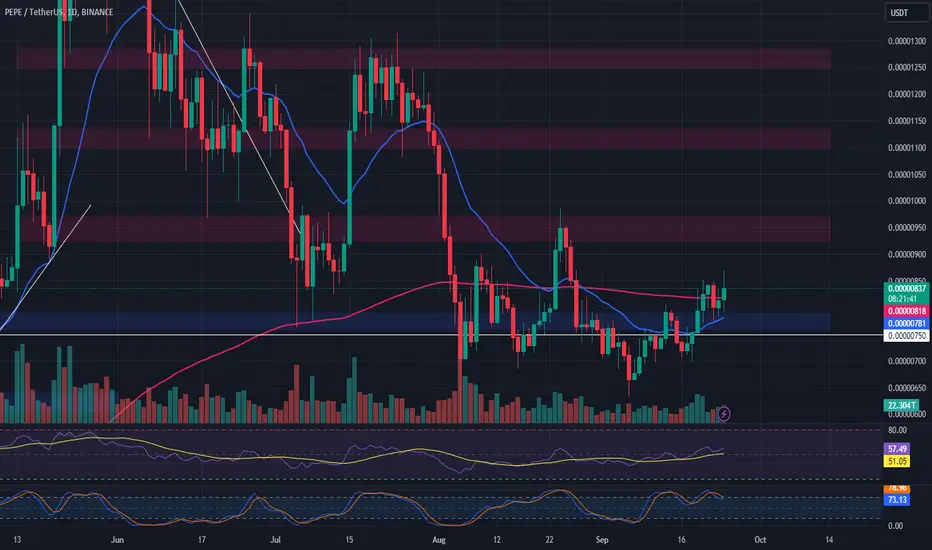
PEPE/USDT is currently trading within an ascending channel but showing signs of a potential breakdown.
The price has been rejected from the top of the channel and is now hovering near the support zone around 0.00000918 USDT.
Support and Resistance:
Key support lies around 0.00000860 USDT as shown in the highlighted box. If the price breaks below this level, a sharper drop is likely.
The next major support zone is between 0.00000770 USDT and 0.00000740 USDT, where the price might stabilize if the breakdown continues.
Bearish Scenario:
The chart suggests a possible breakdown if the price fails to hold above the current support levels. The descending arrow highlights the potential path to lower support zones.
If the breakdown happens, price could fall toward the 0.00000755 - 0.00000717 USDT zone, possibly testing the lower boundaries of the channel.
Bullish Scenario:
A reversal could occur if the price manages to hold above 0.00000918 USDT and reclaims its previous high near 0.00000980 USDT, but this would require strong buying momentum.

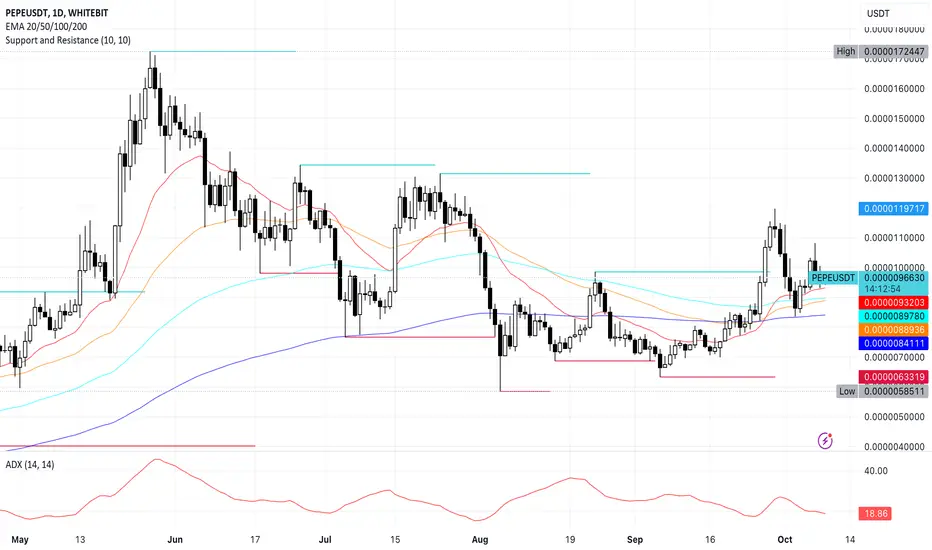
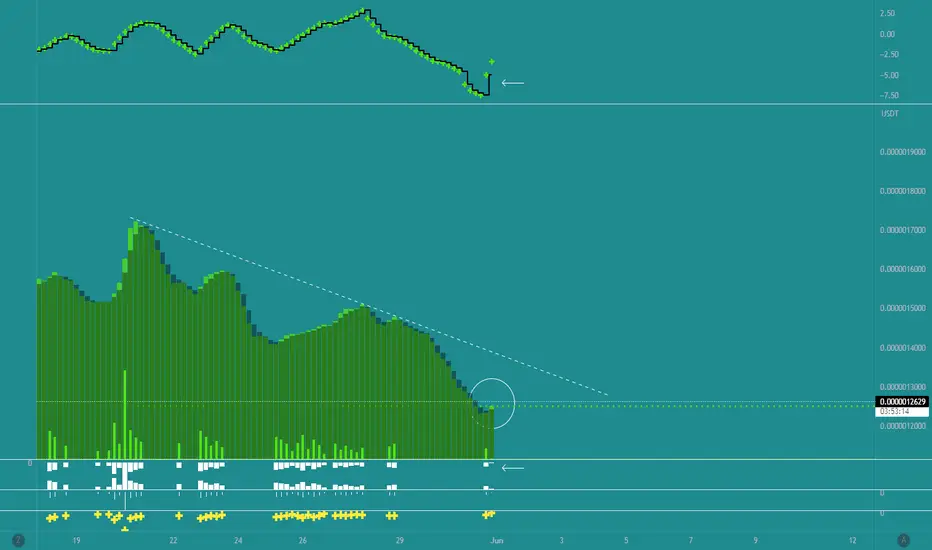
PEPE price stability in doubt as market momentum fadesPEPE price is showing signs of weakening momentum. Key technical indicators suggest the recent uptrend is losing steam. As a result, the coin has fallen almost 10% in the last 24 hours.
Additionally, short-term price indicators, such as the EMA lines, remain neutral, signaling that PEPE may test important support levels in the near future. While the possibility of a downward move exists, a resurgence in bullish momentum could push PEPE toward retesting key resistance levels.
PEPE’s ADX has dropped to 18.86, a sharp decline from its peak of 58.52 on September 30, when PEPE was trading at $0.00001147.
Such a low ADX value indicates that the price is likely ranging within a narrow band, neither gaining nor losing much ground. This aligns with the idea that PEPE is in a period of reduced volatility, even as one of the biggest meme coins in the market.
The sharp drop in ADX also confirms that the strong trend observed in late September has faded, leaving PEPE without a clear directional force. That makes it more susceptible to sideways trading or minor fluctuations until a new trend emerges.
This downward tilt suggests that the bullish momentum is weakening, and a potential shift could be on the horizon. If the current price action continues in this neutral to slightly bearish direction, PEPE might test the support level at $0.00000835 in the coming days. Should this support fail to hold, the price could drop further, with the next strong support at $0.00000776.
However, if bullish momentum picks up again, PEPE price could challenge the resistance at $0.0000119. For now, the market remains in a state of uncertainty, and traders are likely waiting for a clearer signal to determine the next move.
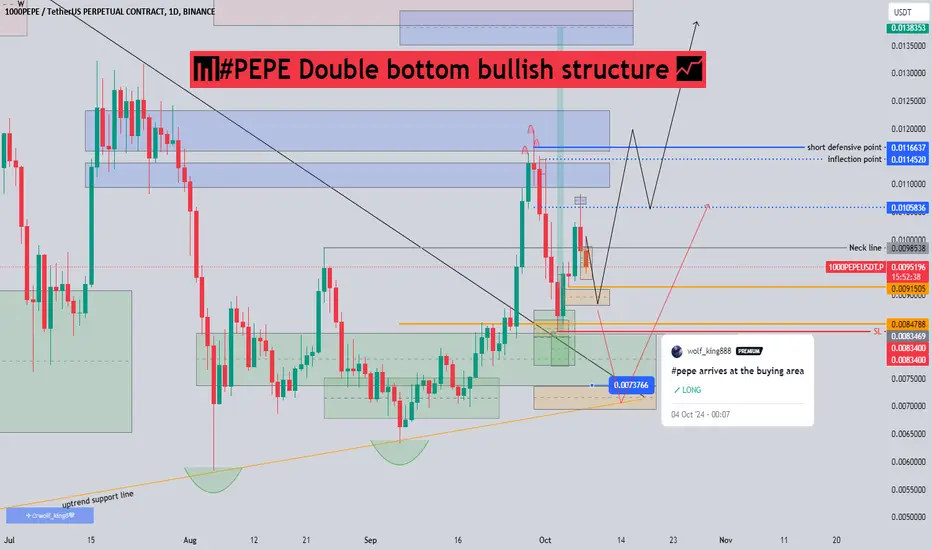
#PEPE Double bottom bullish structure📊#PEPE Double bottom bullish structure 📈
🧠We can see from the daily chart that an obvious double bottom bullish structure has been established, so a good pullback is a good time for us to enter.
➡️We still have 20% of the long order we got on the 3rd. Because our entry point is very good and it is already in a risky state, we can withstand the possible pullback and then look forward to greater profits.
➡️This season may be ignited by the MEME series, so it is worth our ambush and expectation.
Let's see 👀
🤜If you like my analysis, please like 💖 and share 💬
💕 Follow me so you don't miss out on any signals and analyze 💯
BINANCE:1000PEPEUSDT.P
PEPE Prepares for Parabolic Growth: Bullish Momentum Building PEPE’s price action is following a classic Elliott Wave structure, with Wave 1 now complete, followed by an ABC correction, which also appears to have finished. This signals that we’re now entering Wave 3 of a larger degree trend (marked yellow), with Waves 1 and 2 behind us.
Zooming in, the Roman numeral wave count (white) shows the completion of Wave 1 of 3 of the higher degree trend, with i (green) forming the current wave. Once i completes, we can expect a brief ABC correction, followed by parabolic growth in Wave 3.
It’s exciting to see a meme coin like PEPE following such a strong bullish trajectory. The overall outlook is highly promising, and this setup could lead to significant upside potential!

PEPE + BNB Will Moon Just Like ETH Did In 2017 17 year experienced trader here sharing my thoughts to help the crypto community.
As everyone knows this is a very important time for the market as we are approaching the end of the 3rd year of the 4 year cycle . Year 4 has always been ALTSEASON . The charts I am sharing with you are setting up to have HUGE runs into 2025. In teh video I share with you my reasoning on why this meme coin and BNB will explode higher just like ETH did back in 2017 . ETH was the the daddy back then and now MEME coins are the hot narratives (look at how many meme coins that Binance have listed) and there is a reason for it . Meme coins are bring in heavy trading volume for exchanges creating good revenue and they also bring in new crypto people to the community , we have seen xrp bring in millions of people , then we seen DOGE bring in millions of people then SHIB and then PEPE . Each ALTSEASON it has been a new meme coin that helps bring in and grow the crypto community so this time will be no different . This time we have new coins like NEIRO that can moon also but that is for another video .
Do not sleep on these coins and if u need any help or have any questions please just send me a message and I will be happy to try my best to help .
Have a great weekend
MartyBoots

PEPE, will do another UPSIDE attempt..PEPE 4h data is showing another attempt to reverse to the upside. Volume increasing notably at the current price range.
Let's see if it can finally breakout of its descending trendline.
Spotted at 0.0000012500
TAYOR.
Safeguard capital always.
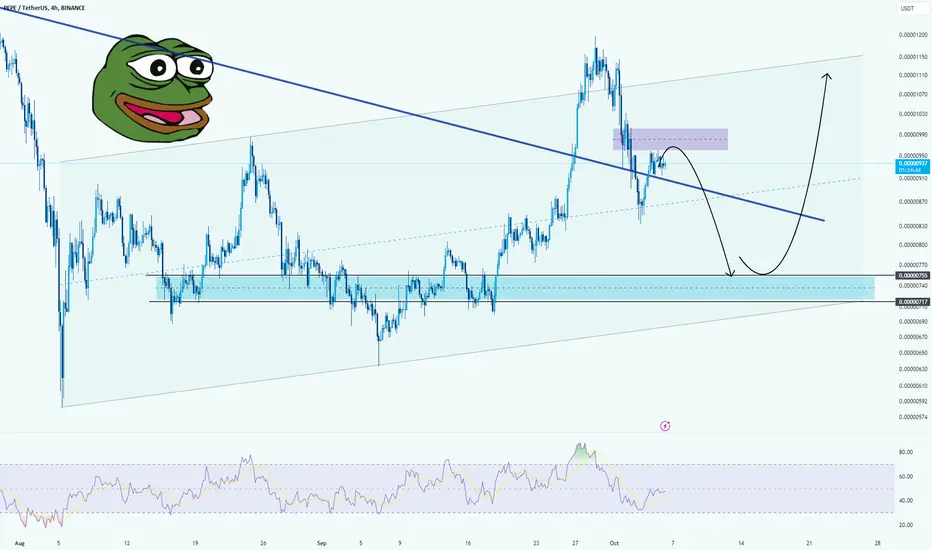
PEPE → Potential Rebound at Key Support Zonehello guys.
Descending Resistance Line: The price broke above a long-standing descending resistance line but is now retesting this line, which could act as support.
Support Zone ($0.00000077 - $0.00000074): The price is approaching a strong support area highlighted in the chart, which has been previously tested multiple times. If the price reaches this zone, a potential rebound is expected.
Bearish Retest and Pullback: There's a bearish pullback after a recent rally, with the possibility of retesting the resistance line or lower support levels before any significant upward movement.
Bullish Scenario: Should the price successfully bounce off the support zone, a strong recovery is anticipated, with a potential upward move towards $0.00000110 or higher, as illustrated on the chart.
RSI Indicator: The RSI is in the lower range, suggesting the asset is nearing oversold territory, which might contribute to a reversal in the coming sessions.
___________________________
✓✓✓ Always do your research.
❒❒❒ If you have any questions, you can write them in the comments below, and I will answer them.
❤︎ ❤︎ ❤︎And please don't forget to support this idea with your likes and
Crypto in October is "UPTOBER" by OfficialPapaRicoThere was an imbalance on the 4-hour chart that also bounced right off the 61% level. This is a long-term trade and will hopefully break new highs within the next 6 months to 4 years.
This is not financial advice but I would highly invest in buying crypto and storing it in a cold wallet. CryptoBubbles.net is also a great platform to see the top 1000 coins to invest in. This is a great time to invest in at least 10 different coins.
Good luck guys and see you next year in 2025
- OfficialPapaRico
- October 6, 2024

PEPE/USDT pair on Binance (1-hour timeframe) TA+TRADE PLAN BY BFPEPE/USDT pair on Binance (1-hour timeframe) Technical Analysis + TRADE PLAN by Blaž Fabjan
Chart Pattern: Falling Wedge
The falling wedge pattern is identified, which is typically a bullish reversal pattern. As the price converges downward, it indicates a potential breakout to the upside.
The pattern suggests that there might be a bullish move coming once the price breaks out of the wedge. The breakout has either happened or is about to happen as per the drawing.
Key Support and Resistance Levels:
Support Levels:
$0.00000066: This is a key support level, likely the bottom of the falling wedge pattern.
$0.00000070 and $0.00000076: Potential areas of support if the price retraces after the breakout.
Resistance Levels:
$0.000000807, $0.000000886, and $0.000000986: These are key resistance levels. Once the price breaks out of the falling wedge, it will likely face resistance at these levels.
$0.000001084 and $0.000001235: The upper resistance targets if the price momentum continues.
Indicators:
RSI (Relative Strength Index):
RSI is around 56, indicating that the market is in a neutral to bullish territory. If RSI increases above 70, it may indicate overbought conditions.
Stochastic Oscillator:
Stochastic Oscillator is around 85, indicating overbought conditions. However, during a breakout scenario, this might suggest strong momentum.
Volume:
There is a slight increase in volume, which is often seen during breakouts from chart patterns like falling wedges.
VMC Cipher B Indicator:
This indicator shows momentum and potential divergence. The convergence of the lines could indicate a bullish reversal.
Hull Moving Average (HMA) Histogram:
The HMA histogram shows a slight bullish divergence, supporting the case for a bullish breakout.
Trading Plan
Entry:
Enter the trade after a confirmed breakout from the falling wedge pattern, preferably on a candle close above $0.000000807 (the first key resistance level). Confirmation can also be supported by an increase in volume or further confirmation from RSI moving upward.
Stop Loss:
Place a stop-loss below the most recent support, around $0.00000070, to minimize risk in case the breakout fails or the price retraces back into the wedge.
Take Profit Levels:
First Target (TP1): $0.000000886 (next resistance level).
Second Target (TP2): $0.000000986 (another resistance level where the price may slow down).
Third Target (TP3): $0.000001084 (for more aggressive traders aiming for a larger move).
If you are highly confident in the bullish move, you can target $0.000001235, but ensure to trail your stop-loss once the price reaches the first target to lock in some profit.
Risk Management:
Risk-to-reward ratio should ideally be 2:1 or better.
Use 1-2% of your trading capital on this trade to manage risk effectively.
Monitor RSI and Stochastic Oscillator closely, as both are nearing overbought zones. If these indicators show divergence (i.e., price rising but RSI declining), be cautious of a false breakout.
Watch for any sudden shifts in volume; if volume drops after the breakout, it could indicate weakening momentum.
In case the price drops back into the wedge pattern or below support, consider exiting the trade to avoid further losses.
This trading plan aims to capitalize on the bullish breakout of the falling wedge pattern, but always ensure to use proper risk management.

possible bear flage on PEPEwe se a possible bear flag forming on pepe. the tatget is at a orderblock. makes sense. my take is short at the 0.5 from last drop.

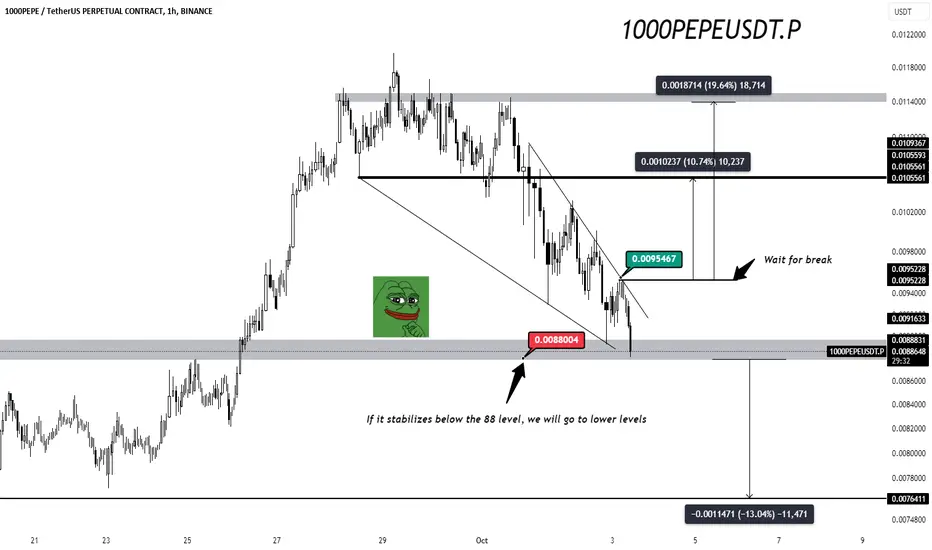
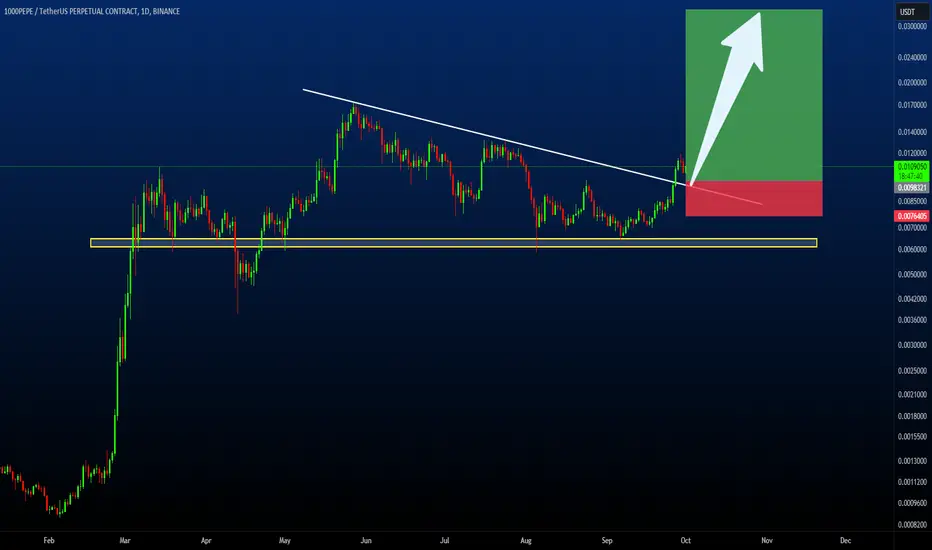
PEPE forecast price🐸 1000PEPEUSDT.P Technical Analysis:
We’re currently at a critical support level around 0.0088004 📉. If price stabilizes below this area, expect further drops to the 0.0076411 zone, marking a potential 13.04% decline 📉.
However, there's a descending trendline ⤵️ pressing the price down. A break above this line would be a sign of reversal 🔄, targeting the first resistance at 0.0095467 💥. If the price holds above this point, it could trigger a bullish move towards higher resistances at 0.010237 (a 10.74% increase) and then to 0.0118714 (a 19.64% increase) 📈.
Key strategy: Watch for volume spikes 📊 and wait for a clean breakout above the descending trendline for a potential buying opportunity 🚀. If support breaks, prepare for deeper pullbacks ⬇️.
Stay sharp and manage your risks properly! 🛡️"
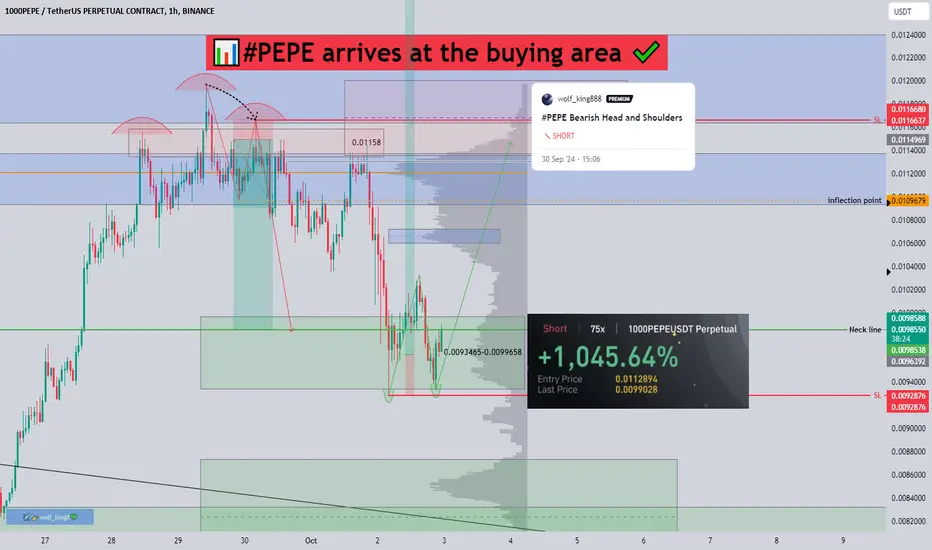
#PEPE arrives at the buying area📊#PEPE arrives at the buying area ✔️
🧠From a structural perspective, the objectives of the bearish head and shoulders structure we constructed near the resistance zone have all been achieved, so we need to be wary of the risk of a rebound. If we can build a synchronic bull structure in the buy zone, it means that there is no possibility of further correction.
🤜If you like my analysis, please like 💖and share it💬
💕 Follow me so you don't miss out on any signals and analyze 💯
BINANCE:1000PEPEUSDT.P
PEPEUSDT: Ready to Rocket! As the meme coin craze takes over, PEPEUSDT is making waves! It has recently broken its trendline and bounced off a strong support level, setting the stage for a powerful upward movement. With the momentum building, now is the time to watch for a significant price jump. Don’t forget to manage your risk while riding this thrilling wave!
PEPEUSDT Currently trading at $0.0108
Buy level: Above $0.0098
Stop loss: Below $0.0077
TP1: $0.012
TP2: $0.015
TP3: $0.02
TP4: $0.03
Max Leverage 3x
Follow Our Tradingview Account for More Technical Analysis Updates, | Like, Share and Comment Your thoughts
17 Years Experienced Trader Talks About PEPE Hey guys , MartyBoots here I have been trading for 17 years and sharing my thoughts on PEPE
PEPE is BNBs mini me or its little brother (for now at least )
It looks strong and should move well
Watch for more info and hit me up if u need help or have any questions

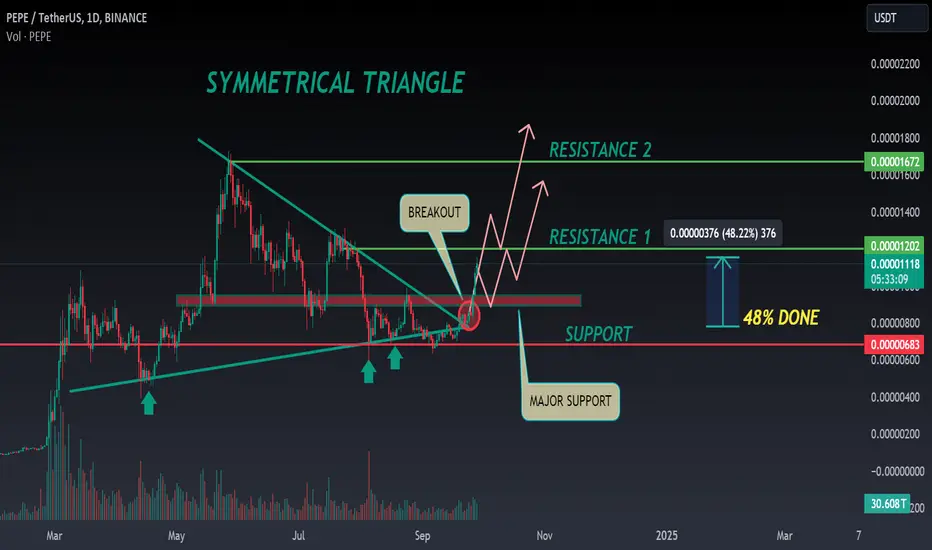
PEPE ANALYSIS (update)🔮 #PEPE Analysis - Update 🚀🚀
💲 As we said earlier #PEPE performed the same. More than 48% move already done in #PEPE. Now we can see a little retest towards it's major support zone and after that a bullish move would be seen
💸Current Price -- $0.00001109
📈Target Price -- $0.00001670
⁉️ What to do?
- We have marked crucial levels in the chart . We can trade according to the chart and make some profits. 🚀💸
#PEPE #Cryptocurrency #Breakout #DYOR
PEPE price prediction: is a 40% October rally on the horizon?Pepe (PEPE) bulls have really showed up since the second week of September. The memecoin is now on track to conclude the month in the green. But can it sustain the current momentum and what can we expect in October?
PEPE has been on an overall downtrend since May. The bearish momentum bottomed out within the $0.00000897 price range on multiple occasions. As a consequence, price has been leveling out at that range, followed by some bullish momentum.
Fibonacci retracement puts PEPE’s next major price target between $0.00001153 and $0.00001287. This is based on its current 5-month lows and 5-month highs.
This means PEPE could rally for another 26% on the lower price target and over 40% on the higher target.
PEPE addresses by time held may support the short-term prediction. The number of addresses holding PEPE for over 1 year has been rising since April. This confirms that most buyers (almost 85,000 addresses) who purchased the memecoin over a year ago are still holding.
As far as PEPE’s long-term price prediction is concerned, the memecoin could retest its previous ATH of $0.000017 sometime in the coming months, likely in 2025.
However, the likelihood of this happening depends on whether the bulls will make a strong comeback and deliver a major rally as per expectations. The latest recovery is in line with the shift in market sentiment in favor of the bulls this month.

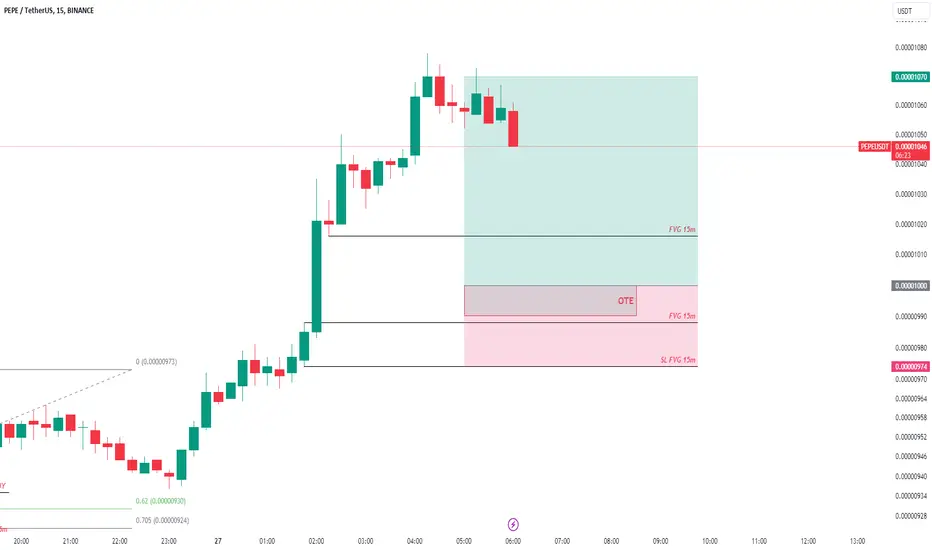
PEPEUSDTAs you can see in this chart we have to things
1. FVG in 15m
2. OTE from low and high
in this situation if we face this 2 parameters we can sell or buy
here we can buy
be careful and +++++
1D PEPEUSDT Potential Sell ZoneOn the daily chart for BINANCE:PEPEUSDT , there's a clear double top formation around the 0.00957 level, signaling potential exhaustion of the upward momentum. The price has tested this resistance area twice, failing to break higher, which suggests a reversal could be on the horizon.
The supply zone around 0.00957 coincides with a key monthly high, creating a strong ceiling for the price. If this resistance holds, I’m expecting a drop towards the demand zone at TP1: 0.008053 and potentially further down to TP2: 0.006967.
Entry Point: 0.0095708
TP1: 0.008053
TP2: 0.006967
Stop Loss: 0.010034
The double top pattern, combined with the overbought conditions on the RSI, indicates that bearish momentum could soon take over. The market might primed for a correction after failing to break the supply zone.
I’ll be closely watching for price rejection in the supply zone and a continuation of the downtrend towards TP1 and TP2. If momentum slows at TP1, I'll take partial profits; otherwise, I’ll hold for a deeper retracement into TP2.
Always trade at your own risk with a money you can lose.

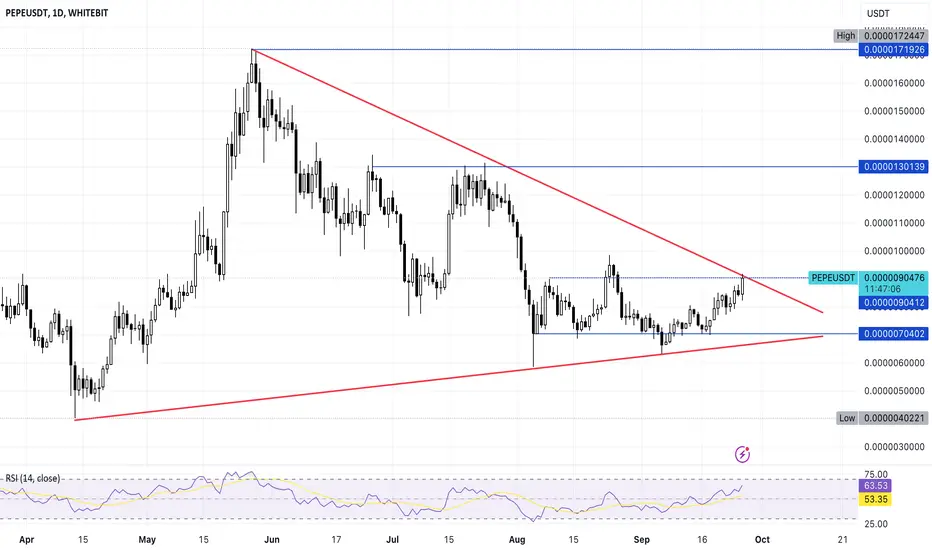
Pepe’s rally not over: here's whyDespite a challenging month with a 5.77% drawdown, Pepe (PEPE) recent performance shows promising signs of recovery, with a 16.11% increase on its weekly chart. Further bullish indicators suggest continued upward momentum.
At press time, the coin was trading within a symmetrical triangle, characterized by converging upper and lower lines that serve as resistance and support zones, respectively.
PEPE recently rallied from a significant horizontal support level at 0.00000701, ascending to the upper resistance of the triangle pattern at 0.00000876. This resistance line also aligns with another key resistance level, emphasizing the strength of the barrier.
While symmetrical triangles typically indicate potential bullish outcomes, a breakthrough above the upper resistance line is essential. Successfully breaching this level could propel the memecoin to its 2024 high of 0.00001725 or to a mid-level target of 0.00001307.
Should PEPE fail to overcome this resistance, it is likely to retreat to the horizontal support line at 0.00000701 or the lower boundary of the triangle, as it seeks to build momentum for another rally attempt.
Moreover, Open Interest, a key indicator that measures trader enthusiasm in the market, has seen a notable increase. It surged from $95.68 million on 23rd September to $114.39 million by 25th September, reflecting heightened trader interest in the memecoin.
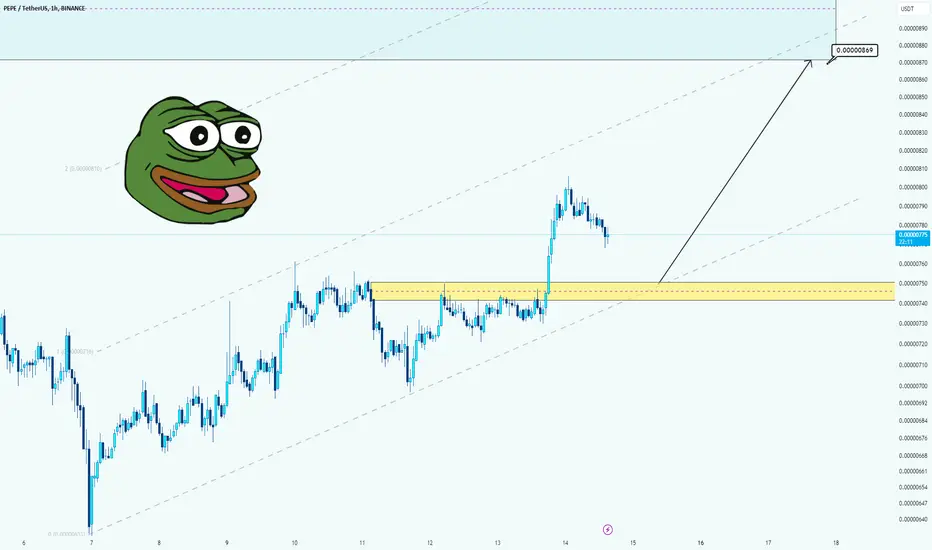
pepe → a position to get longhello guys.
pepe and lots more coins are bullish so much!
I am looking for an area to get the long position!
in this coin seems the yellow area is great to get the long position!
let's see if the price will do a pullback!
target:0.00000869
___________________________
✓✓✓ Always do your research.
❒❒❒ If you have any questions, you can write them in the comments below, and I will answer them.
❤︎ ❤︎ ❤︎And please don't forget to support this idea with your likes and comment
Looks Like We Have Long Scenario on PEPEBINANCE:PEPEUSDT
CRYPTO:PEPEUSD
SL1 ---> Low-risk status: 3x-4x Leverage
SL2 ---> Mid-risk status: 5x-8x Leverage
👾The setup is active but expect the uncertain phase as well.
➡️Entry Area:
Yellow box
⚡️TP:
0.00000803
0.00000816
0.00000833
0.00000850
🔴SL:
0.00000768
0.00000753
🧐The Alternate scenario:
If the price stabilizes below the trigger zone, the setup will be cancelled.

PEPE Long Spot Position (EMA Support Retest)Market Context: PEPE is currently finding support at the 21 and 200 daily EMAs. A close above the 200 EMA would serve as confirmation for entry.
Trade Setup:
Entry: Long spot position at $0.0000082.
Take Profit:
First target: $0.00000970
Second target: $0.000011
Third target: $0.0000125
Stop Loss: $0.0000075 (daily close)
⚡ This setup aims to leverage EMA support for a high-probability trade.
#PEPE #Crypto #EMAs