PEPECOINHello friends
Considering the price growth we had, you can see that the upward channel has been broken by the price correction and now you can enter the price correction.
The purchase and target points have also been determined...
Follow capital management.
*Trade safely with us*
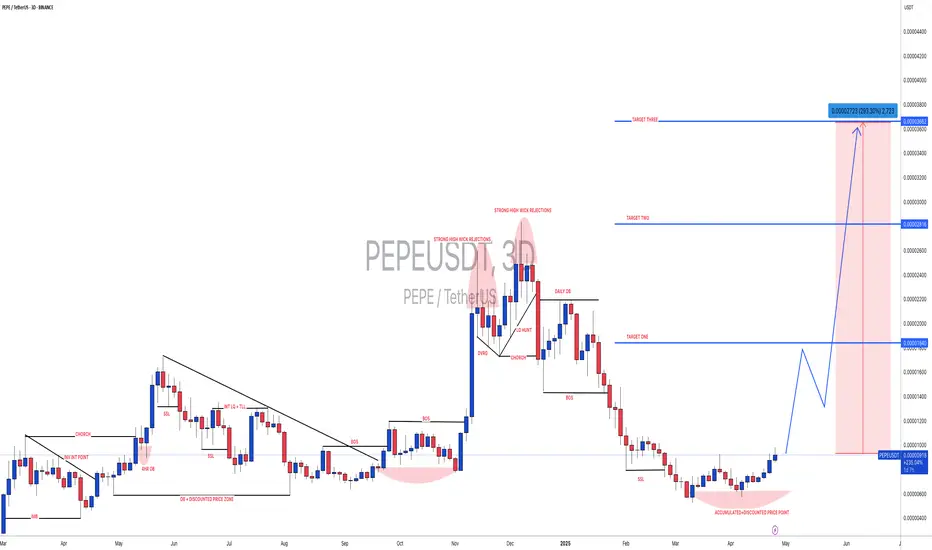
PEPEUSDT
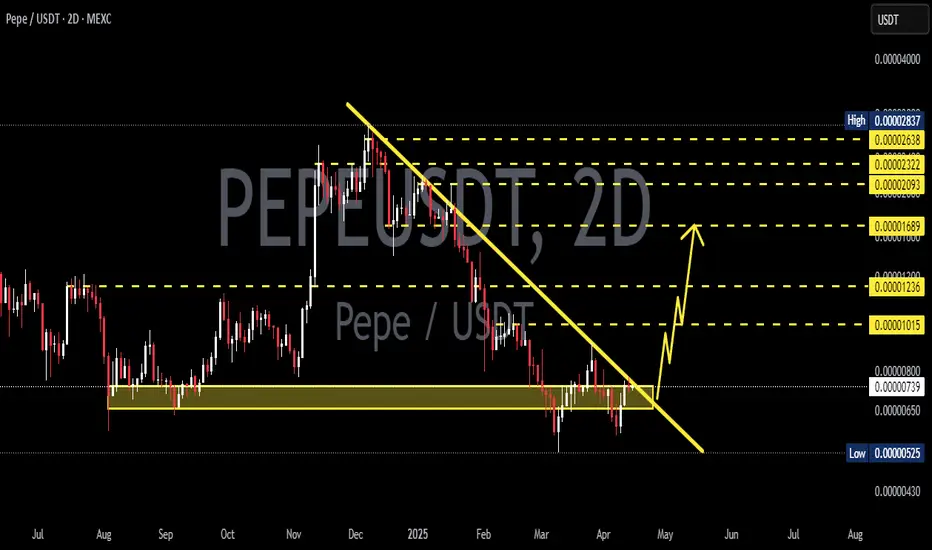
#PEPEUSDT: Ready to launch | Will price hit previous high? EPEUSDT’s price has accumulated and is currently in the distribution phase, where we can anticipate a bullish impulse pattern. There are three targets, but our long-term objective is for the price to surpass its previous record high. We anticipate the price to reach or even surpass the previous high.
Wishing you good luck and safe trading!
Thank you for your unwavering support! 😊
If you’d like to contribute, here are a few ways you can help us:
- Like our ideas
- Comment on our ideas
- Share our ideas
Team Setupsfx_
❤️🚀
PEPEUSDTBased on this analysis, wave E is complete and any retracement to around 0.0000078 is a buying opportunity.. and around 0.000017 to 0.000022 is the possible end zone of wave F..
Even if the price returns to the levels of 0.0000058 to 0.000005 once again, it will still be an ideal buying opportunity to buy spot.. And this is just a simple analysis and there is a possibility of error in it..

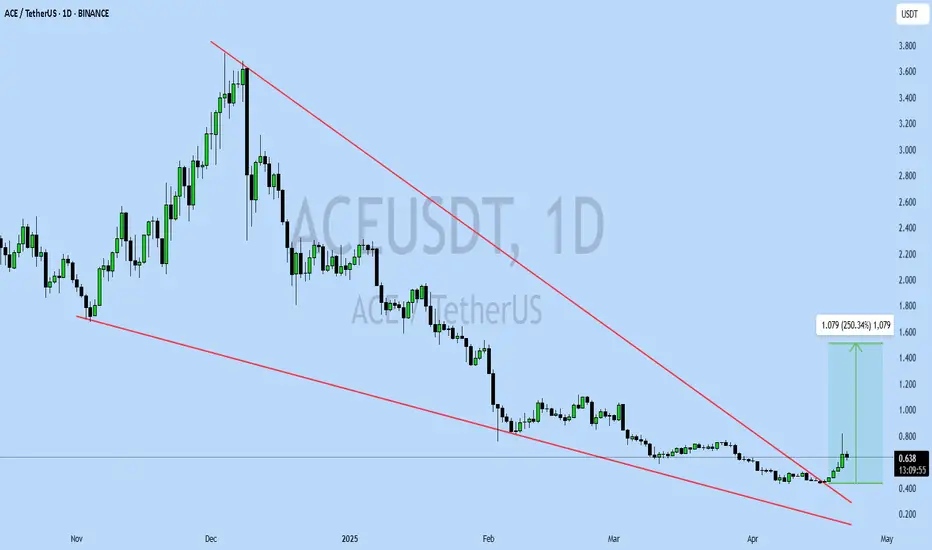
ACEUSDT UPDATEACE/USDT Technical Setup
Pattern: Falling Wedge Breakout
Current Price: $0.635
Target Price: $1.714
Target % Gain: 250.34%
Technical Analysis: ACE has broken out of a long-term falling wedge pattern on the 1D chart with strong bullish momentum. Volume has increased significantly, confirming the breakout with potential for a 250% upside move.
Time Frame: 1D
Risk Management Tip: Always use proper risk management.
BNB with a wrecking ball?BNB i dont know but ive felt and saw this pattern tremendous time to make a statement! A fall or a ball

PEPE : WHAT WE WANT?Hello friends
Given the good price growth, we see that we had a correction, which we found the support area using Fibonacci, and the price has returned from that area by buyers and is now in an ascending channel, which we expect to move to the specified targets.
Trade safely with us

Is PEPE About to Crash from Here? Key Bearish SignalsYello, Paradisers — have you been watching PEPE closely? Because if not, you might be walking right into a trap. We warned about this bearish setup in advance, and right now, PEPEUSDT is flashing multiple red flags that every serious trader needs to be aware of.
💎PEPE is currently sitting under heavy pressure at a confluence of resistance — the 200 EMA, the Fibonacci golden pocket, and a major supply zone. And here’s the critical part: it has just printed a bearish CHoCH (Change of Character), significantly increasing the probability of a deeper move down.
💎On top of that, the daily timeframe is showing bearish divergence, a classic warning sign that momentum is fading, while price tries to push higher. These conditions are aligning to suggest that the bulls may be running out of fuel.
💎If we do get a pullback, there’s potential for a high-probability short entry around the breaker block and the Fair Value Gap (FVG) zones — so keep a close eye there.
💎But be careful — this setup isn’t bulletproof.
💎If PEPE breaks out and closes a candle above our invalidation level, the entire bearish bias gets invalidated. In that case, the best move will be to stay on the sidelines and wait for stronger confirmation. Never force trades — especially in this kind of volatile setup.
🎖Strive for consistency, not quick profits. Treat the market as a businessman, not as a gambler. Our focus remains on executing only the highest-probability setups with proper risk management.
MyCryptoParadise
iFeel the success🌴

DEGOUSDT UPDATEDEGO/USDT Technical Setup
Pattern: Falling Wedge Breakout
Current Price: $1.808
Target Price: $3.70
Target % Gain: 115.05%
Technical Analysis: DEGO broke out of a falling wedge on the 1D chart, showing bullish momentum with a clean candle close above resistance and follow-through volume. Chart suggests potential continuation toward the measured target.
Time Frame: 1D
Risk Management Tip: Always use proper risk management.

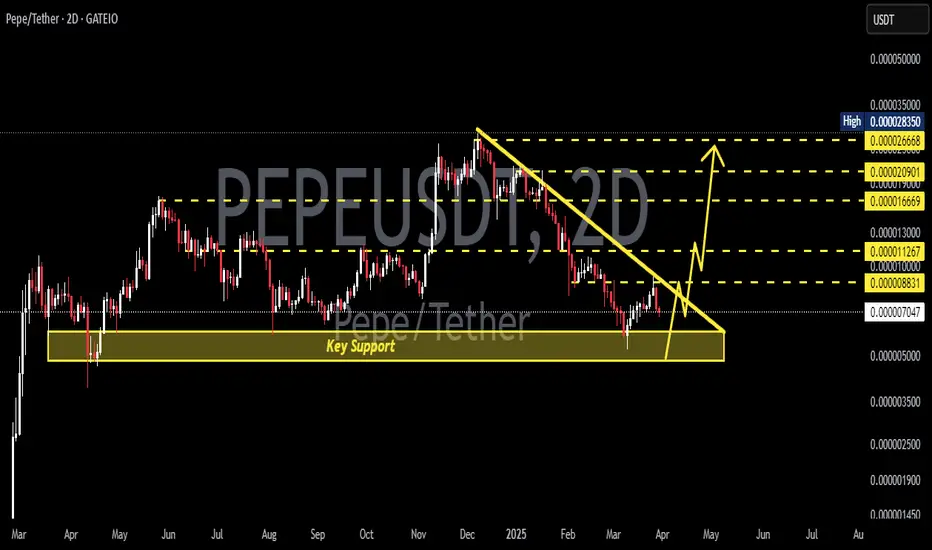
PEPEUSDT 2DPEPE ~ 2D Analysis
#PEPE Buy after successfully penetrating this resistant line with a short -term target of at least 15%+ from here.
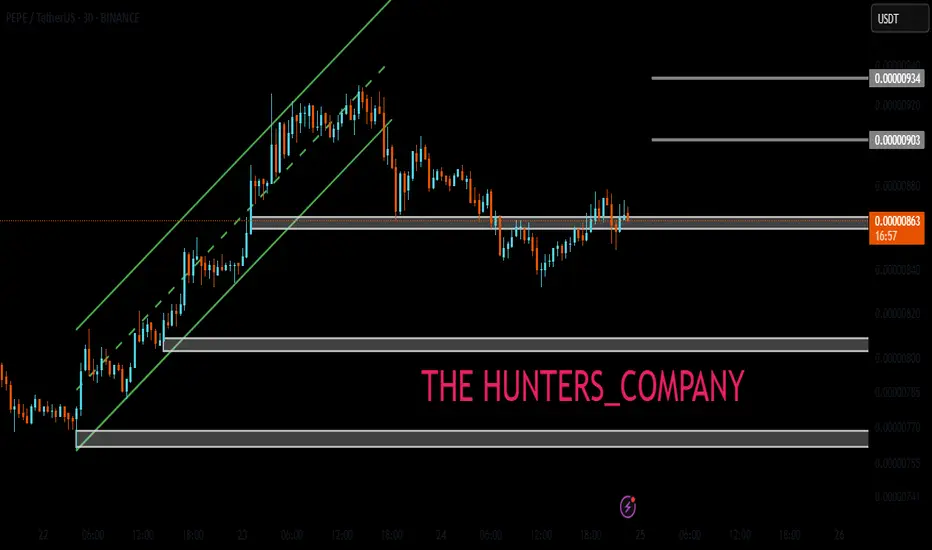
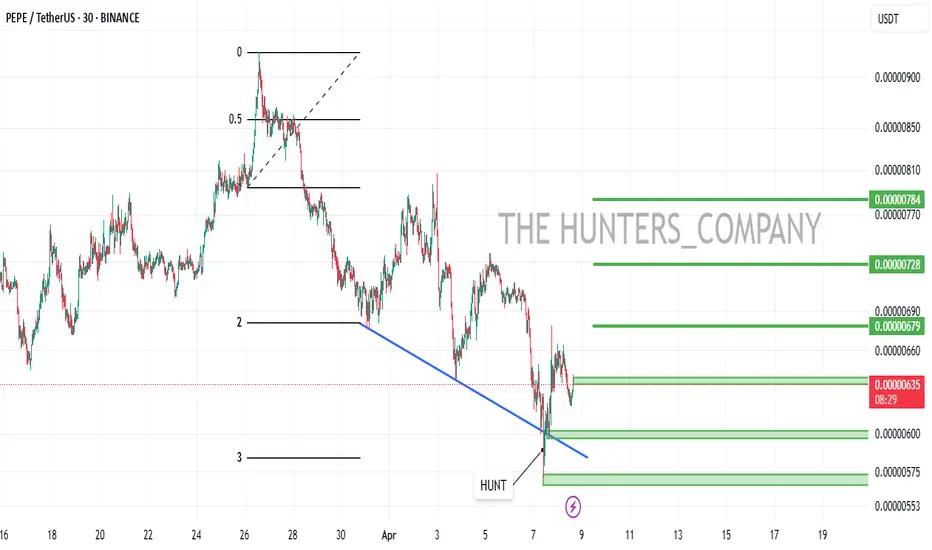
Opportunity in PEPEUSDT PEPEUSDT has just broken its previous high and is attempting to retrace to the 0.00000665 - 0.00000656 range. This could present an opportunity to join the uptrend.
Price reversal confirmation >0.00000679.
Upside target 0.00000728 - 0.00000737.
Invalid level below 0.00000663
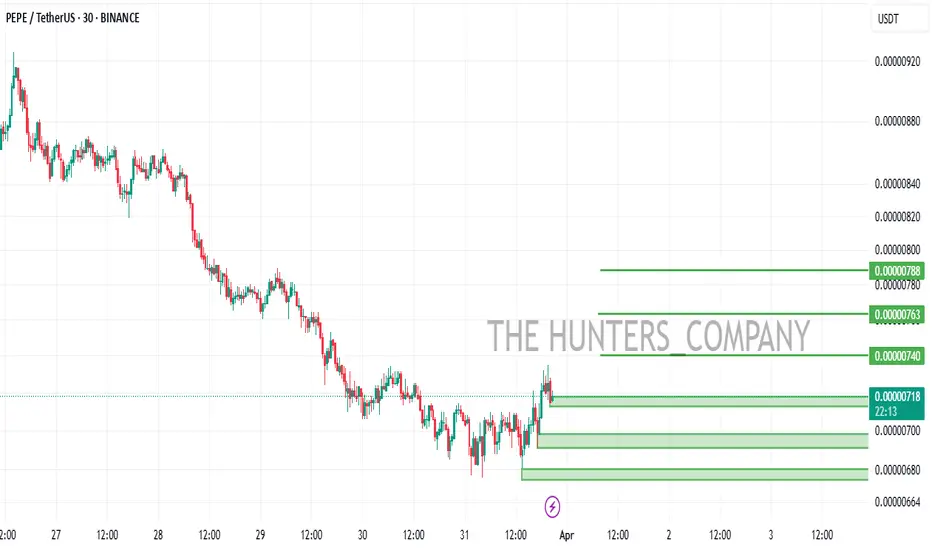
PEPE/USDT:BUY!!!Hello friends
Due to the heavy price drop we had, the market has fallen into fear and the price has been well supported in the specified support area, according to which we can buy in steps in the specified areas with capital and risk management and move to the specified goals.
Always buy in fear and sell in greed.
*Trade safely with us*
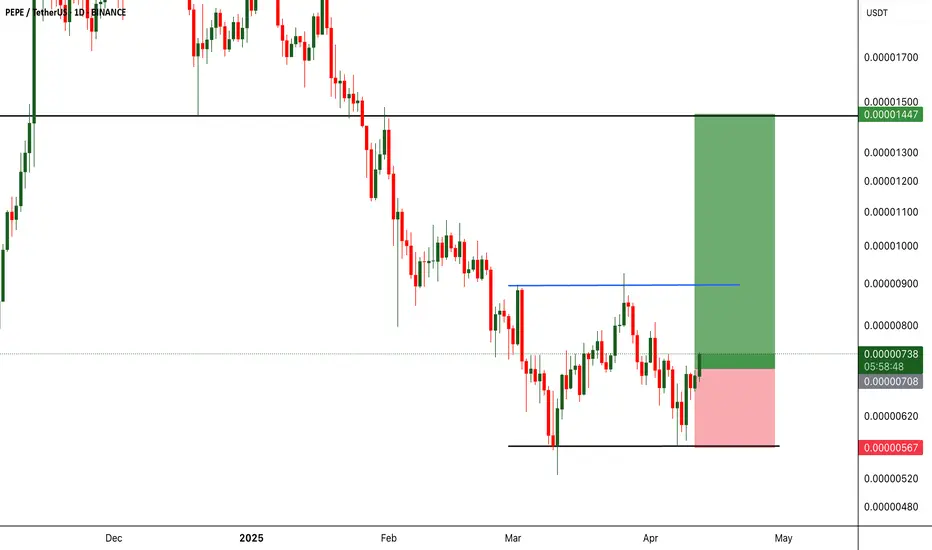
PEPEUSDT Eyes the Sky!BINANCE:PEPEUSDT has shown a strong bounce from a key support level, signaling potential for a continued bullish move. The overall market sentiment is positive, which could act as a catalyst for further upside. With the price structure leaning bullish and momentum picking up, there’s a good chance we’ll see higher highs in the coming sessions. Traders should keep an eye on the next resistance zone as a possible target while maintaining disciplined risk management. Always trade with a clear plan—and most importantly, don’t forget your stop loss!
$1000PEPEUSDT Currently trading at $0.00735
Buy level : Above $0.0071
Stop loss : Below $0.0056
Target : $0.0145
Max leverage 3x
Always keep Stop loss
Follow Our Tradingview Account for More Technical Analysis Updates, | Like, Share and Comment Your thoughts
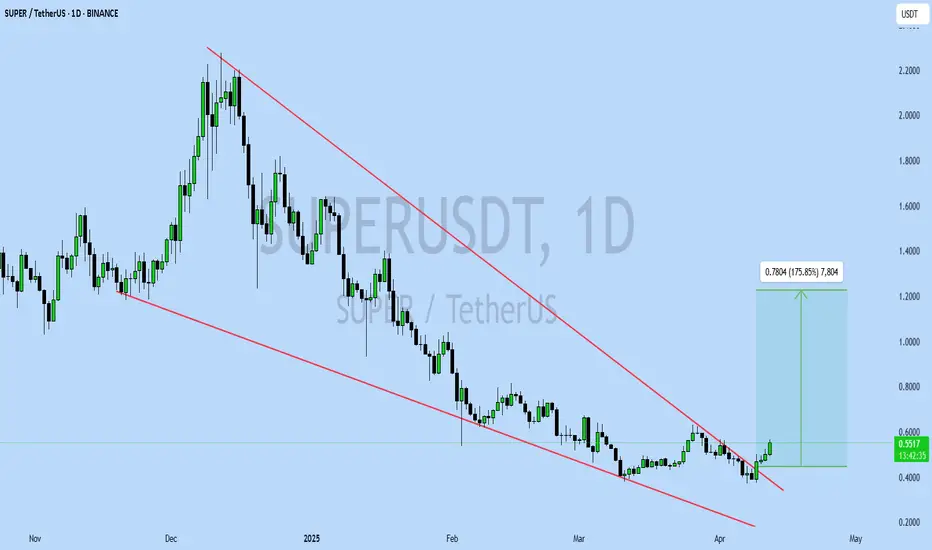
SUPERUSDT UPDATESUPERUSDT is a cryptocurrency trading at $0.5519, with a target price of $1.2000. This represents a potential gain of over 170%. The technical pattern observed is a Bullish Falling Wedge, indicating a possible trend reversal. This pattern suggests that the downward trend may be coming to an end. A breakout from the wedge could lead to a significant upward movement in price. The Bullish Falling Wedge is a positive indicator, signaling a potential price surge. Investors are showing optimism about SUPERUSDT's future performance. The current price may present a buying opportunity. Reaching the target price would result in substantial returns for investors. SUPERUSDT is positioned for a potential breakout and significant gains.
Corrective waves continue on the chart.I don't think there will be enough demand before new lows come.
* The purpose of my graphic drawings is purely educational.
* What i write here is not an investment advice. Please do your own research before investing in any asset.
* Never take my personal opinions as investment advice, you may lose your money.

Long idea on $PEPEAfter completing its full growth, this altcoin has formed a larger-scale correction, and now I believe there will only be a technical rebound within the broader correction.

STRAXUSDT UPDATESTRAXUSDT is a cryptocurrency trading at $0.04440, with a target price of $0.07000. This represents a potential gain of over 80%. The technical pattern observed is a Bullish Falling Wedge, indicating a possible trend reversal. This pattern suggests that the downward trend may be coming to an end. A breakout from the wedge could lead to a significant upward movement in price. The Bullish Falling Wedge is a positive indicator, signaling a potential price surge. Investors are showing optimism about STRAXUSDT's future performance. The current price may present a buying opportunity. Reaching the target price would result in substantial returns for investors. STRAXUSDT is positioned for a potential breakout and significant gains.

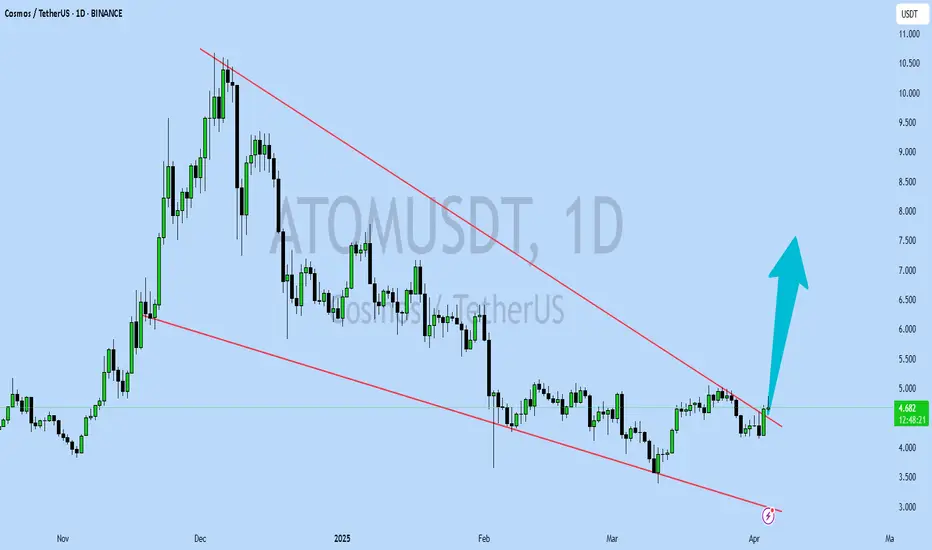
ATOMUSDT UPDATEATOMUSDT is a cryptocurrency trading at $4.700, with a target price of $7.500. This represents a potential gain of over 60%. The technical pattern observed is a Bullish Falling Wedge, indicating a possible trend reversal. This pattern suggests that the downward trend may be coming to an end. A breakout from the wedge could lead to a significant upward movement in price. The Bullish Falling Wedge is a positive indicator, signaling a potential price surge. Investors are showing optimism about ATOMUSDT's future performance. The current price may present a buying opportunity. Reaching the target price would result in substantial returns for investors. ATOMUSDT is positioned for a potential breakout and significant gains.
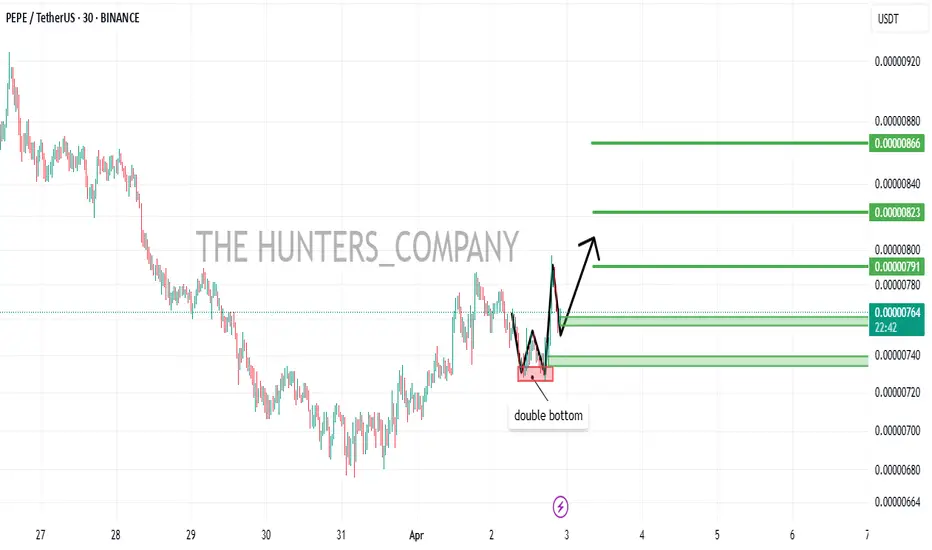
PEPE/USDT:FREE SIGNALHello dear friends
Given the price drop we had in the specified support range, a double bottom pattern has formed, indicating the entry of buyers.
Now, given the good support of buyers for the price, we can buy in steps with capital and risk management and move to the specified targets.
*Trade safely with us*
PEPE Ready to Dump? This Key Zone Could Trigger a Sharp ReversalYello Paradisers — did you catch the recent shift on PEPEUSDT? If not, now’s the time to zoom in, because the setup is looking primed for a big move, and you don’t want to be caught on the wrong side.
💎PEPEUSDT has broken out of Ascending Channel & shown a clear bearish CHoCH (Change of Character), confirming a shift in market structure. Following that, we’ve now seen a proper pullback. Currently, the price is sitting right at a critical resistance zone.
💎What makes this zone especially significant is the confluence of technical factors stacked at the same level — the 200 EMA, a Fair Value Gap (FVG), and the Fibonacci Golden Zone are all present. This combination significantly increases the probability of a bearish move from here.
💎If PEPE breaks out and closes a candle above our invalidation level, the entire bearish idea gets invalidated.
🎖Paradisers; the next 6–9 months will be juicy for some and painful for others. Discipline, patience, robust strategies, and trading tactics are the only ways you can make it long-term in this market.
MyCryptoParadise
iFeel the success🌴

CFXUSDT UPDATECFXUSDT is a cryptocurrency trading at $0.0788, with a target price of $0.1400. This represents a potential gain of over 80%. The technical pattern observed is a Bullish Falling Wedge, indicating a possible trend reversal. This pattern suggests that the downward trend may be coming to an end. A breakout from the wedge could lead to a significant upward movement in price. The Bullish Falling Wedge is a positive indicator, signaling a potential price surge. Investors are showing optimism about CFXUSDT's future performance. The current price may present a buying opportunity. Reaching the target price would result in substantial returns for investors. CFXUSDT is positioned for a potential breakout and significant gains.

DownLike others, PEPE was unable to maintain the support zone, and lower targets are now on the way.

PEPE(UPDATE)Hello friends
Due to the heavy price drop, you can see that buyers are slowly entering, and now there is a good opportunity to buy in stages and with capital management and move towards the specified goals.
Don't forget to save profit on each target.
*Trade safely with us*
PEPEUSDT 2DPEPE ~ 2D Analysis
#PEPE Buy gradually after re -testing this support with a short -term target of at least 15%+.