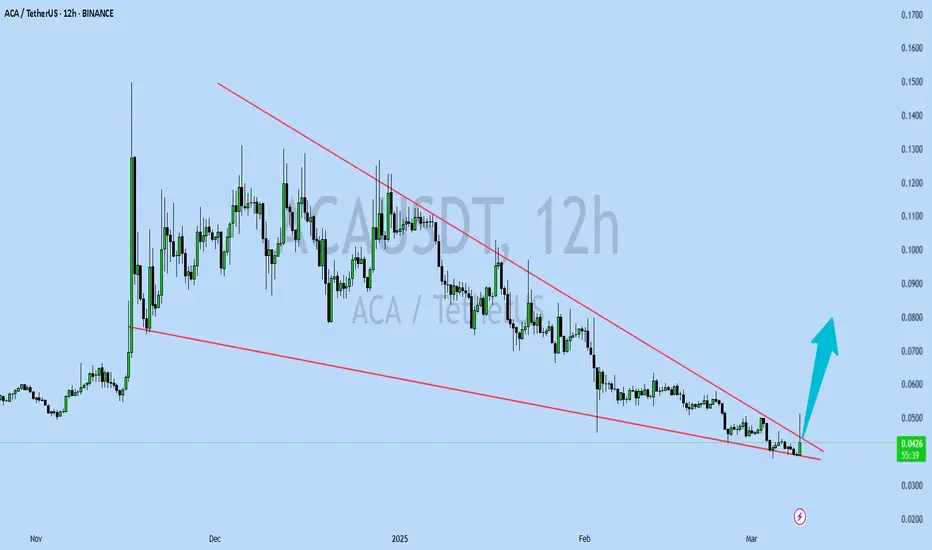
ACAUSDT UPDATEACAUSDT is a cryptocurrency trading at $0.0430. Its target price is $0.0800, indicating a potential 80%+ gain. The pattern is a Bullish Falling Wedge, a reversal pattern signaling a trend change. This pattern suggests the downward trend may be ending. A breakout from the wedge could lead to a strong upward move. The Bullish Falling Wedge is a positive signal, indicating a potential price surge. Investors are optimistic about ACAUSDT's future performance. The current price may be a buying opportunity. Reaching the target price would result in significant returns. ACAUSDT is poised for a potential breakout and substantial gains.
PEPEUSDT
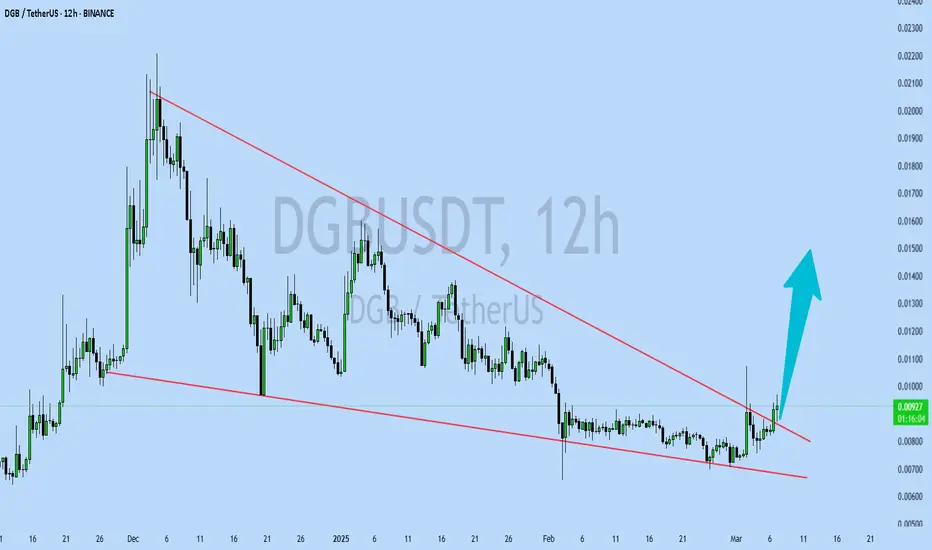
DGBUSDT UPDATEDGBUSDT is a cryptocurrency trading at $0.00926. Its target price is $0.01500, indicating a potential 70%+ gain. The pattern is a Bullish Falling Wedge, a reversal pattern signaling a trend change. This pattern suggests the downward trend may be ending. A breakout from the wedge could lead to a strong upward move. The Bullish Falling Wedge is a positive signal, indicating a potential price surge. Investors are optimistic about DGBUSDT's future performance. The current price may be a buying opportunity. Reaching the target price would result in significant returns. DGBUSDT is poised for a potential breakout and substantial gains.
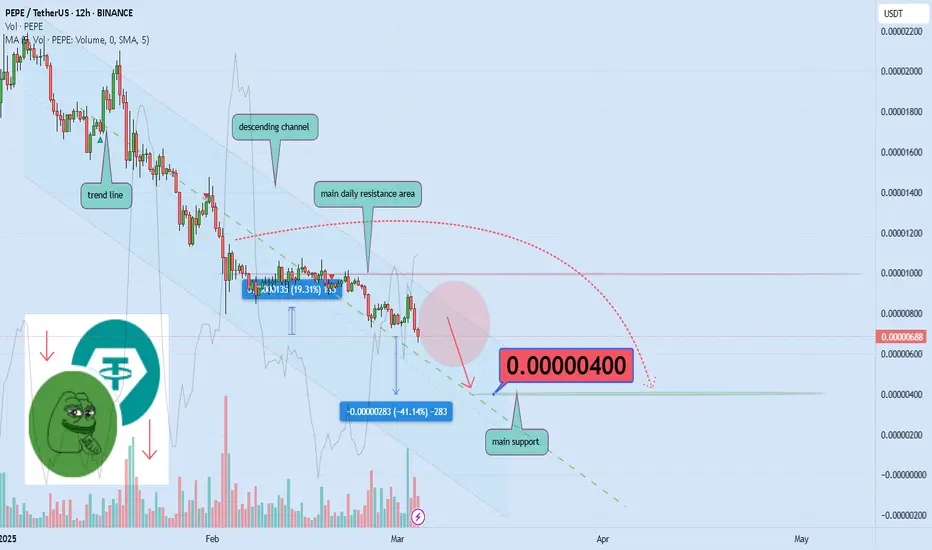
Key Resistance Zone for Pepe – 40% Drop Ahead?Hello and greetings to all the crypto enthusiasts, ✌
All previous targets were nailed ✅! Now, let’s dive into a full analysis of the upcoming price potential for Pepe 🔍📈.
Pepe Meme Coin is experiencing an unusual sharp downtrend, approaching a critical monthly resistance zone. If this level breaks, the price could drop another 40% to the 0.00000400 support area, which has historically acted as strong defense. The key question now is whether this support can withstand the selling pressure in the coming days.📚🙌
🧨 Our team's main opinion is: 🧨
Pepe Meme Coin is in a sharp downtrend, facing key resistance, with a potential 40% drop if support at 0.00000400 fails. 📚🎇
Give me some energy !!
✨We invest hours crafting valuable ideas, and your support means everything—feel free to ask questions in the comments! 😊💬
Cheers, Mad Whale. 🐋
Breaking: The $PEPE X Account Has Been CompromiseThe CRYPTOCAP:PEPE team took to their telegram community to announced that the official X (Formerly Twitter) account has been compromise. Needless to say that the token was already down 3.54% as of the time of writing. With the RSI sitting at 36 more selling pressure could surmount.
What Is PEPE?
PEPE is a deflationary memecoin launched on Ethereum. The cryptocurrency was created as a tribute to the Pepe the Frog internet meme, created by Matt Furie, which gained popularity in the early 2000s.
The project aims to capitalize on the popularity of meme coins, like Shiba Inu and Dogecoin, and strives to establish itself as one of the top meme-based cryptocurrencies. PEPE appeals to the cryptocurrency community by instituting a no-tax policy and being up-front about its lack of utility, keeping things pure and simple as a memecoin
Pepe Price Live Data
The live Pepe price today is $0.000007 USD with a 24-hour trading volume of $454,987,385 USD. We update our PEPE to USD price in real-time. Pepe is down 4.22% in the last 24 hours, with a live market cap of $2,861,929,455 USD. It has a circulating supply of 420,689,899,653,544 PEPE coins and a max. supply of 420,690,000,000,000 PEPE coins.

PEPE BUY (UPDATE)hello friends
Considering the recent drop, the price has now returned well and it can be said that buyers are coming in little by little...
Now we have identified the good support points for you, which you can buy stepwise and with capital management.
*Trade safely with us*

PEPE UPDATE : AGAIN BUYhello friends
Due to the fall of this currency, we are now at the price floor and good conditions have been provided for buying, of course, with capital and risk management...
*Trade safely with us*
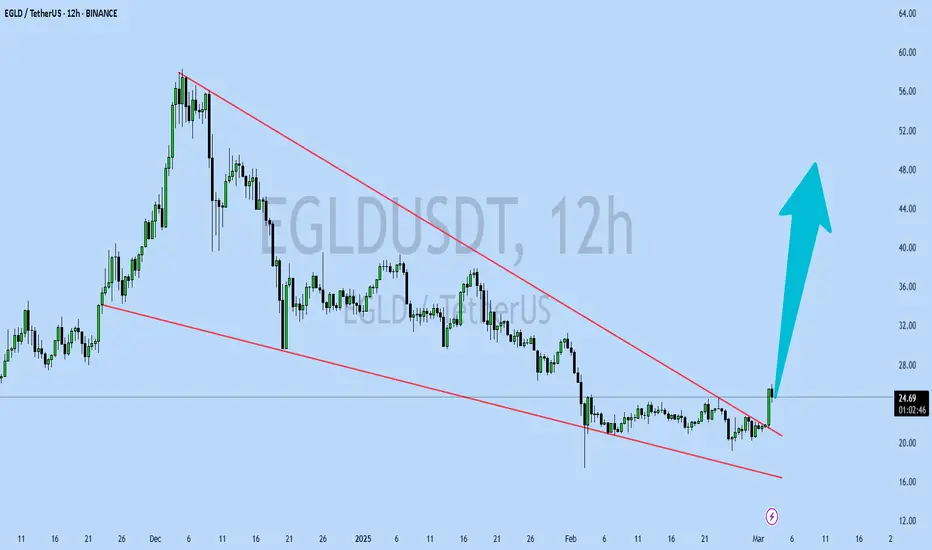
EGLDUSDT UPDATEEGLDUSDT is a cryptocurrency trading at $24.65. Its target price is $48.00, indicating a potential 90%+ gain. The pattern is a Bullish Falling Wedge, a reversal pattern signaling a trend change. This pattern suggests the downward trend may be ending. A breakout from the wedge could lead to a strong upward move. The Bullish Falling Wedge is a positive signal, indicating a potential price surge. Investors are optimistic about EGLDUSDT's future performance. The current price may be a buying opportunity. Reaching the target price would result in significant returns. EGLDUSDT is poised for a potential breakout and substantial gains.
COTIUSDT UPDATECOTIUSDT is a cryptocurrency trading at $0.08793. Its target price is $0.15000, indicating a potential 80%+ gain. The pattern is a Bullish Falling Wedge, a reversal pattern signaling a trend change. This pattern suggests the downward trend may be ending. A breakout from the wedge could lead to a strong upward move. The Bullish Falling Wedge is a positive signal, indicating a potential price surge. Investors are optimistic about COTIUSDT's future performance. The current price may be a buying opportunity. Reaching the target price would result in significant returns. COTIUSDT is poised for a potential breakout and substantial gains.

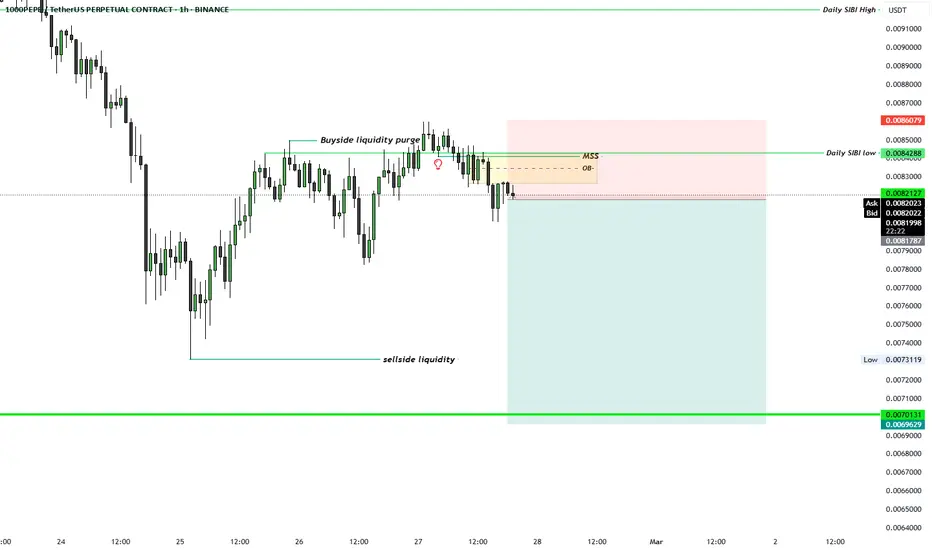
Bearish opportunity in PEPE1. On the daily chart price has purged to Daily SIBI LOW - This is my main PD array
2. On H1 we have MSS confirming orderflow
3. We have draws as the sellside liquidity
On the fundamental side:
"The SEC just said that meme coins are generally NOT considered securities under US federal law.
They also said that meme coins have "limited or no use" and do not need to be registered with the SEC.
"Did the SEC basically just call meme coins so worthless that they're not even considered a security? "
"quoted from the, The Kobeissi Letter on X/Twitter"
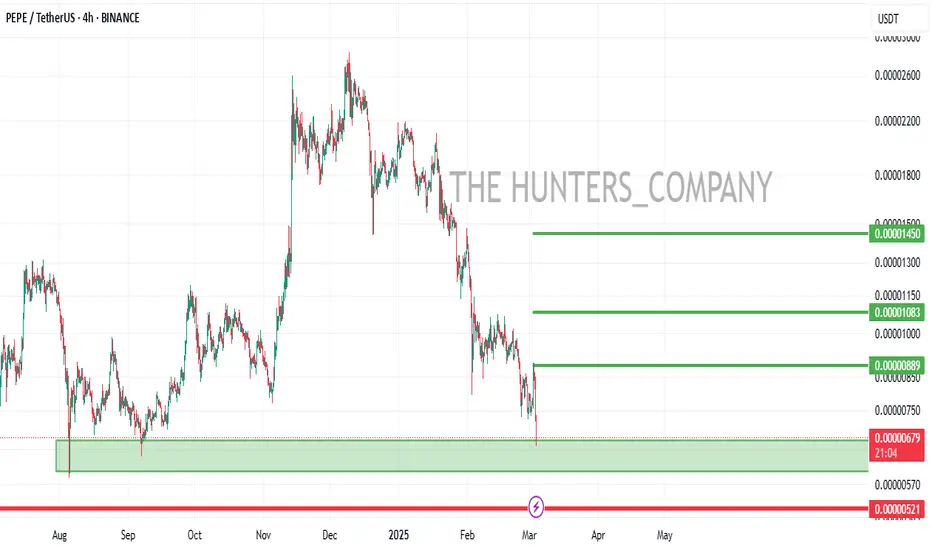
PEPE/USDT Breakout Watch: Key Level to Trigger a Bullish SurgeKey Level Analysis
The phrase "if the price closes above this level then" suggests a confirmation level that must be broken for an upward move.
The highlighted level seems to be an area of previous support-turned-resistance (around 0.00001150 - 0.00001200 USDT).
If the price closes above this level on the weekly timeframe, it signals:
Breakout confirmation → Likely leading to a strong bullish rally.
Trend reversal → A shift from bearish to bullish structure.
Momentum entry point → A trigger for potential buy positions.
Potential Price Movement
If the weekly close is above the key level:
The price could rally significantly (illustrated by the large blue arrow).
Next resistance levels could be around 0.00001700 - 0.00002200 USDT.
If the price fails to close above the level:
It could mean a continuation of the downtrend.
Retesting lower support areas around 0.00000650 - 0.00000550 USDT.

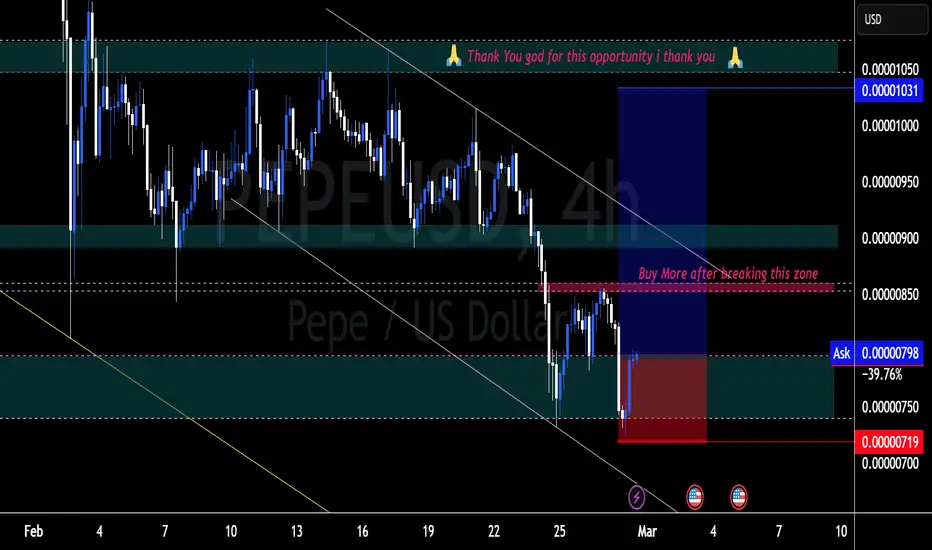
PEPUSD POTENTIAL SETUP
**Overview:**
PEPEUSD is currently trading within a descending channel, respecting key supply and demand zones. The market is approaching a critical decision point that could determine the next major move.
**Key Levels:**
🔹 **Support:** 0.00000719 - Strong demand zone where price has recently bounced.
🔹 **Resistance:** 0.00000850 - Key breakout level to watch.
🔹 **Major Target:** 0.00001031 - Potential upside target if bullish momentum takes over.
**Analysis:**
- The price is currently in a downward structure but has shown signs of potential reversal from the demand zone.
- A **break above the 0.00000850 zone** could confirm bullish momentum, making it a strong area to accumulate more positions.
- If the price fails to break this resistance, we may see further consolidation or a continuation of the downtrend.
**Trade Plan:**
📌 **Bullish Scenario:**
- Wait for a confirmed breakout and retest of 0.00000850 before entering long.
- Target **0.00001031** with a proper risk-reward setup.
📌 **Bearish Scenario:**
- If price rejects resistance, short opportunities could be considered with a stop above the resistance.
- Target the previous low at **0.00000719** for a potential retracement.
*Final Thoughts:**
This setup requires patience and confirmation. Always manage risk accordingly and wait for clear price action signals before executing trades. 🚀📊
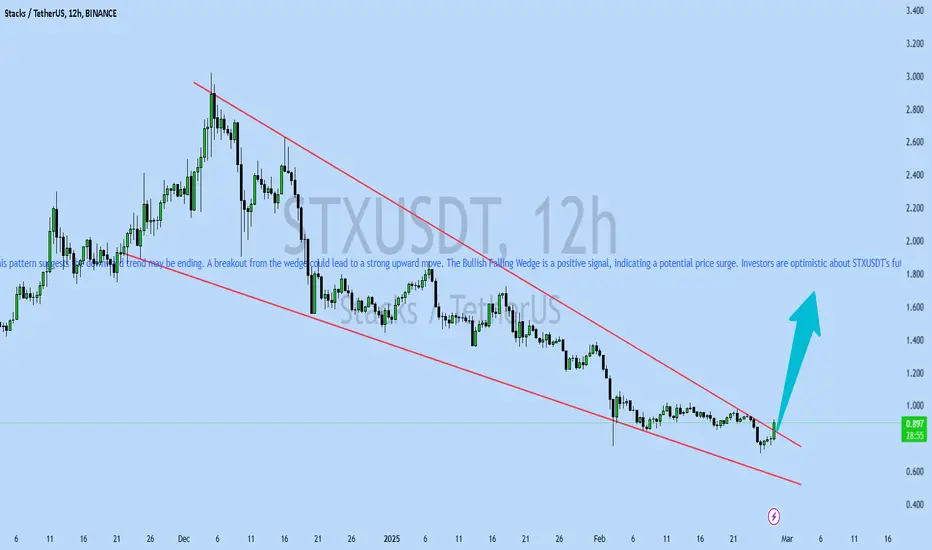
STXUSDT UPDATESTXUSDT is a cryptocurrency trading at $0.900. Its target price is $1.600, indicating a potential 90%+ gain. The pattern is a Bullish Falling Wedge, a reversal pattern signaling a trend change. This pattern suggests the downward trend may be ending. A breakout from the wedge could lead to a strong upward move. The Bullish Falling Wedge is a positive signal, indicating a potential price surge. Investors are optimistic about STXUSDT's future performance. The current price may be a buying opportunity. Reaching the target price would result in significant returns. STXUSDT is poised for a potential breakout and substantial gains.
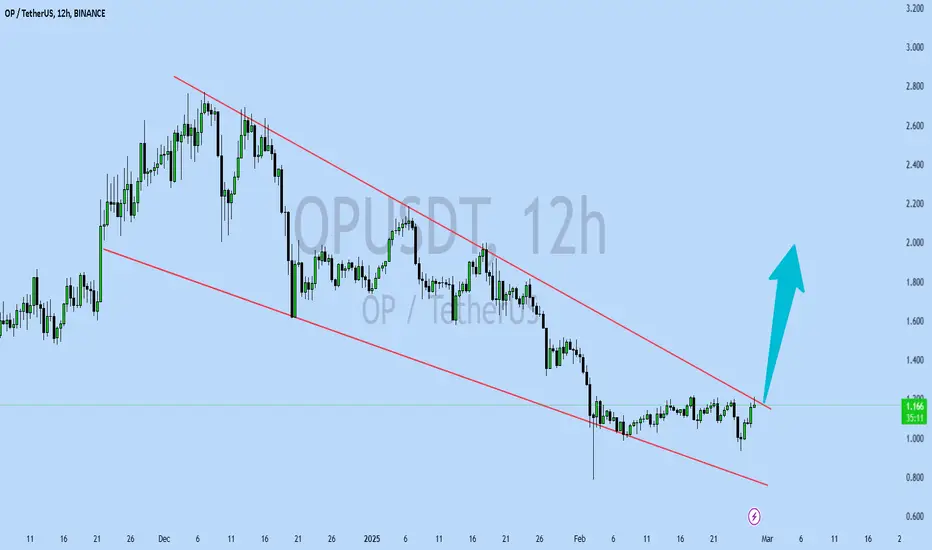
OPUSDT UPDATEOPUSDT is a cryptocurrency trading at $2.000. However, the target price is unusually lower at $0.600, which seems incorrect. Typically, a target price is higher than the current price. Assuming the target price is actually higher, the potential gain would be significant. The pattern is a Bullish Falling Wedge, a reversal pattern signaling a trend change. This pattern suggests the downward trend may be ending. A breakout from the wedge could lead to a strong upward move. The Bullish Falling Wedge is a positive signal, indicating a potential price surge. Investors are optimistic about OPUSDT's future performance. The current price may be a buying opportunity. Reaching the corrected target price would result in significant returns.
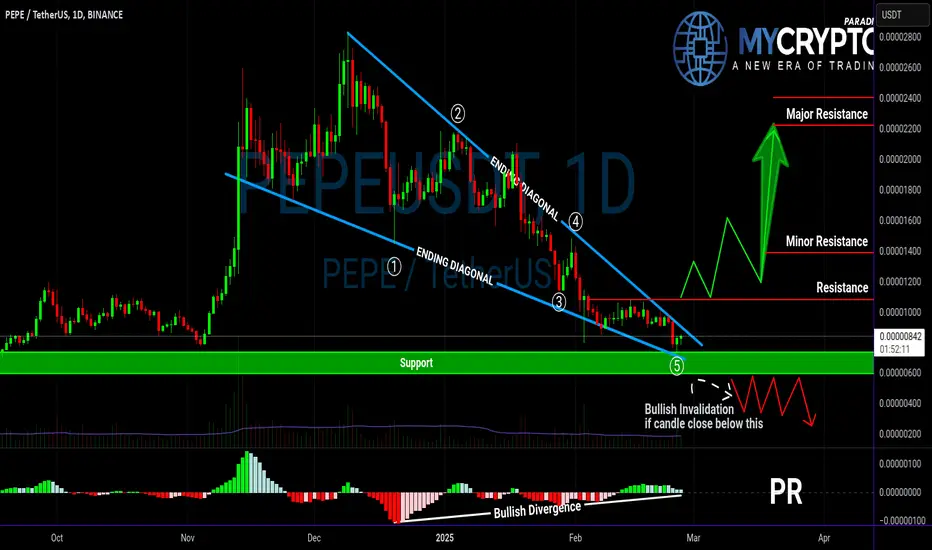
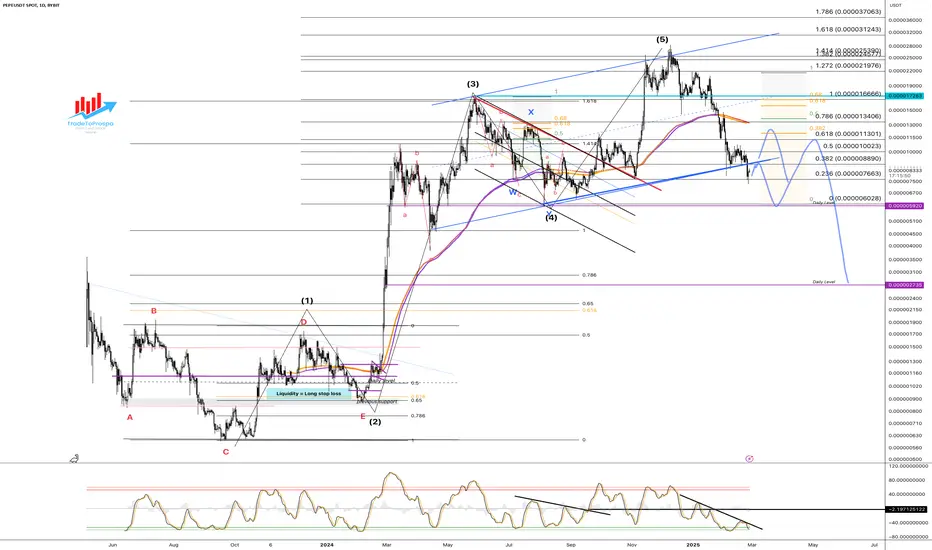
PEPEUSDT: A Massive Move Incoming?Yello, Paradisers! Is PEPEUSDT gearing up for a breakout, or will it crumble under pressure? Let's break it down.
💎PEPEUSDT has formed an ending diagonal with a clear 5-wave structure and bullish divergence, increasing the probability of an upcoming bullish move. But here's the catch—it all depends on key levels and volume confirmation.
💎If PEPEUSDT breaks out and closes a candle above resistance with strong volume, it will signal strength and increase the likelihood of a continued bullish push.
💎If price consolidates with weak volume, it’s better to stay on the sidelines—especially with the broader crypto market looking bearish for now. No need to force trades.
💎However, If PEPEUSDT breaks down and closes below the support zone, it completely invalidates the bullish setup. In this case, stepping aside is the best move.
🎖 Discipline and patience always win in this market, Paradisers. If the market gives confirmation, we strike. If not, we wait. Trade smart!
MyCryptoParadise
iFeel the success 🌴
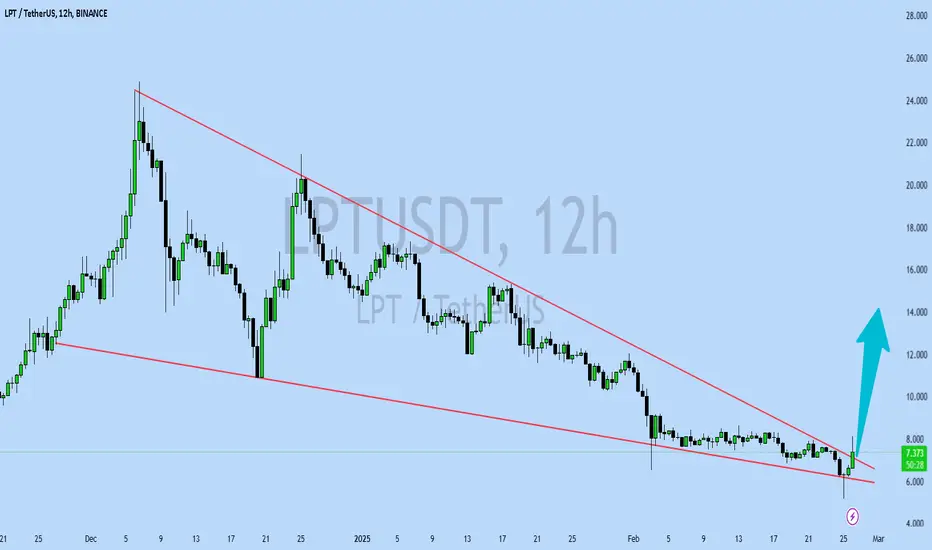
LPTUSDT UPDATELPTUSDT is a cryptocurrency trading at $7.414. Its target price is $14.000, indicating a potential 90%+ gain. The pattern is a Bullish Falling Wedge, a reversal pattern signaling a trend change. This pattern suggests the downward trend may be ending. A breakout from the wedge could lead to a strong upward move. The Bullish Falling Wedge is a positive signal, indicating a potential price surge. Investors are optimistic about LPTUSDT's future performance. The current price may be a buying opportunity. Reaching the target price would result in significant returns. LPTUSDT is poised for a potential breakout and substantial gains.
PEPE (Y25.P1.E1). Top is done. Hi Traders,
Diagonal wave 5 confirmed in my opinion. From a wyckoff perspective, I see this as distribution with wave 2 to 3 in progress.
The neckline is clear, the grinding support line has been compromised so refer to the wyckoff models for the last stages before it drops.
Hence I'm looking for a nice spot to short.
The indicator might help a little to find an entry for a long or short in the coming days or weeks.
All the best,
S.SAri
Market Update: Caution on $PEPEMarket Update: Caution on CRYPTOCAP:PEPE
There was hope. The consolidation looked exhausted, and a daily pump was forming.
Then Bybit got hacked , Bitcoin dumped, and now everything seems canceled.
⚠️ Warning: CRYPTOCAP:PEPE , despite being a solid and well-managed meme coin, is still a meme. Institutions appear to be selling off anything that looks like an animal in crypto.
What to Do Now?
✅ Wait for market stabilization— CRYPTOCAP:PEPE is at an attractive price, but it can drop much lower.
✅ Refill your bag at the bottom of the correction, not during dead cat bounces —unless you're a pro at trading bearish markets.
The Reversal Will Be EPIC! 🚀
This is temporary. Once the market bottoms out, the bounce could be massive. CRYPTOCAP:PEPE can do x2 or x3 in a month when sentiment improves!
🔍 DYOR

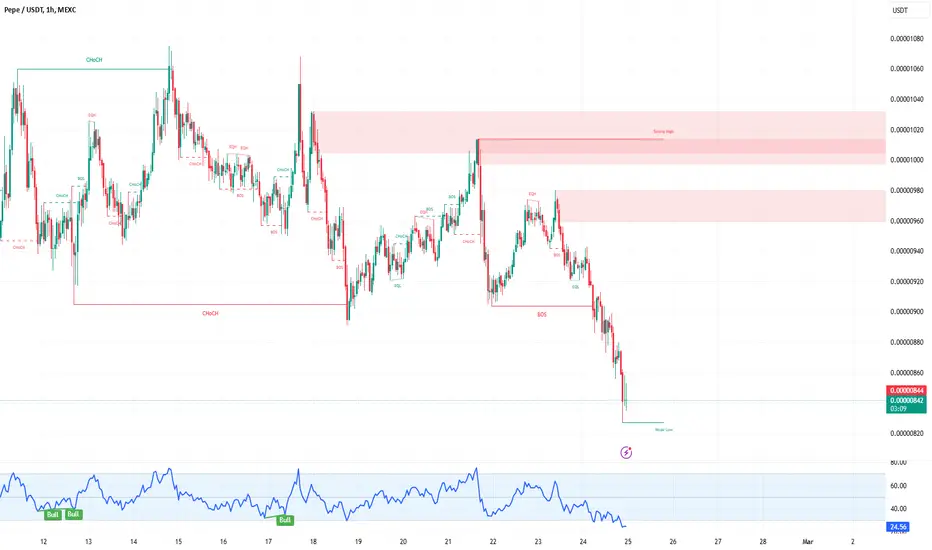
"PEPE/USDT 1H: Downtrend Persists – Wait for Reversal !PEPE/USDT 1H: Downtrend Persists – Wait for Reversal Confirmation?
Current Market Structure:
Bearish downtrend with clear lower lows and lower highs.
RSI at 24.56, indicating oversold conditions, but no clear divergence has emerged.
Market Maker Activity:
Distribution phase is complete; the market is now in a markdown phase.
Smart money appears to be distributing at higher levels.
Key Levels:
Resistance: 0.00001020
Support: 0.00000842 (current)
Major Resistance: 0.00001040
Risk Assessment:
8/10 – High-risk environment.
Recommendation:
Do not take a long position despite oversold conditions.
Wait for a clear reversal pattern or a double bottom formation before considering entries, as current price action suggests further downside.
Confidence Level:
7/10 based on clear market structure and volume profile.
🚀 Follow me on TradingView if you respect our charts! 📈 Daily updates!
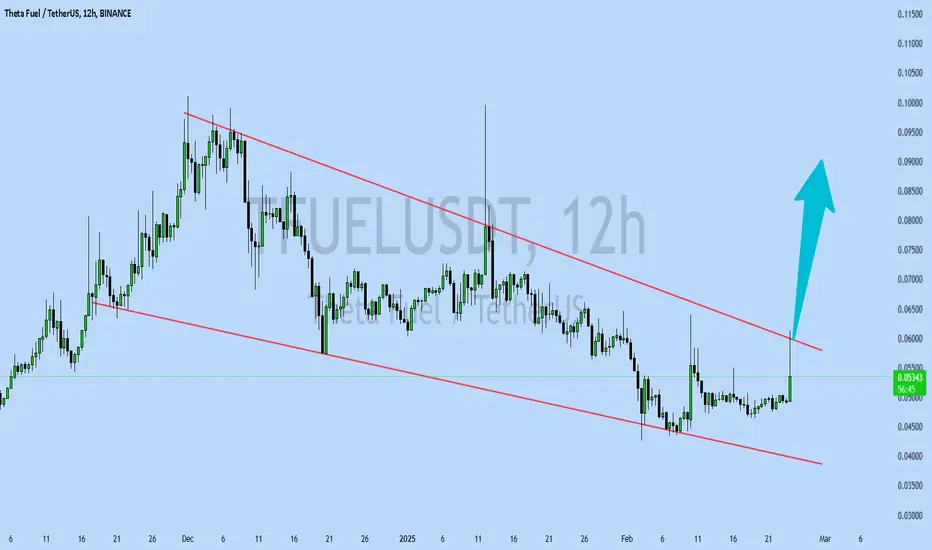
TFUELUSDT UPDATETFUELUSDT is a cryptocurrency trading at $0.05370. Its target price is $0.09000, indicating a potential 50%+ gain. The pattern is a Bullish Falling Wedge, a reversal pattern signaling a trend change. This pattern suggests the downward trend may be ending. A breakout from the wedge could lead to a strong upward move. The Bullish Falling Wedge is a positive signal, indicating a potential price surge. Investors are optimistic about TFUELUSDT's future performance. The current price may be a buying opportunity. Reaching the target price would result in significant returns. TFUELUSDT is poised for a potential breakout and substantial gains.
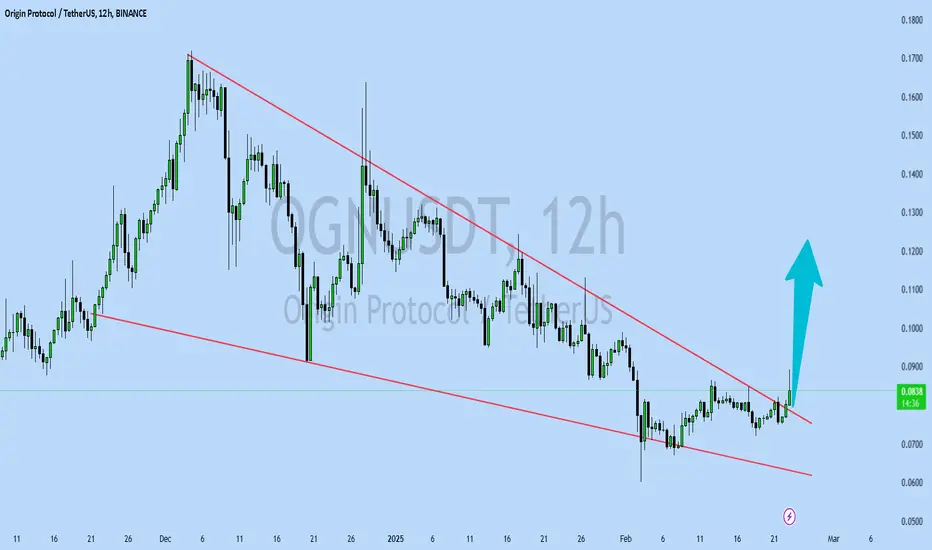
OGNUSDT UPDATEOGNUSDT is a cryptocurrency trading at $0.0835. Its target price is $0.1200, indicating a potential 50%+ gain. The pattern is a Bullish Falling Wedge, a reversal pattern signaling a trend change. This pattern suggests the downward trend may be ending. A breakout from the wedge could lead to a strong upward move. The Bullish Falling Wedge is a positive signal, indicating a potential price surge. Investors are optimistic about OGNUSDT's future performance. The current price may be a buying opportunity. Reaching the target price would result in significant returns. OGNUSDT is poised for a potential breakout and substantial gains.
PEPE Spot Long Trade Psychological trade
the market behavior and trader psychology that can drive price movements during breakout events. Traders often react to certain price levels, trends, and patterns in ways that influence decision-making and price action.
How to Manage Psychological Challenges in Breakout Trades:
Plan and Discipline: Having a clear plan helps avoid the emotional traps that can lead to rash decisions. This includes setting entry points, stop losses, and take profits ahead of time, so traders don’t rely on emotional reactions to price moves.
Risk Management: Proper position sizing, stop losses, and using a risk-reward ratio can help mitigate the psychological stress of a breakout trade. When risk is controlled, traders are less likely to panic during a false breakout or sudden market reversal.
Avoiding Overtrading: Traders who become overzealous or overly excited about breakouts can end up entering trades without proper confirmation or at bad risk-reward ratios. Sticking to a strategy and being selective with trades helps in avoiding emotional burnout.
Recognize False Breakouts:
False breakouts can be psychologically draining, especially when traders experience significant losses. Being able to step back, reassess, and avoid chasing every breakout can help reduce the psychological impact.

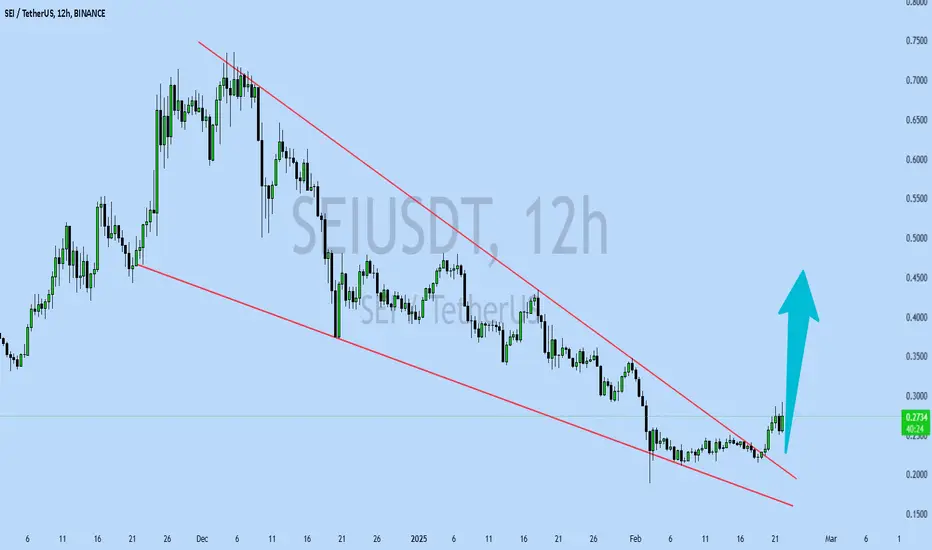
SEIUSDT UPDATESEIUSDT is a cryptocurrency trading at $0.2740. Its target price is $0.4500, indicating a potential 60%+ gain. The pattern is a Bullish Falling Wedge, a reversal pattern signaling a trend change. This pattern suggests the downward trend may be ending. A breakout from the wedge could lead to a strong upward move. The Bullish Falling Wedge is a positive signal, indicating a potential price surge. Investors are optimistic about SEIUSDT's future performance. The current price may be a buying opportunity. Reaching the target price would result in significant returns. SEIUSDT is poised for a potential breakout and substantial gains.
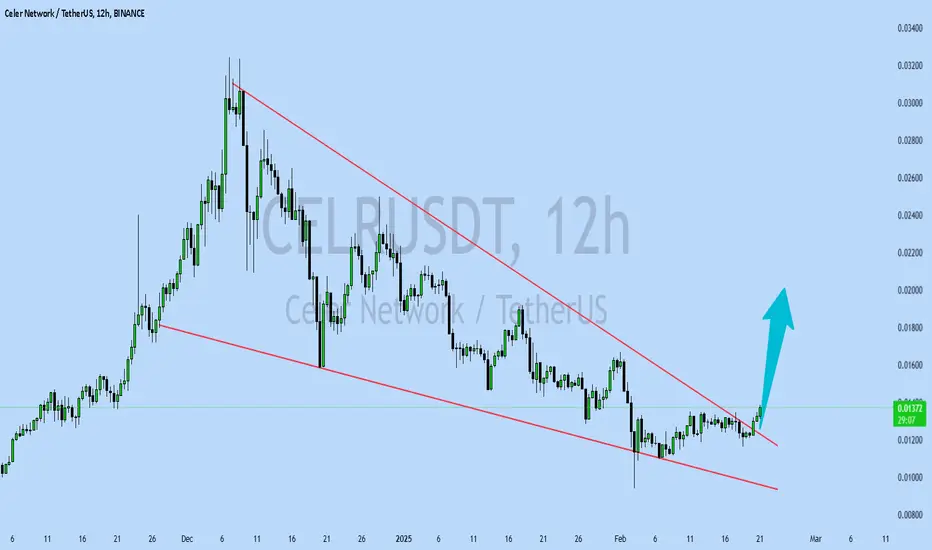
CELRUSDT UPDATECELRUSDT is a cryptocurrency trading at $0.01372. Its target price is $0.02000, indicating a potential 60%+ gain. The pattern is a Bullish Falling Wedge, a reversal pattern signaling a trend change. This pattern suggests the downward trend may be ending. A breakout from the wedge could lead to a strong upward move. The Bullish Falling Wedge is a positive signal, indicating a potential price surge. Investors are optimistic about CELRUSDT's future performance. The current price may be a buying opportunity. Reaching the target price would result in significant returns. CELRUSDT is poised for a potential breakout and substantial gains.