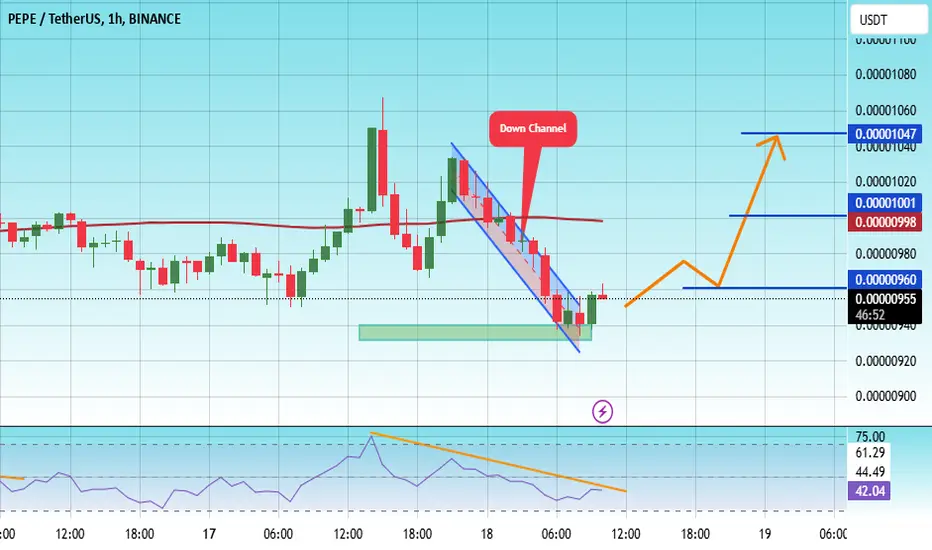
#PEPE/USDT#PEPE
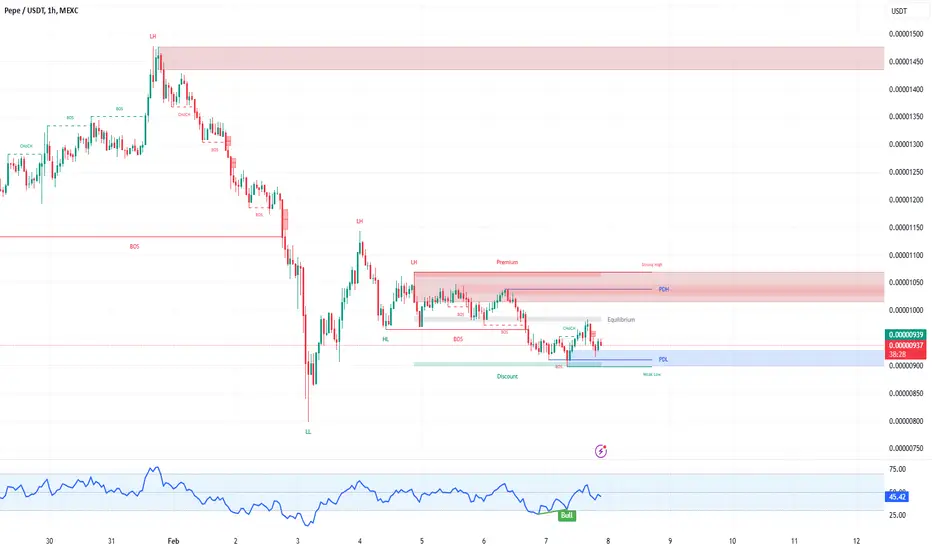
The price is moving in a descending channel on the 1-hour frame and is adhering to it well and is heading to break it strongly upwards and retest it
We have a bounce from the lower limit of the descending channel, this support is at a price of 0.00000935
We have a downtrend on the RSI indicator that is about to break and retest, which supports the rise
We have a trend to stabilize above the moving average 100
Entry price 0.00000950
First target 0.000000960
Second target 0.00001000
Third target 0.00001047
PEPEUSDT
PEPE/USDT 1H: Bearish Consolidation Reversal –Target 0.00000970PEPE/USDT 1H: Bearish Consolidation Reversal – Next Target 0.00000970?
🚀 Follow me on TradingView if you respect our charts! 📈 Daily updates!
Current Market Condition:
Price currently at 0.00000928 in a bearish consolidation following a significant drop.
RSI at 46, showing neutral momentum.
Hidden bullish divergence is forming on RSI while price makes lower lows.
Market Maker Activity:
Accumulation is evident in the 0.00000890-0.00000920 zone with multiple tests, indicating MM buildup before the next leg up.
Key Levels:
Support: 0.00000890
Resistance: 0.00000970
Current Price: 0.00000928
Trade Setup (Confidence 7/10):
Entry: Consider a long entry at 0.00000920 with tight stops.
Targets:
T1: 0.00000950
T2: 0.00000970
Stop Loss: Place at 0.00000885.
Risk Score:
6/10 – Favorable risk-to-reward, but waiting for confirmation above 0.00000940 may offer a safer entry.
Recommendation:
Long positions are recommended given the MM accumulation and hidden bullish divergence.
Monitor for confirmation above 0.00000940 before fully committing.
🚀 Follow me on TradingView if you respect our charts! 📈 Daily updates!

#PEPE Bulls Ready for a Momentum Shift? Key Levels to Monitor Yello Paradisers! Is #PEPE about to break out of this falling wedge, or will the bears drag it lower? Here's why the next move could be game-changing for #PEPEUSD:
💎#PEPEUSDT has been trapped inside a falling wedge formation, steadily rejecting off its descending resistance. This pattern is historically bullish, but a breakout confirmation is still needed. Currently, PEPE is hovering near a key support zone between $0.0000060 and $0.000012, where buyers have previously stepped in.
💎A bullish divergence is forming on the histogram, signaling a potential shift in momentum. But for bulls to take control, PEPE must break above the descending resistance and reclaim $0.0000152 as support. If this level is cleared, we could see an explosive rally toward $0.000030, where strong selling pressure is expected.
💎However, if #PEPE fails to hold the $0.0000060 - $0.000012 support range, the bullish setup could get invalidated. A breakdown below this zone would expose lower levels and increase downside risk, potentially leading to a deeper sell-off.
The next few weeks will be crucial—will the bulls step up, or will PEPE break below and give the bears full control? Be patient and trade smart, Paradisers!
MyCryptoParadise
iFeel the success🌴

WHAT DO YOU THINK!!!hello friends
As you can see, we had a heavy fall and it is expected that the price will move to the support area after the pattern breaks.
Otherwise, we will experience an upward movement until the specified resistance.
*Trade safely with us*

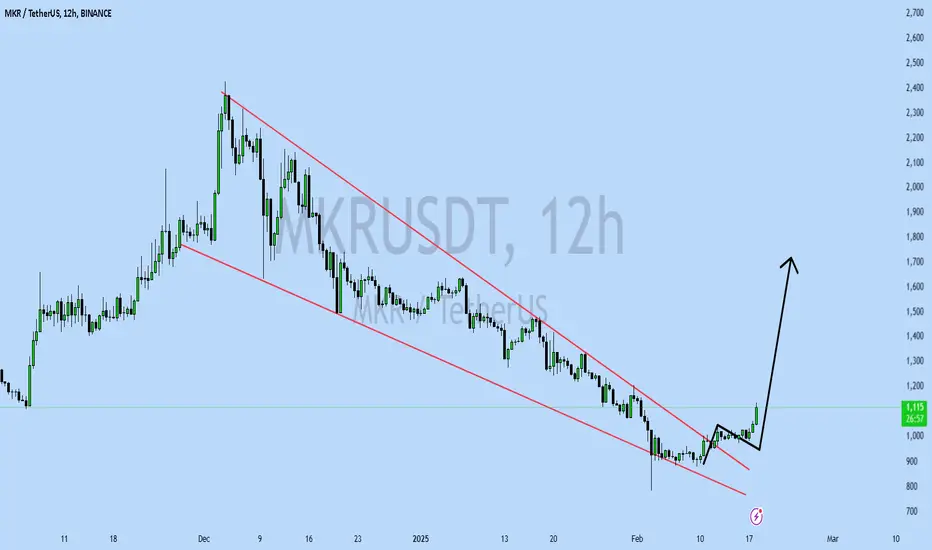
MKRUSDT UPDATEMKRUSDT is a cryptocurrency trading at $1,116. Its target price is $1,700, indicating a potential 55%+ gain. The pattern is a Bullish Falling Wedge, a reversal pattern signaling a trend change. This pattern suggests the downward trend may be ending. A breakout from the wedge could lead to a strong upward move. The Bullish Falling Wedge is a positive signal, indicating a potential price surge. Investors are optimistic about MKRUSDT's future performance. The current price may be a buying opportunity. Reaching the target price would result in significant returns. MKRUSDT is poised for a potential breakout and substantial gains.
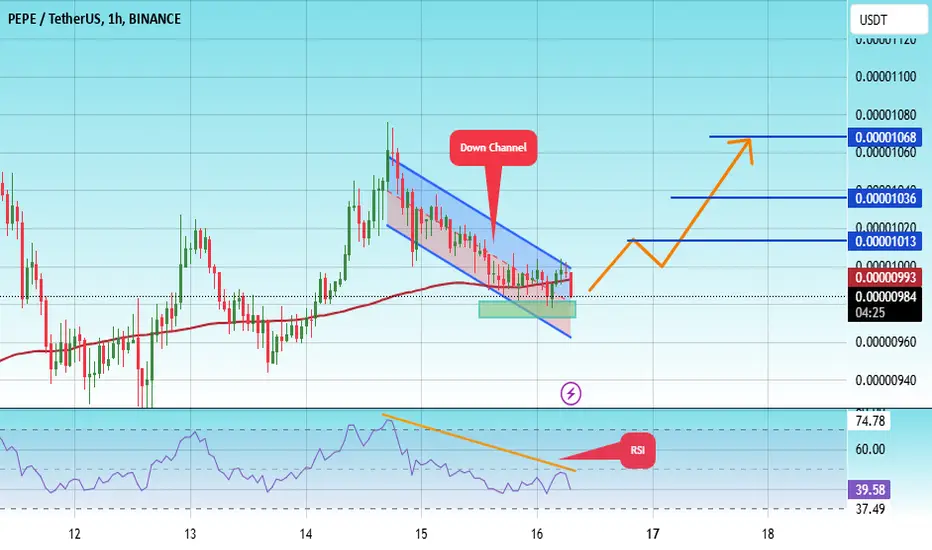
#PEPE/USDT#PEPE
The price is moving in a descending channel on the 1-hour frame and is adhering to it well and is heading to break it strongly upwards and retest it
We have a bounce from the lower limit of the descending channel, this support is at a price of 0.0.00000970
We have a downtrend on the RSI indicator that is about to break and retest, which supports the rise
We have a trend to stabilize above the moving average 100
Entry price 0.0.00000986
First target 0.000001013
Second target 0.00000103
Third target 0.000001068
$PEPE has reached its bottom and is ready to move upward.I like seeing these kinds of charts. It's rare to find such a perfect entry point with the potential for a 2x or more return.
CRYPTOCAP:PEPE is backed by Wintermute, the biggest market maker, meaning they have the power to push it to the moon. However, CRYPTOCAP:PEPE has gone through a long and necessary consolidation phase, which happens to every coin after a major rally.
All signs indicate that this consolidation is over and that CRYPTOCAP:PEPE is ready for the next pump:
MACD is at the bottom on both the daily and weekly charts. In fact, it has never been this oversold in its history.
RSI is also at the bottom, signaling that an upward move lasting several months could be coming.
In general, if CRYPTOCAP:PEPE is below 0.00001, it’s a good buy—hence why it’s in my green box.
CRYPTOCAP:PEPE has bounced off the long-term uptrend line, marking a clear bottom. It has now broken above 0.00001, confirming the trend reversal.
There might be some hesitation since bottoms can be shaky, but once the uptrend starts, you'll be glad you took this long position.
To manage risk, set a stop loss below 0.00000950, just in case CRYPTOCAP:BTC crashes for any reason.
DYOR (Do Your Own Research).

ELFUSDT UPDATEELFUSDT is a cryptocurrency trading at $0.3090. Its target price is $0.5000, indicating a potential 60%+ gain. The pattern is a Bullish Falling Wedge, a reversal pattern signaling a trend change. This pattern suggests the downward trend may be ending. A breakout from the wedge could lead to a strong upward move. The Bullish Falling Wedge is a positive signal, indicating a potential price surge. Investors are optimistic about ELFUSDT's future performance. The current price may be a buying opportunity. Reaching the target price would result in significant returns. ELFUSDT is poised for a potential breakout and substantial gains.

Pepe's analysis: buy again!!!hello friends
Considering the 70% drop, now the price has returned from a good support area, and by maintaining this rand, we will go for the specified goals, of course, with capital management...
Trade safely with us

"HIGH ALERT"#PEPE last chance before the GREAT FALLSIMO pepe will find support @ 1030-1079 area
this may be the last change for the bulls before expecting major top either the areas of
18-19
227-247
so trade carefully at the defined areas

PEPE/USDT 1H: Bullish Breakout in Play – Can $0.00001200 READY!PEPE/USDT 1H: Bullish Breakout in Play – Can $0.00001200 Be Reached?
🚀 Follow me on TradingView if you respect our charts! 📈 Daily updates!
Current Market Structure:
Bullish breakout confirmed, price breaking above $0.00001060 resistance with strong momentum.
RSI at 75.21, indicating bullish strength, but still below extreme overbought conditions.
Pattern: Ascending triangle breakout, signaling trend continuation.
Key Levels:
Support: $0.00000950 (previous accumulation zone).
Resistance: $0.00001200 (next major target).
Current Price: $0.00001064.
Trade Setup (Confidence 8/10):
Entry Zone: Current price ($0.00001064) or pullback to $0.00001020 for better positioning.
Targets:
T1: $0.00001150 (initial resistance).
T2: $0.00001200 (major liquidity zone).
Stop Loss: Below $0.00000920 (below previous accumulation zone).
Risk Score:
7/10 – Favorable R:R setup, but RSI suggests watching for pullbacks.
Market Maker Analysis:
Accumulation phase complete, now transitioning into markup.
Breakout above previous range confirms institutional positioning.
Hidden bullish divergence on RSI, reinforcing trend strength.
Recommendation:
Long positions remain favorable at $0.00001064 or pullback to $0.00001020.
Tight stops below $0.00000920 to protect against invalidation.
Watch for rejection at $0.00001150 before confirming move to $0.00001200.
Confidence Level:
8/10 – Strong breakout structure, Smart Money accumulation confirmed.
🚀 Follow me on TradingView if you respect our charts! 📈 Daily updates!

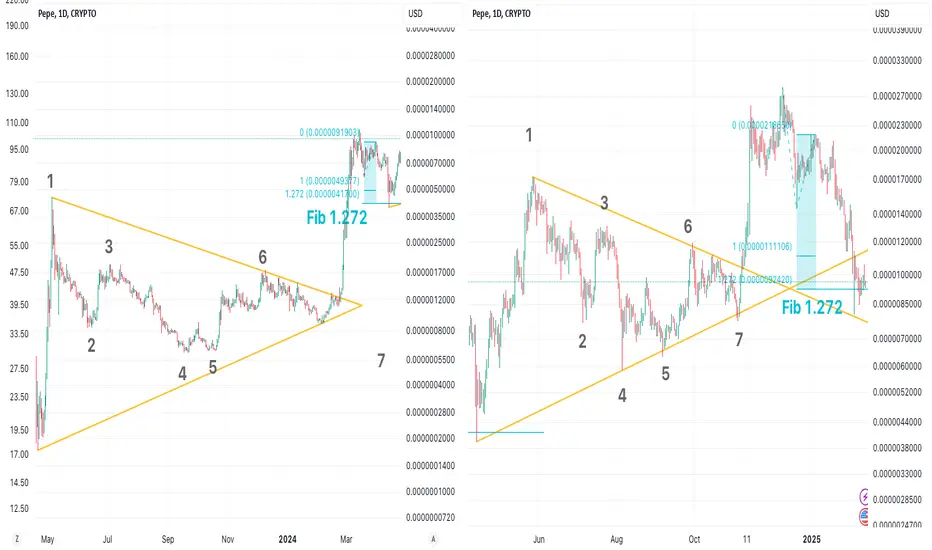
Will PEPE Pump or Dump Next?PEPE is mirroring its pre-pump structure from last year:
1️⃣ Both times, it spent months forming a large symmetrical triangle.
2️⃣ It followed the exact same 1-7 point structure.
3️⃣ After breaking out, both saw a major pullback.
4️⃣ The drop went below the Fibonacci 1.272 retracement level.
The recent crash perfectly touched the triangle’s upper boundary (descending trendline).
Now, we’re watching to see if the 1.272 level holds.
A retest of the descending trendline is possible, shaking out weak hands and cleaning up liquidity.
If BINANCE:PEPEUSDT bounces off the descending trendline, it could be a solid entry point.
But as always, set a stop-loss in case the drop continues.
If history repeats, the last cycle saw about a 3x pump—that’s the visible potential upside.
Honestly, in crypto, a 3x isn’t eye-catching.
But considering PEPE is one of the few meme coins that reached mainstream attention, its liquidity-grabbing power in an altcoin bull run could be massive.
🔴 for more future script "guesses" like this!
🔥 I've dropped another 2 analyses for the 2025 altseason on the right hand side if you're using computer, and scroll down a bit to see the link if you're using mobile.
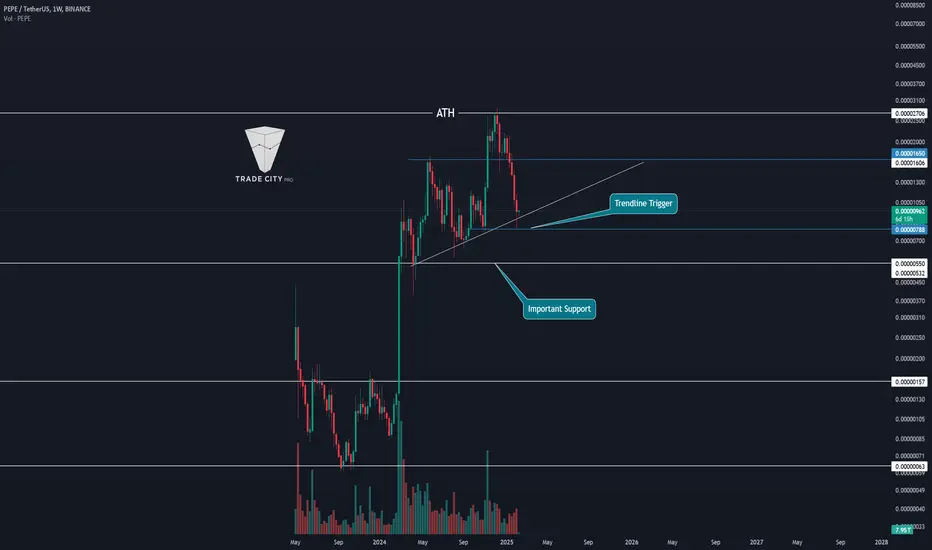
TradeCityPro | PEPE: Critical Support & Trend Reversal Triggers👋 Welcome to TradeCity Pro!
In this analysis, I will examine the PEPE coin. This coin is one of the well-known meme coins in the market and currently holds the 30th rank on CoinMarketCap with a market cap of $4 billion.
📅 Weekly Timeframe
In the weekly timeframe, like other meme coins, PEPE initially experienced a massive pump, starting from $0.00000063 and surging 2,800% to reach $0.00001650.
🔍 In the next bullish leg, the price movement was not as large. After breaking $0.00001650, it established a new ATH at $0.00002706. A rising trendline has also formed from the $0.0000055 low, which has been tested multiple times during corrections.
📊 The candlestick volume has been declining since the first bullish leg ended, but in recent bearish candles, it has started increasing again. This suggests a divergence between price and volume, indicating that if short triggers activate, a trend reversal could be possible.
✨ The first trend reversal trigger is the trendline break, which will be confirmed upon the break of $0.00000788—marking the first sign of a trend shift. Additionally, the primary support lies at $0.0000055, a critical level. If this support is broken, deeper corrections or even a full trend reversal may follow.
🔼 On the other hand, if the price remains above the trendline and establishes a higher low, this would be very beneficial for future price action, potentially leading to a move toward the $0.00001650 and $0.00002706 resistances.
📅 Daily Timeframe
In this timeframe, we can analyze the latest bullish and bearish legs in more detail. As observed, the price has fully retraced its previous bullish move, dropping to the $0.00000788 support.
💫 After reaching the $0.00002651 resistance, the price corrected to $0.00001684. However, the next bullish leg was weak, with low volume and no momentum. Upon breaking $0.00001684, the price started declining, currently correcting toward the weekly trendline with a wick down to $0.00000788.
💥 The RSI oscillator is in a very interesting zone—if it enters the Oversold region, it could trigger another bearish wave. Meanwhile, candle volume has been dominated by sellers since the break of $0.00001684.
✔️ At this point, no solid long setup has formed in this timeframe. A better approach would be to switch to the 4-hour timeframe to identify potential futures trading triggers.
⌛️ 4-Hour Timeframe
Now, let’s move to the 4-hour timeframe to pinpoint futures trading triggers.
🔽 As mentioned in the daily timeframe, momentum is currently in favor of sellers. Therefore, breaking the $0.00000894 support would be an excellent short entry, potentially triggering the next bearish leg.
📈 For a long position, the first trigger is the break of $0.00000977—a risky setup, so it’s crucial to enter with minimal risk. The next long entry would be above $0.00001106, while the main confirmation of a trend reversal will come if $0.00001464 breaks.However, if after breaking $0.00001106, the price forms a higher low and higher high, it could confirm the trend change earlier.
📝 Final Thoughts
This analysis reflects our opinions and is not financial advice.
Share your thoughts in the comments, and don’t forget to share this analysis with your friends! ❤️
PEPE 10x imminentPay your attention to PEPE. This is an underestimated project that will easily show 10x on the current market. From a technical point of view the asset is very oversold, we should wait for a strong push up. Wintermute made their asset 2 times cheaper and finished accumulation. Growth start next week.
PEPE Deep dive before pumping? To what price?CRYPTOCAP:PEPE Script: A potential deep dive might be on the horizon before the next pump.
Right now, it’s forming a structure that looks a lot like the pattern we saw from March to May, which I’ve marked as points 1 to 7.
Both of these structures showed up after breaking out from the near-end of a symmetrical triangle.
Currently, we’re sitting at point 6.
Using Fibonacci retracement, we can estimate how deep the dip might go.
Last time, it reached Fib 1.618. If history repeats itself, PEPE could pull back to around 0.00009485.
This potential drawback would also break the uptrend line, which could shake market confidence and flush out weaker hands—perfect for accumulating liquidity to fuel a future price surge.
I’ve already set a buy order at this level, just in case this scenario plays out.
Of course, this is just one potential script among many. I’ll share more as they unfold.
Follow me for more insights and updates! 😊

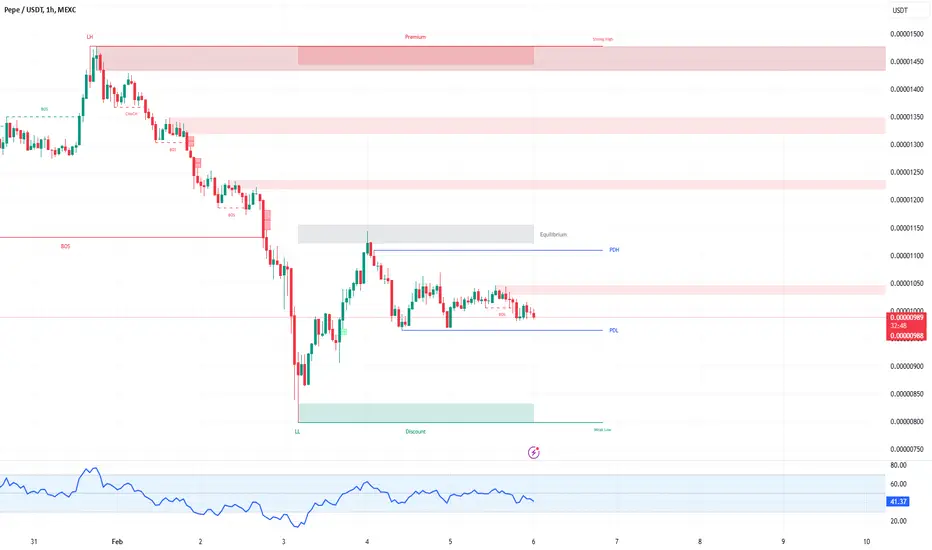
PEPE/USDT 1H: Accumulation Underway – Breakout to 0.00001050?PEPE/USDT 1H: Analysis
🚀 Follow me on TradingView if you respect our charts! 📈 Daily updates!
Current Market Condition:
Price at 0.00000943, consolidating within the Fair Value Gap (FVG).
RSI at 44.83, indicating neutral momentum with bullish divergence forming.
Trading in the equilibrium zone, positioned between the premium and discount areas.
Smart Money Analysis:
Market Makers are likely creating liquidity at 0.00001050 (premium zone).
Weak lows suggest accumulation phase before a potential bullish breakout.
Trade Setup:
Entry Zone: 0.00000943 - 0.00000950.
Targets:
T1: 0.00001000 (equilibrium zone).
T2: 0.00001050 (premium zone).
Stop Loss: Below 0.00000900 (discount zone invalidation).
Risk Score:
7/10 – Favorable R:R, but requires confirmation of momentum shift.
Market Maker Intent:
Hidden bullish divergence present on RSI—higher lows forming while price makes lower lows.
Market Makers likely accumulating before pushing price to the premium zone.
Wait for confirmation above 0.00000950 for a higher probability setup.
Recommendation:
Long entries are favorable within the 0.00000943-0.00000950 range.
Volume confirmation above 0.00000950 will strengthen bullish momentum.
Maintain a tight stop-loss at 0.00000900 to minimize downside risk.
Confidence Level:
7/10 – Bullish signs forming, but confirmation is essential before full commitment.
🚀 Follow me on TradingView if you respect our charts! 📈 Daily updates!
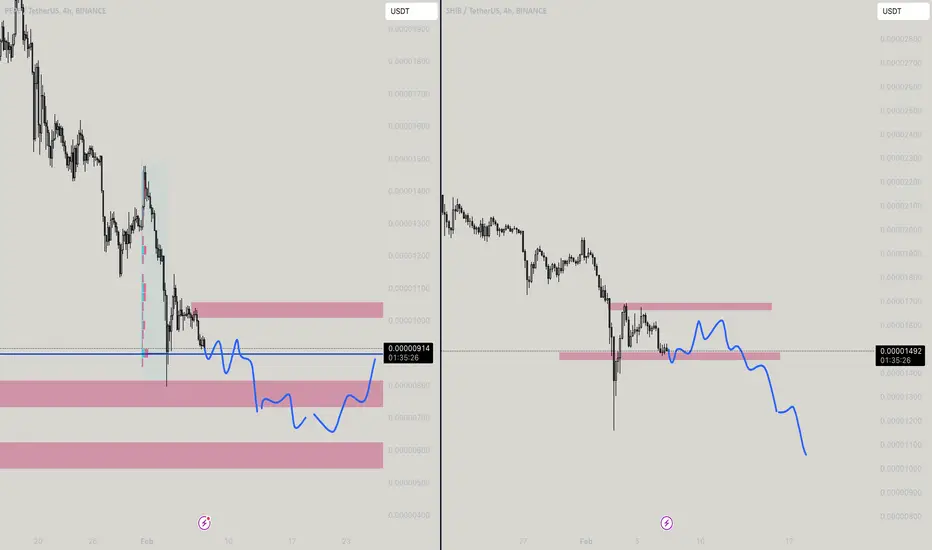
SHIB vs PEPE! Who will fall first?Pretty Obvious for me they both look weak as a stick to me. Nothing much to explain when overall stances are negative for me! Plan your trades accordingly
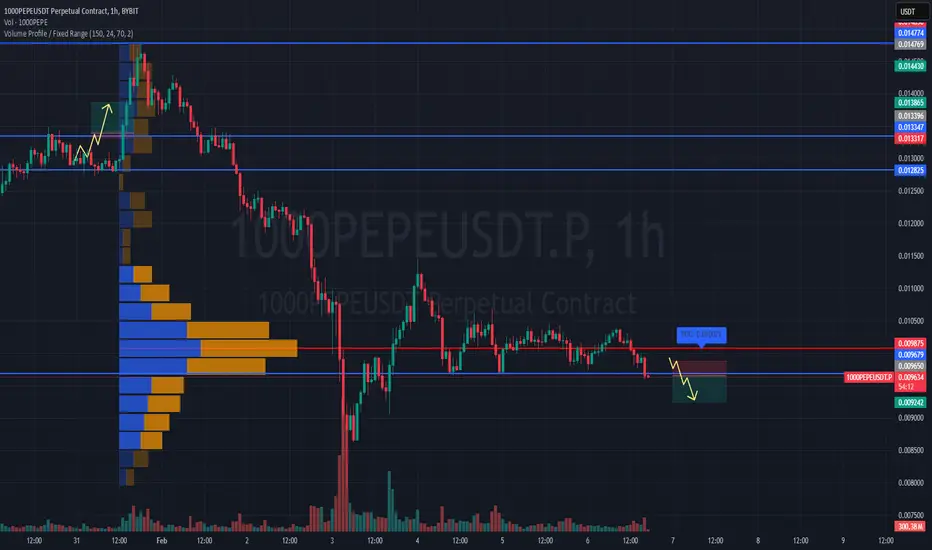
#1000PEPEUSDT expecting further decline!📉 SHORT BYBIT:1000PEPEUSDT.P from $0.009650
🛡 Stop Loss: $0.009875
⏱ 1H Timeframe
📍 Overview :
➡️ BYBIT:1000PEPEUSDT.P remains under selling pressure after failing to sustain an upward move. The price is trading below the key POC $0.010072 , which previously served as a high-liquidity zone.
➡️ The recent breakdown of $0.009815 , followed by a retest as resistance, confirms the bearish scenario.
➡️ If the asset holds below $0.009650 , this could trigger a move toward $0.009242, where buying interest was previously observed.
➡️ Current price action shows weakness in buyers as volume does not support an upward breakout.
⚡ Plan :
➡️ Enter short once a firm breakdown below $0.009650 is confirmed.
➡️ Risk management through Stop-Loss at $0.009875 , positioned above the nearest resistance zone.
➡️ The main downside target is $0.009242 , where profit-taking and a possible bounce could occur.
🎯 TP Targets:
💎 TP 1: $0.009242
📢 BYBIT:1000PEPEUSDT.P is showing signs of further downside, with no strong buying reaction at the moment.
📢 The $0.009242 level should be closely monitored as a potential support zone. If weakness persists, breaking this level could accelerate downward pressure.
📢 For those holding long positions, caution is advised when facing repeated resistance retests.
🚀 BYBIT:1000PEPEUSDT.P continues to show weakness — expecting further decline!
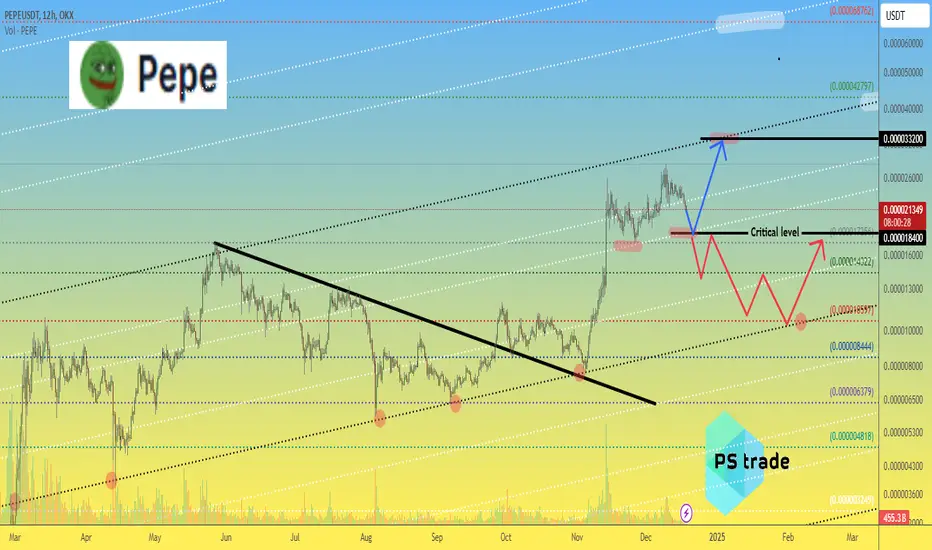
PEPE price trading plan🐸 The OKX:PEPEUSDT price is moving quite nicely between the dynamic fib levels on the chart.
But given that in a few hours there will be an announcement of a “fresh” Fed rate (forecast of a decrease of -0.25%), the crypto market may be volatile!)
Therefore, we highlight the critical level of $0.0000184 for the CRYPTOCAP:PEPE price, from where:
🐳 if the price is kept above - growth according to the blue scenario, at least to $0.0000332
💔 in case of failure and breakdown, a protracted corrective red scenario will be activated, somewhere to around $0.0000106
What do you prefer?)
PEPEUSD Long Position from Fresh Supply-Demand ZoneLooking to capitalize on a high-probability long setup in PEPEUSD? This trade idea is based on leveraging a fresh supply-demand zone to identify optimal entry, stop-loss, and target levels.
Trade Setup:
✅ Entry: Positioned within a newly formed demand zone, ensuring strong buying interest.
✅ Stop-Loss: Placed below the zone to minimize risk and protect capital.
✅ Target Levels: Aiming for key resistance or liquidity pools for maximum R:R.
Why This Trade?
📈 Fresh Demand Zone – Indicates institutional interest & potential reversal.
📊 Technical Confluence – Aligned with trend structure, Fibonacci retracements, and order flow analysis.
📉 Risk Management – Well-defined SL & TP to maintain optimal risk-to-reward.
🔍 Stay updated on PEPE price action, liquidity grabs, and confirmations before execution. Trade smart and follow risk management principles!
#PEPE #CryptoTrading #SmartMoney #Forex #TechnicalAnalysis
PEPE/USDT 1H: Distribution Pattern Signals Further Downside?!PEPE/USDT 1H: Analysis
🚀 Follow me on TradingView if you respect our charts! 📈 Daily updates!
Current Market Structure:
Price at $0.00000986, continuing within a bearish structure of lower highs and lower lows.
RSI at 40.34, indicating neutral to bearish momentum with no oversold conditions yet.
Smart Money Concepts:
Distribution phase is evident, with declining volumes reinforcing bearish continuation.
Hidden bearish divergence on RSI further supports downside bias.
Accumulation likely around $0.00000900 as Smart Money targets lower liquidity levels.
Key Levels:
Resistance: $0.00001050 (previous support turned resistance).
Support: $0.00000950 (next key level).
Stop Loss: Above $0.00001100 (recent swing high).
Targets:
T1: $0.00000900 (short-term target).
T2: $0.00000850 (extended target).
Risk Score:
7/10 – High-risk environment due to bearish continuation, but clear levels for invalidation.
Market Maker Intent:
Smart Money appears to be offloading positions, as distribution patterns emerge.
Liquidity below $0.00000950 and $0.00000900 could act as magnet levels for the next move.
Recommendation:
Short entry favorable at the current price of $0.00000986.
Maintain stops above $0.00001100 to limit losses in case of invalidation.
Monitor for a break below $0.00000950 for confirmation of extended downside.
Confidence Level:
7/10 – Bearish continuation supported by technical and volume analysis.
🚀 Follow me on TradingView if you respect our charts! 📈 Daily updates!
BTCUSDT H4 :UPDATE ROADMAPHi Guys,
If you Follow me ,This is my new analysis for bitcoin in mid-term.
Don't Forget we ha a GAP in 102000$ and Of course in 77000$.
SecondChanceCrypto
⏰ 3/FEB/25
⛔️DYOR
Always do your research.
If you have any questions, you can write them in the comments below and I will answer them.
And please don't forget to support this idea with your likes and comments.

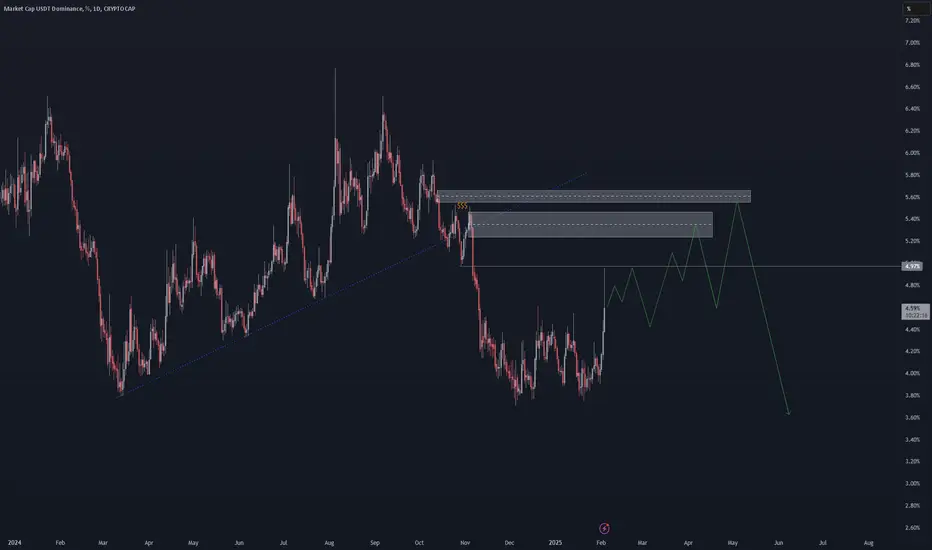
USDT.D: Roadmap for Crypto MarketHi Guys,
As I have mentioned many times, the crypto market is no longer in a bear market. One of the best indicators for analyzing this market is Tether dominance. According to the chart analysis, I can imagine lower prices for Bitcoin, maybe we will have a look at the $75,000 range in Bitcoin, and continue to follow my analysis of Bitcoin.
SecondChanceCrypto
⏰ 3/FEB/25
⛔️DYOR
Always do your research.
If you have any questions, you can write them in the comments below and I will answer them.
And please don't forget to support this idea with your likes and comments.