Can Innovation Survive Manufacturing Chaos?Regeneron Pharmaceuticals stands at a fascinating crossroads, embodying the paradox of modern biotechnology: extraordinary scientific achievement shadowed by operational vulnerability. The company has successfully transformed from a blockbuster-dependent enterprise into a diversified biopharmaceutical powerhouse, driven by two key engines. Dupixent continues its remarkable ascent, achieving 22% growth and reaching $4.34 billion in Q2 2025. Meanwhile, the strategic transition from legacy Eylea to the superior Eylea HD demonstrates forward-thinking market positioning, despite apparent revenue declines.
The company's innovation engine supports its aggressive R&D strategy, investing 36.1% of revenue, nearly double the industry average, into discovery and development. This approach has yielded tangible results, with Lynozyfic's FDA approval marking Regeneron's first breakthrough in blood cancer, achieving a competitive 70% response rate in multiple myeloma. The proprietary VelociSuite technology platform, particularly VelocImmune and Veloci-Bi, creates a sustainable competitive moat that competitors cannot easily replicate, enabling the consistent generation of fully human antibodies and differentiated bispecific therapies.
However, Regeneron's scientific triumphs are increasingly threatened by third-party manufacturing dependencies that have created critical vulnerabilities. The FDA's second rejection of odronextamab, despite strong European approval and compelling clinical data, is due to manufacturing issues at an external facility, rather than scientific deficiencies. This same third-party bottleneck has delayed crucial Eylea HD enhancements, potentially allowing competitors to gain market share during a pivotal transition period.
The broader strategic landscape presents both opportunities and risks that extend beyond manufacturing concerns. Although the company's strong victories in intellectual property cases against Amgen and Samsung Bioepis showcase effective legal defenses, the proposed 200% drug tariffs and industry-wide cybersecurity breaches, such as the Cencora incident impacting 27 pharmaceutical companies, highlight significant systemic vulnerabilities. Regeneron's fundamental strengths-its technological platforms, diverse pipeline spanning oncology to rare diseases, and proven ability to commercialize breakthrough therapies-position it for long-term success, provided it can resolve the operational dependencies that threaten to derail its scientific achievements.
Pharmaceuticals

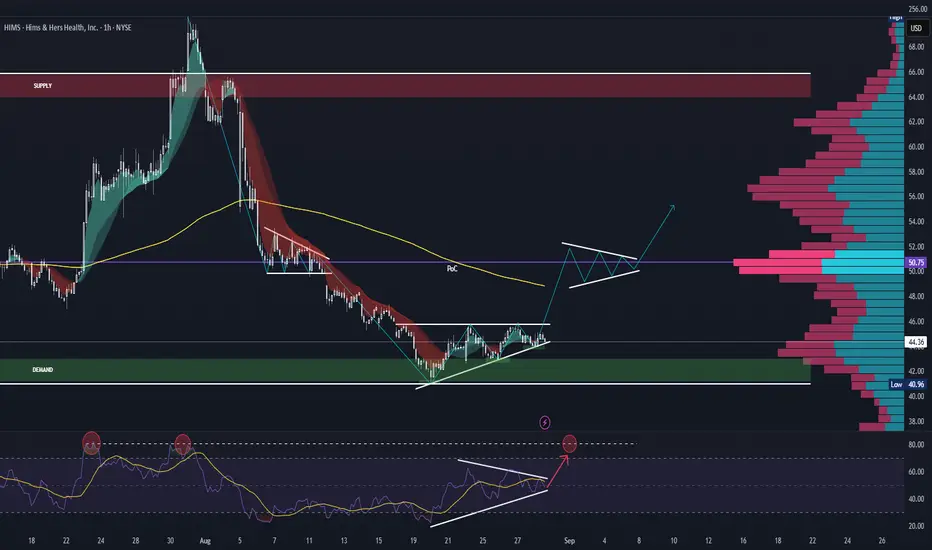
HIMS THROUGH LABOR DAYThis is my speculative technical analysis of what I believe could unravel with $HIMS.
$45.00 has been crossed twice, and I believe this is where the line on the sand is drawn. A Strong close above this mark and we could see $47.40, $48.94, and then a gap fill to $50.00 which is a big psychological level.
An area where I would expect some price consolidation before picking direction once again.
Zydus Lifesciences: Premium Valuation, Solid OutlookZydus Lifesciences Ltd. (NSE: ZYDUSLIFE), one of India’s most respected pharmaceutical giants, is at a crucial juncture where technical breakout signals align with solid fundamental strength. Let’s dive deeper into its techno-fundamental outlook.
🔹 Fundamental Snapshot
CMP (25 Aug 2025): ₹1,023
Market Cap: ~₹1 lakh crore
P/E Ratio: ~22.4 (slightly above historical average of ~21.6)
P/B Ratio: ~4.2–4.7
Dividend Yield: ~1.1%
ROE / ROCE: 21.2% / 24.3%
Debt-to-Equity: 0.13 (low leverage)
Current Ratio: 1.9 (healthy liquidity)
EPS (TTM): ~₹45.4
Growth Metrics:
Revenue CAGR (5Y): ~10%
Profit CAGR (5Y): ~26%
Profit CAGR (3Y): ~2% (showing a slowdown recently)
Valuation Insight:
Intrinsic value estimates range from ₹748–₹814, implying the stock trades 25–27% above fair value.
👉 Fundamentally, Zydus is financially strong and consistently profitable, but valuation is on the premium side.
🔹 Technical Analysis
The daily chart (shown above) highlights a large Inverse Head & Shoulders (H&S) formation, typically a bullish reversal pattern.
Left Shoulder: Nov 2024
Head: Apr 2025 (major bottom around ₹800.5)
Right Shoulder: Aug 2025
Neckline Breakout: Around ₹1,000–1,010
Key Levels
Reversal Zone (Support): ₹977–₹993
Immediate Resistance (R1): ₹1,100
Next Resistance (R2): ₹1,150
Major Resistance (R3): ₹1,240
📈 Technical Outlook:
The breakout above the neckline suggests momentum towards ₹1,100–₹1,150 in the short term, with the potential to test ₹1,240 in the medium term if volumes support it.
🔹 Techno-Fundamental View
Valuation: Trading at a premium, about 25% above intrinsic value, though supported by a strong balance sheet and product pipeline.
Profitability: ROE and ROCE remain strong, both above 20%.
Balance Sheet: Very low debt and solid liquidity provide financial strength.
Growth: Long-term CAGR is healthy, but recent three-year profit growth has slowed.
Technical Setup: Inverse Head & Shoulders breakout signals bullish momentum.
Upside Targets: ₹1,100 → ₹1,150 → ₹1,240.
Risk Zone: A breakdown below ₹977 would invalidate the bullish pattern.
🔹 Conclusion
Zydus Lifesciences presents a compelling techno-fundamental story:
Fundamentally strong with robust financial ratios, prudent balance sheet, and a global growth strategy.
Technically bullish, as the inverse Head & Shoulders suggests a strong reversal with clear upside targets.
However, with the stock trading above intrinsic value estimates, new investors should approach with caution—preferably on dips near the ₹977–₹993 support zone. For existing investors, this breakout could unlock the next leg towards ₹1,150–₹1,240.

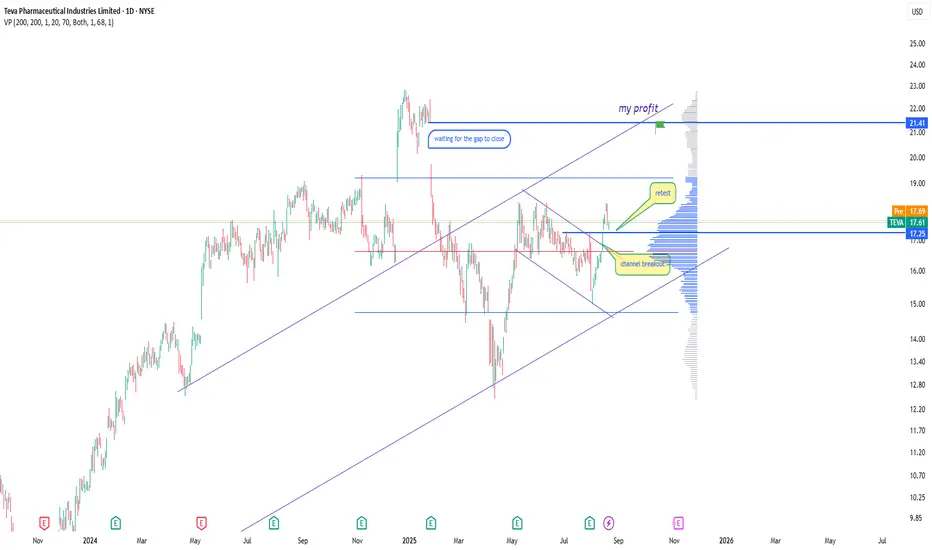
Teva long positionTeva looks like a student who failed an exam and now desperately tries to cover the gaps literally, the gap around 21.4.
On the chart we see a clear breakout of the descending channel followed by a neat retest from above, suggesting the stock is ready to get back into a long-term uptrend.
Volumes in the 17–17.5 zone act like a safety cushion, preventing the price from dropping too sharply.
Technically the next target is gap closure in the 21–22 area, which may unlock the path to higher levels.
From the fundamental side, Teva also has some cards to play: the pharmaceutical sector remains in focus due to rising demand for medicines and biotech solutions, and the company has been cleaning up its balance sheet while expanding new business lines. Altogether, both technicals and fundamentals point in the same direction , buyers are not ready to give up just yet.
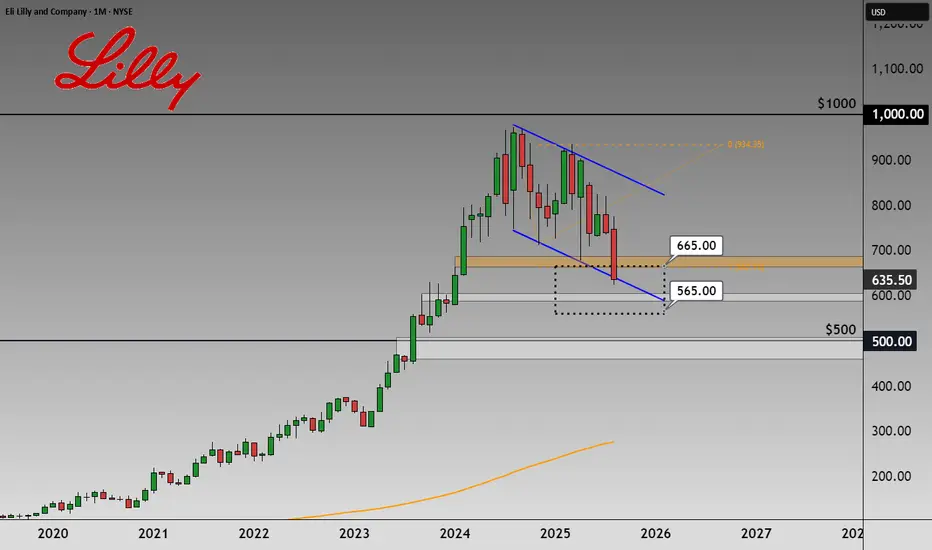
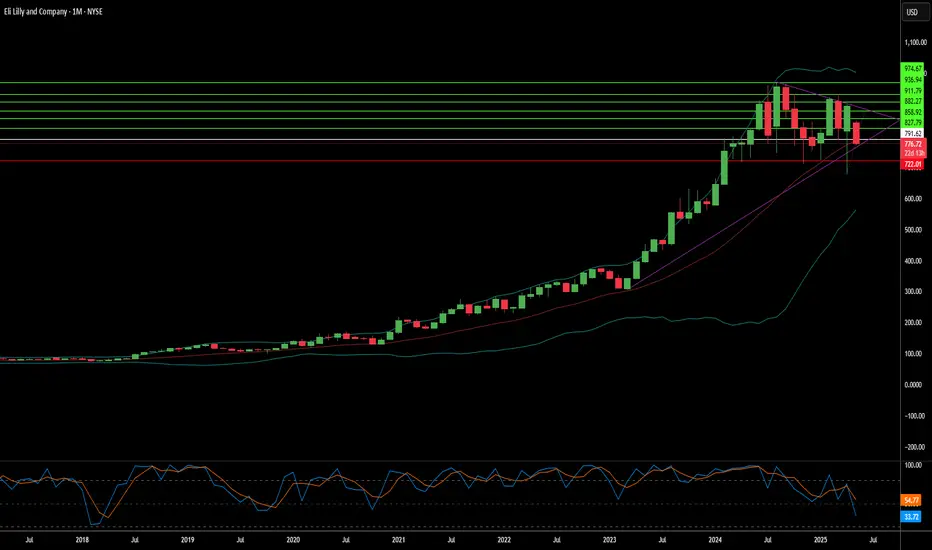
Eli Lilly (LLY) – Pharma Giant at a Key Price LevelHi,
Eli Lilly & Co. is one of the world’s largest pharmaceutical companies, founded in 1876 and headquartered in Indianapolis. It operates in over 125 countries and is best known for blockbuster treatments in diabetes, obesity, oncology, and immunology. Recent growth has been driven largely by its GLP-1 class drugs Mounjaro and Zepbound, which have quickly become industry leaders in the weight-loss and diabetes markets.
Recent Fundamentals (Q2 2025)
Revenue: $15.56 B (+38% YoY)
- EPS: $6.31 (beat expectations)
- Mounjaro sales: $5.2 B
- Zepbound sales: $3.38 B
- Full-year guidance: Revenue $60–62 B, EPS $21.75–$23.00
- Margins: Gross margin ~82.6%, net margin ~25.9%
- Profitability: ROE ~75.5%, ROIC ~29.6%
While fundamentals remain strong, the recent Phase III data for the oral weight-loss pill orforglipron came in below expectations, sparking a ~14% drop, the stock’s steepest one-day decline in decades. Analysts have since trimmed long-term sales forecasts for this product.
From a valuation perspective, the stock trades at a premium (~41× P/E, ~10.7× P/S), leaving little room for major disappointments.
Technicals
Technically speaking, the price has arrived in the zone where I’ve been patiently waiting to share it as an idea. This is a good area from where to start building positions if you’re interested.
There are quite a few technical confluence factors aligning here, but be ready to grab it also around $500 if the market offers it. Let that be your guide:
- If you’re not willing to hold long-term, don’t touch it.
- If you’re not willing to buy more at lower prices, don’t touch it.
Good luck,
Vaido
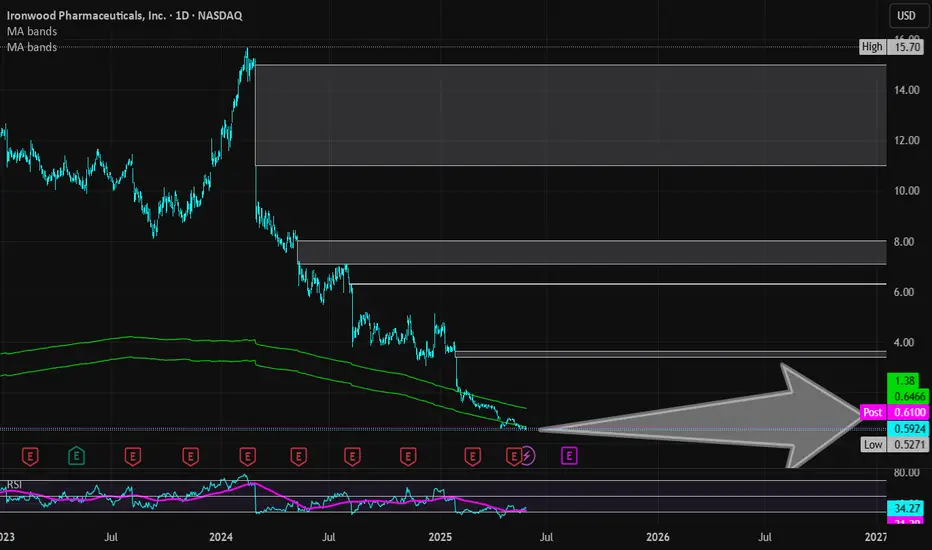
Ironwood Pharmaceuticals | IRWD | Long at $0.61Ironwood Pharma NASDAQ:IRWD stock dropped ~89% in the past year due to disappointing Phase 3 Apraglutide trial results, FDA requiring an additional trial, weak Q1 2025 earnings (-$0.14 EPS vs. -$0.04 expected), high debt ($599.48M), and analyst downgrades. So why would I be interested in swing trading this company? The chart. The price has entered my "crash" simple moving average zone, which often results in a reversal - even if temporary. Also, Linzess (GI drug) revenue is steady, and I thoroughly believe that alone pushes the fair value near $0.95, if not higher. Thus, at $0.61, NASDAQ:IRWD is in a personal buy zone with the potential for additional declines before future rise.
Target:
$0.95 (+55.7%)
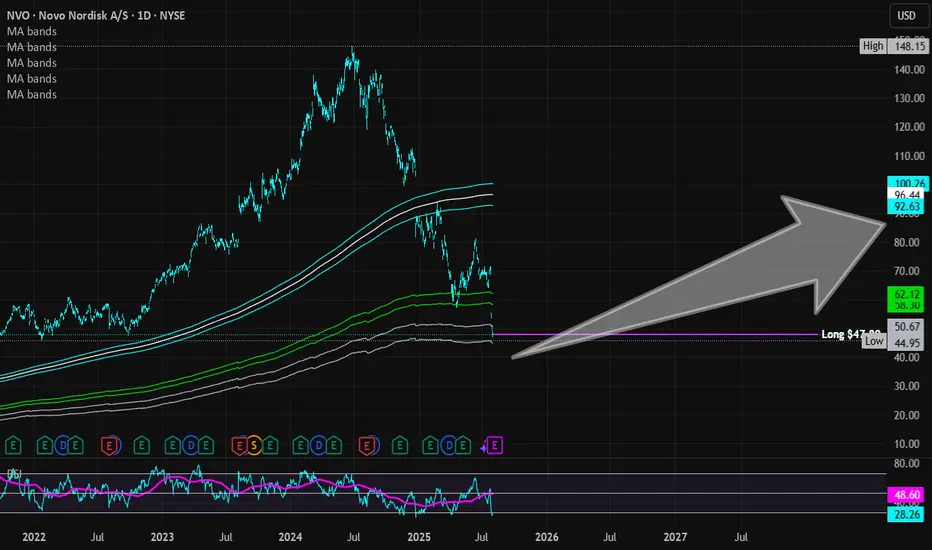
Novo Nordisk (Revised) | NVO | Long at $47.78**This is a revised analysis from February 5, 2025: I am still in that position, but added significantly more below $50**
Novo Nordisk NYSE:NVO is now trading at valuations before its release of Wegovy and Ozempic... From a technical analysis perspective, it's within my "major crash" simple moving average zone (gray lines). When a company's stock price enters this region (especially large and healthy companies) I always grab shares - either for a temporary future bounce or a long-term hold. While currently trading near $47 a share, I think worst case scenario here in 2025 is near $38-$39. Tariffs may cause a recession in the second half of 2025, so no company would be immune.
As mentioned above, I am still a holder at $86.74. However, I went in much heavier within my "major crash" simple moving average band and have a final entry planned near $38-$38 (if it drops there). My current cost average is near $55.00.
Why do I still have faith in NYSE:NVO ? Because no one else does right now, yet it generated $42 billion in revenue, $14 billion in profits, and has significant cash flow YoY. The company has a massive pipeline, despite Wegovy and Ozempic competition, and I think the market is undervaluing its position in the pharmaceutical industry.
Revised Targets in 2028:
$60.00 (+25.6%)
$70.00 (+46.5%)
$80.00 (+67.4%)
KALV FDA approval rallyKALV received FDA approval this week for a new drug, has $220mln in cash, and just bounced off the daily 21EMA (overlayed on this 4H chart).
Recently rejected off the monthly 100ema two times (overlayed on this 4H chart). Breakout beyond the monthly 100ema and first target is $20. Numerous price target increases, most notably, one at $27 and another increased from $32 to $40.

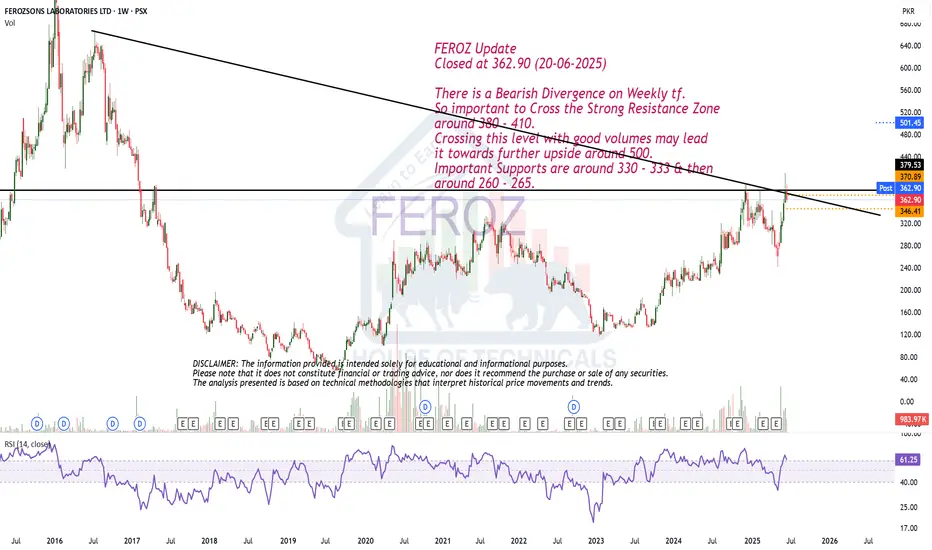
Bearish Divergence on Weekly tf.FEROZ Update
Closed at 362.90 (20-06-2025)
There is a Bearish Divergence on Weekly tf.
So important to Cross the Strong Resistance Zone
around 380 - 410.
Crossing this level with good volumes may lead
it towards further upside around 500.
Important Supports are around 330 - 333 & then
around 260 - 265.
Potential outside week and bearish potential for TLXEntry conditions:
(i) lower share price for ASX:TLX below the level of the potential outside week noted on 2nd June (i.e.: below the level of $24.91).
Stop loss for the trade would be:
(i) above the high of the outside week on 5th June (i.e.: above $27.40), should the trade activate.
Important note for the trade:
- Observe market reaction at two key areas illustrated in the chart above, should the trade activate ($24.79 and $24.47), which could act as support against the short trade.

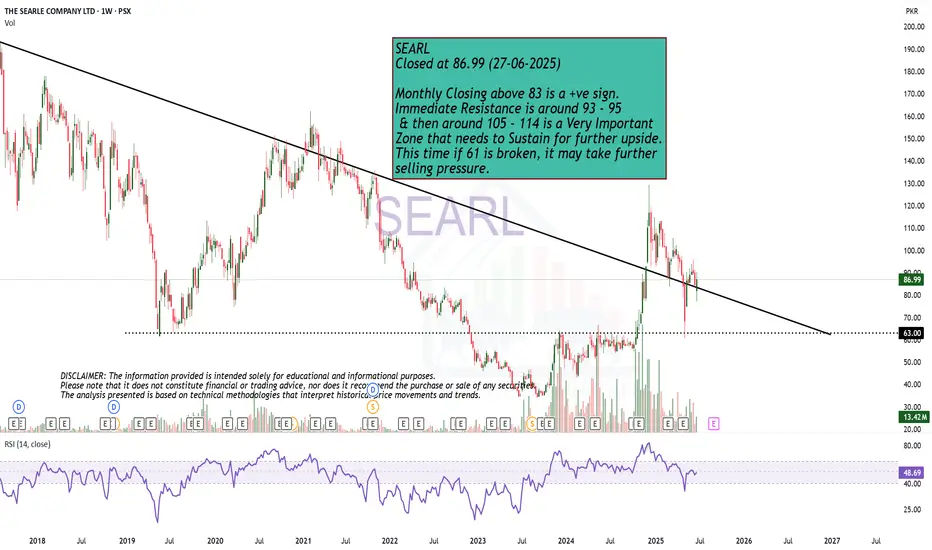
Play on LevelsSEARL
Closed at 86.99 (27-06-2025)
Monthly Closing above 83 is a +ve sign.
Immediate Resistance is around 93 - 95
& then around 105 - 114 is a Very Important
Zone that needs to Sustain for further upside.
This time if 61 is broken, it may take further
selling pressure.
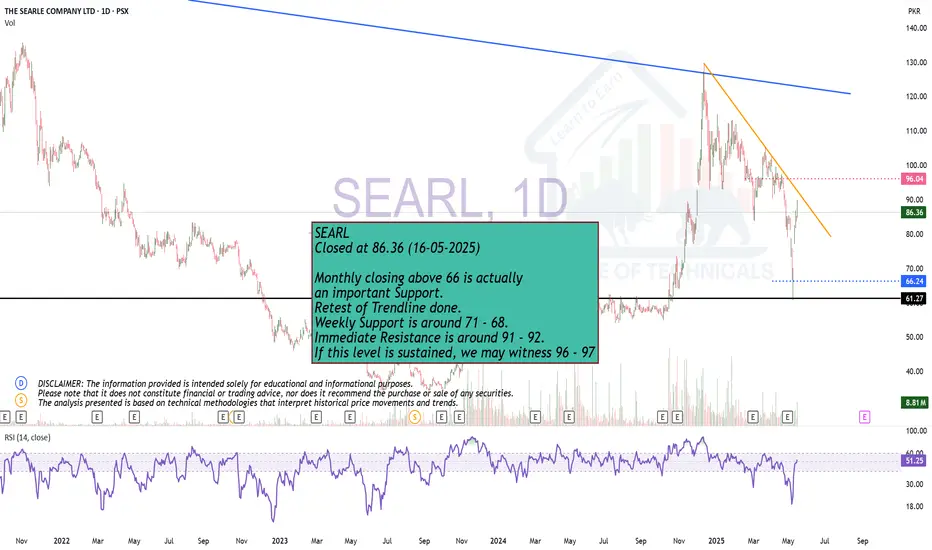
Play on levelsMonthly closing above 66 is actually
an important Support.
Retest of Trendline done.
Weekly Support is around 71 - 68.
Immediate Resistance is around 91 - 92.
If this level is sustained, we may witness 96 - 97
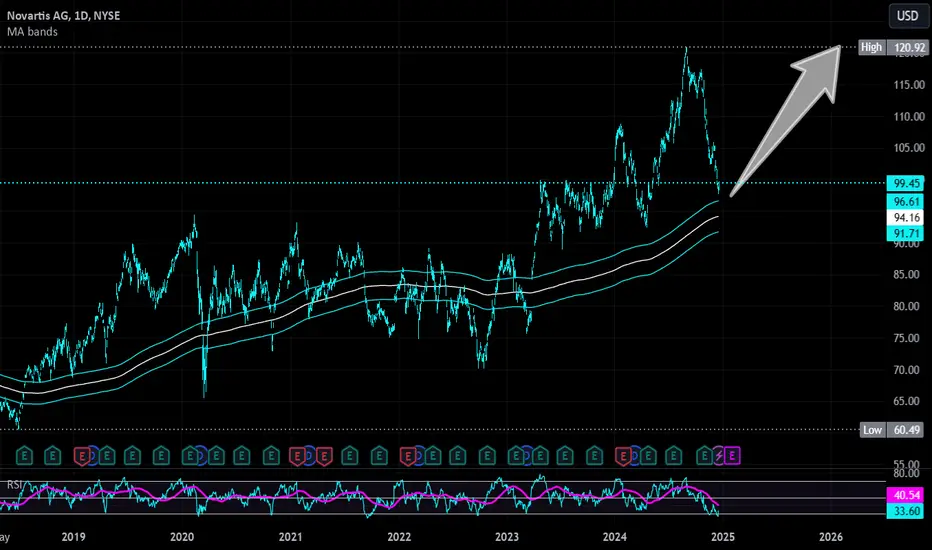
Novartis | NVS | Long at $99.00As one of the largest pharmaceutical companies in the world, Novartis NYSE:NVS is poised to grow well into 2027. It's trading at a 17x P/E, earnings are forecast to grow 7% per year, it has low debt, and has been raising its dividend over the past few years (3.8%). The price on the daily chart is nearing the historical simple moving average line and may be poised for another move up. However, entry into the lower $90's or even $80's is still not off the table and, in my view, a great opportunity. Thus, at $99.00, NYSE:NVS is in a personal buy zone.
Target #1 = $110.00
Target #2 = $120.00
Though Bullish on Monthly tf, butGLAXO Closed at 390.42 (23-05-2025)
Though Bullish on Monthly tf, but weekly bearish
divergence has started appearing.
Important Support level is around 367 - 372; but
important to Sustain 388 - 390 atleast for further upside.
Immediate Resistance is around 410 - 420
Breaking 300 will bring more selling pressure.

Can Lilly Redefine Weight Loss Market Leadership?Eli Lilly is rapidly emerging as a dominant force in the burgeoning weight loss drug market, presenting a significant challenge to incumbent leader Novo Nordisk. Lilly has demonstrated remarkable commercial success despite its key therapy, Zepbound (tirzepatide), entering the market well after Novo Nordisk's Wegovy (semaglutide). Zepbound's substantial revenue in 2024 underscores its rapid adoption and strong competitive standing, leading market analysts to project Eli Lilly's obesity drug sales will surpass Novo Nordisk's within the next few years. This swift ascent highlights the impact of a highly effective product in a market with immense unmet demand.
The success of Eli Lilly's tirzepatide, the active ingredient in both Zepbound and the diabetes treatment Mounjaro, stems from its dual mechanism targeting GLP-1 and GIP receptors, offering potentially enhanced clinical benefits. The company's market position was further solidified by a recent U.S. federal court ruling that upheld the FDA's decision to remove tirzepatide from the drug shortage list. This legal victory effectively halts compounding pharmacies from producing unauthorized, cheaper versions of Zepbound and Mounjaro, thereby protecting Lilly's market exclusivity and ensuring the integrity of the supply chain for the approved product.
Looking ahead, Eli Lilly's pipeline includes the promising oral GLP-1 receptor agonist, orforglipron. Positive Phase 3 trial results indicate its potential as a convenient, non-injectable alternative with comparable efficacy to existing therapies. As a small molecule, orforglipron offers potential advantages in manufacturing scalability and cost, which could significantly expand access globally if approved. Eli Lilly is actively increasing its manufacturing capacity to meet anticipated demand for its incretin therapies, positioning itself to capitalize on the vast and growing global market for weight management solutions.
A Long-term Bullish Trend ?With an upcoming Earnings report we can observe rather uncertain future behavior.
But since the trend has been bearish for a longer period of time and the price is "nearly" at the same position which was achieved for the first time in early April in 2019, we can, mostly based only on the technical analysis and Earnings report, determine quite confidently that the price is ready to rise.
Important data:
EPS Estimate: -$3.12
Revenue Estimate: $106 million to $166.7 million
Notable developments:
Cost-cutting initiative = Targeting $1.1B in reductions by 2027
By the end of 2024 $9.5 billion allocated in investments

Undervalued, Oversold, Overlooked: MRK Hits The Key Zone!Hi all,
Merck & Co. (MRK) is a global pharmaceutical titan and is currently trading near its 52-week low of ~$79. Anchored by Keytruda’s 7% YoY revenue growth, a stable ~4% dividend yield, and an average fair value estimate of $156.59 (98% upside), MRK appears significantly undervalued.
Analysts forecast a 12-month price target of $118.05, implying 49% upside, supported by a strong pipeline and solid financials. While tariff concerns and Keytruda’s 2028 patent expiration pose risks.
Technically speaking, MRK has fallen 43% from its all-time high and has reached the strongest area on the chart—a key support zone offering a compelling opportunity to build mid- or long-term positions. This critical area is defined by multiple technical factors, creating a high-probability setup for a potential reversal:
Role Reversal Support: A broad, well-established resistance zone, aged like fine wine, has now flipped to act as support. This classic role reversal provides significant confluence to the setup.
Textbook Trendline: A perfectly respected trendline, straight out of technical analysis textbooks, has consistently held. The price has approached this trendline from higher highs, underscoring its strength as a key support level.
50% Retracement Level: A critical level often watched for potential reversals.
Monthly EMA200 Confluence: The 200-period exponential moving average on the monthly chart adds further strength to this area, reinforcing its technical significance.
Strategic Guidance:
This setup requires strong conviction. If you’re not prepared to buy in the lower gray areas of this support zone (marked on the chart), do not initiate a position.
In today’s market sentiment, your fundamental research must be robust, and technical analysis allows you to get that much confidence to make it happen!
Ask yourself: If the price falls further into the gray zones, am I willing to buy more? If your answer is yes, the current price presents a strong entry point for mid- to long-term positions.
If the answer is no—if you’re unsure about buying at lower levels or find yourself questioning what to do if prices drop further—refrain from starting a position. In volatile markets, clarity and discipline are essential. Only enter if your strategy is clear and your conviction matches the opportunity!
Good luck,
Vaido

NEULANDLAB short opportunityUpon the breakdown of the trendline NEULANDLAB has immense downside of 42 odd percentage. Next quarter results will be the catalyst, making or breaking the stock. Negative surprise in last two consecutive results declare us participants to beware of the liquidity present below this key level.
Short below daily close of 11,100
Stoploss - 8%
TP - Trail the 50 DMA close above

Cracks Appearing in J&J's Armor?Johnson & Johnson, a long-established leader in the global healthcare sector, confronts substantial challenges that raise significant questions about its future trajectory and stock valuation. Foremost among these is the persistent and massive litigation surrounding its talc-based baby powder. With tens of thousands of lawsuits alleging links to cancer, the company's strategy to manage this liability via bankruptcy has been repeatedly struck down by courts, most recently rejecting a $10 billion settlement proposal. This forces J&J to potentially face over 60,000 individual claims in court, introducing immense financial uncertainty and the prospect of staggering legal costs and damages.
Compounding these concerns is mounting scrutiny over the company's historical and recent marketing practices. A federal judge recently imposed a $1.64 billion penalty against J&J's pharmaceutical arm for misleading marketing of HIV medications, citing a "deliberate and calculated scheme." This follows earlier multi-million dollar settlements related to alleged improper financial inducements paid to surgeons for orthopaedic implants by its DePuy subsidiary, and tax disputes in India over questionable "professional sponsorship" expenses tied to similar activities. These incidents depict recurring legal and ethical entanglements with significant financial penalties and reputational harm.
Taken together, the unresolved talc litigation, substantial financial penalties from marketing violations, and persistent questions regarding ethical conduct create considerable headwinds for Johnson & Johnson. The cumulative impact of ongoing legal battles, potential future liabilities, and damage to its corporate image threatens to drain resources, divert management focus from core operations, and erode investor confidence. These converging factors present tangible risks that could exert significant downward pressure on the company's stock price moving forward.

Recently made LL on Shorter TF, but..Recently made LL on Shorter TF,
but also it is a Support level with Double Bottom.
Hidden Bullish Divergence on Daily TF.
Immediate Support lies around 86 - 89
& Immediate Resistance is around 91 - 92.
Sustaining 91 - 92 on Weekly TF, would
lead it towards 98 - 99.
Ultimate Target (if 109-110) is Sustained,
is around 128 - 130.
Should not break 81 now.

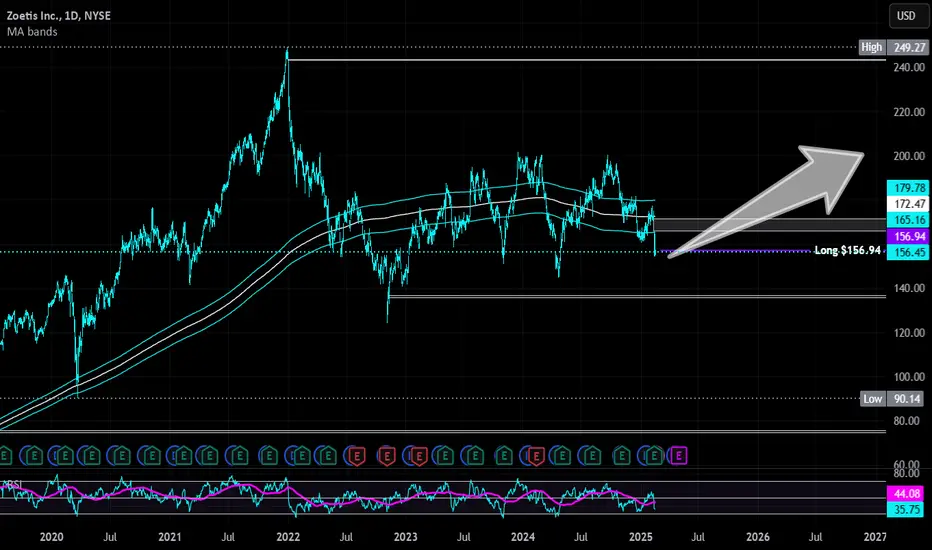
Zoetis | ZTS | Long at $156.94Zoetis NYSE:ZTS , the largest global animal health company, generated more than $9 billion in revenue in 2024 and earnings have grown 9.3% per year over the past 5 years. Free cash flow for FY2024 was over $2.2 billion. Dividend consistently raised every year for the past for years (currently 1.28%). The growth of the company isn't expected to slow any time soon, and I believe the animal health care market will grow right alongside the human health care market - if not potentially faster (people love their pets).
Thus, at $156.94, NYSE:ZTS is in a personal buy zone. There may be some near-term risk with the potential for a daily price-gap close near $136.00, but I personally view that as an even better buy opportunity (unless fundamentals change).
Targets
$170.00
$180.00
$200.00
Bullish Divergence on Shorter TFImmediate Support seems to be
around 82 - 84.
If this level is not sustained, we
may witness 65 - 72 range.
However, Bullish Divergence on Shorter
time frame may give it a spike of 3-5 rupees.

Finally a stock I like...this one is a real dealFinally, an investment idea! (after how much doom and gloom?) — Novo Nordisk.
You will all be familiar with Ozempic, the Danish company’s flagship product and the reason so many celebrities, influencers, b listers and regular schmegular Americans are suddenly skinny. I ignored the stock for most of ‘23/24, because it was so expensive. I am still a value investor (for my sins) and I just didn’t see a lot of value there — it was priced in.
Imagine my surprise as I was thinking about “megatrends” (vom) for the year ahead — AI, data, 'zempy. Novo stock has fallen 37.80% in the last six months. And you know what that means…that’s a real deal!
Why is it a real deal? (Don’t you like booze stocks Eden?)
Ozempic is not going away. At this point it is synonymous with weight loss as “Uber” is to ridesharing or Google is to search.
Note this data per Barclays, from recently issued rx data in the US — Ozempic script issuance has grown +8.4%, while WeGovy slightly trails it at 7.4% — both owned by Novo. While Eli Lilly also makes a GLP, Novo is still the leader.
Strong guidance from management on sales — +16% - 24% — roughly implies revenue of $48bn for ‘25 and $57bn for ‘26…that’s a compounder.
America and much of the western world has an obesity problem. There is a clear incentive for governments to underwrite the drug because obesity has a clear social + fiscal cost on society — per UoA, the fiscal cost of obesity in NZ is at least $2bn¹.
People have an incentive to use Ozempic, because they are vain.
This is a nice hedge against the booze stocks I like so much. Benefit from both sides of the trade — buy booze at low teens multiples; buy Novo and benefit from lower drinking rates as there’s several studies that imply ‘Zempy reduces drinking.
I don’t want Ozempic, because I like to live the good life.
This does not mean the vast majority of people won’t use Ozempic. At the moment, one in eight Americans have used a GLP. That’s +334mn people. 40% of Americans are obsese.
There’s a Lollapalooza effect happening here — a bunch of incentives — vain people, governments wanting less obese people, the various side health benefits of GLPs, etc. I like when a lot of incentives are aligned because you’re relying on psychology rather than projecting numbers on an excel spreadsheet.
Novo has sold off recently due to a trial of its CagriSema drug missing expectations. Eyes on the prize, though — current GLPs, which still have plenty of market to saturate.
Eli Lilly has traded up in recent times, while Novo has traded down. The two tend to trade in lockstep so the disconnect is an opportunity to buy the world’s leading GLP maker at a good price.
Eli Lilly is the closest comp, but it trades at a 38x fwd multiple, while Novo trades at 20x — i.e. an almost 50% multiple discount (see chart). I like that too…
Note analyst recs on chart also…
This analysis is provided by Eden Bradfeld at BlackBull Research—sign up for their Substack to receive the latest market insights straight to your inbox.
