PHAUSDT at Make-or-Break Zone Is This the Calm Before the Storm?📍 Chart Overview (6D Timeframe – Binance)
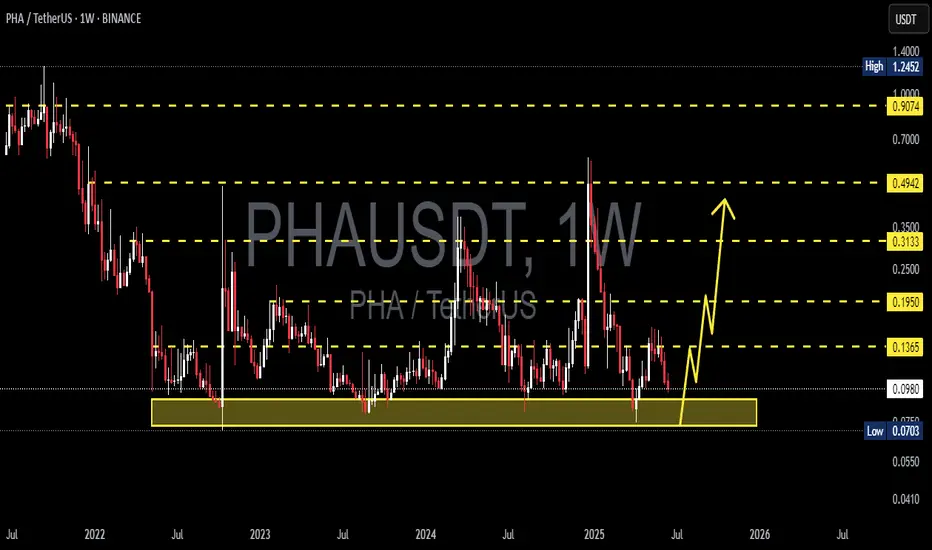
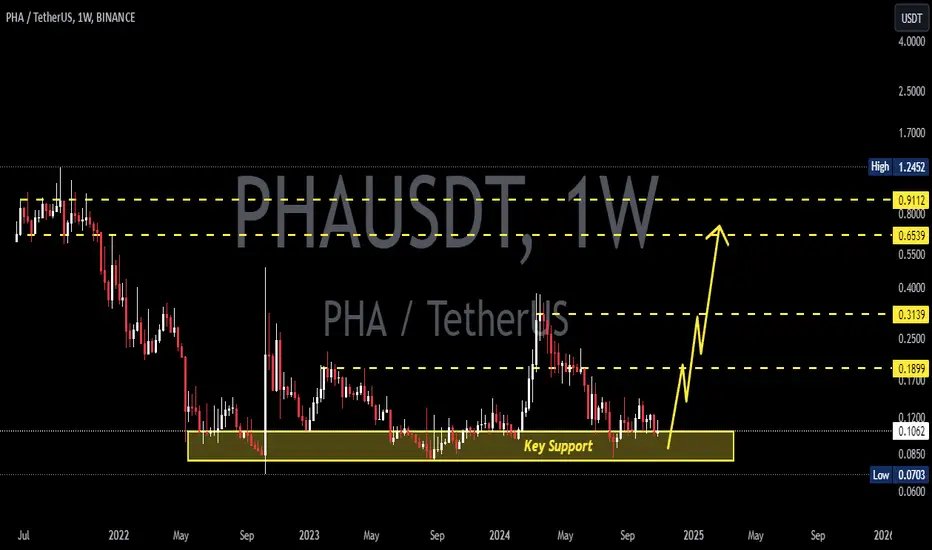
PHA/USDT is currently retesting a major historical demand zone between $0.0703 - $0.0986, highlighted by the yellow box. This zone has acted as a strong base since mid-2022, repeatedly absorbing selling pressure and bouncing the price back up.
Over the past two years, this accumulation zone has consistently held, forming a classic sideways structure, typically seen before a major breakout. However, the inability to break through the upper resistances suggests persistent bearish pressure.
Now, the market is nearing a make-or-break moment that could lead to a decisive move in either direction.
---
🔎 Pattern Identified: "Extended Accumulation + Volatility Compression"
The price is trading inside a long-term accumulation range, indicating that smart money might be quietly buying.
We're seeing signs of volatility compression, a precursor to breakout volatility.
Repeated lower wicks near the demand zone show strong buying interest on dips.
This setup may produce a “spring” scenario, where a false breakdown triggers a strong reversal rally.
---
🟢 Bullish Scenario (Rejection From Demand Zone):
If the price continues to hold above $0.0986 and forms a higher low structure:
Bullish Targets:
1. $0.1357 – Minor historical resistance
2. $0.1897 – Key horizontal resistance
3. $0.3790 – Mid-range breakout target
4. $1.0666 – Long-term retracement target
Bullish Confirmation Signals: ✅ Break and daily close above $0.1357
✅ Increased volume on breakout
✅ Bullish candle structure near support
---
🔴 Bearish Scenario (Breakdown of Accumulation Zone):
If the price fails to hold $0.0703 – $0.0986 and breaks down with strong volume:
Bearish Targets:
1. $0.0590 – Psychological support
2. Below $0.0500 – Open downside
3. Trend shifts into bearish continuation structure
Bearish Confirmation Signals: ❌ Strong close below $0.0703
❌ Volume spike on red candle
❌ Lack of bullish response
---
🧠 Strategic Notes for Traders & Investors:
This zone offers a low-risk, high-reward opportunity for speculative positioning, with a tight stop-loss below $0.0703.
Due to prolonged compression, any breakout (up or down) could be explosive.
Be cautious of false breakouts. Wait for confirmation via volume and price action.
---
🗣️ Conclusion:
PHA/USDT is sitting at a technical inflection point that has historically triggered strong market reactions. After two years of coiling price action, this extended accumulation phase is nearing its resolution.
What happens next will likely define the long-term trajectory for this asset. Don’t sleep on this setup — whether you’re bullish or bearish, this is where attention should be focused.
#PHAUSDT #PHA #CryptoAnalysis #AltcoinSetup #TechnicalAnalysis #BreakoutWatch #AccumulationZone #StrongSupport #CryptoTrading
Phausdtsignals

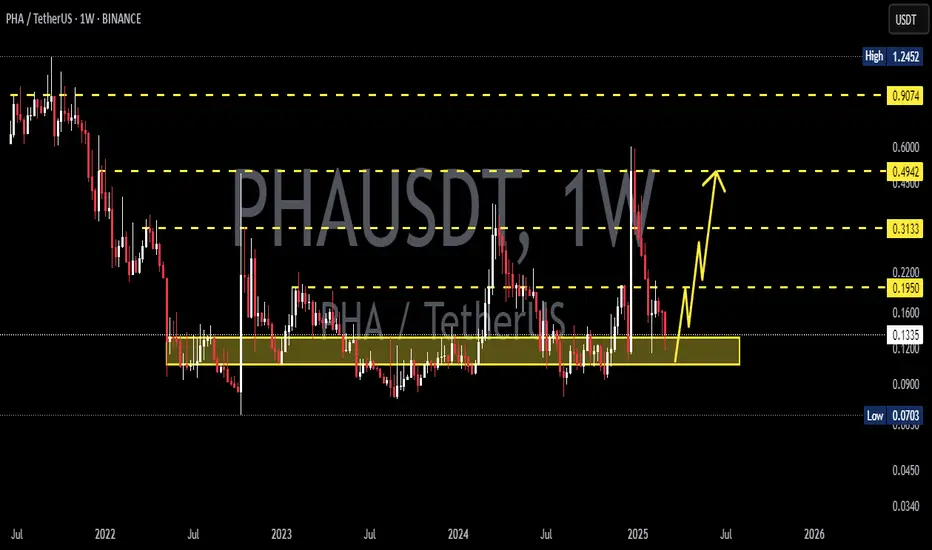
PHA Bounce from Historical Support ZonePHA is showing signs of a potential bullish reversal after bouncing off a long-standing support zone. Price has consistently respected this support level since mid-2022, creating a strong base. Now, we’re seeing bullish momentum building as the weekly candle breaks above the 50-week EMA, which had acted as dynamic resistance in the past.
A break above the recent swing high could trigger a larger move toward the $0.25–$0.35 resistance area. As long as the support zone remains intact, the structure remains bullish.
Cheers
Hexa

PHAUSDT 1W AnalysisPHA ~ 1W Analysis
#PHA Buy back on retest of this support block with short term target of at least 20%+ from this support.
PHAUSDT 1D AnalysisPHA ~ 1D Analysis
#PHA Buy when re -testing this support block with a short -term target of at least 10%+ from here.

PHAUSDT 1WPHA ~ 1W Analysis
#PHA Buy back gradually from here with a short -term target of at least 20%+.
This is the lowest support for now.

PHAUSDT 1WPHA ~ 1W Analysis
#PHA Buy gradually from here if you still have a Conviction on this Coin. with a short -term target of at least 20%+.
PHAUSDT 1WPHA Update ~ 1W
#PHA So far it still maintains its bullish structure. This is the support block of the golden ratio,. Buy in stages. with a minimum target of 20%+
PHAUSDT Nearing Breakout Zone!PHAUSDT technical analysis update
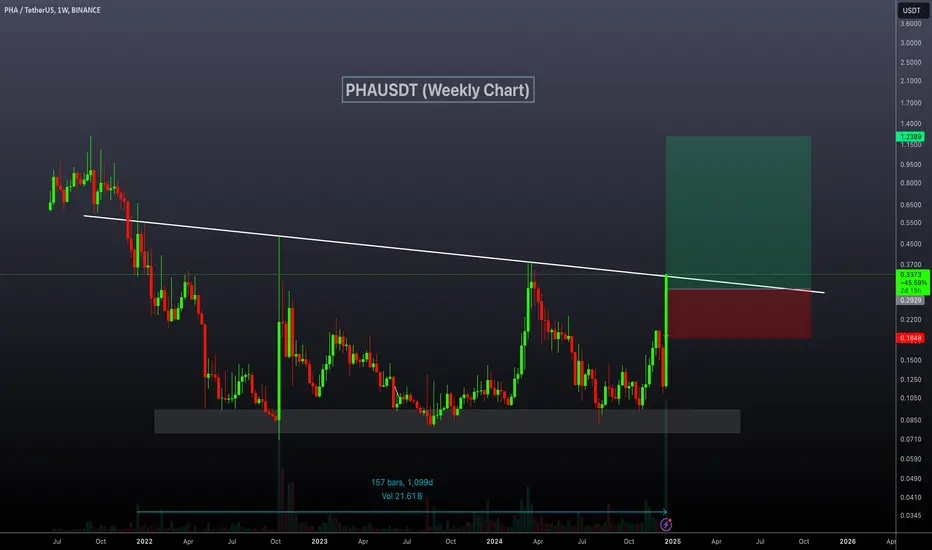
PHAUSDT has been ranging for the last 1100 days and is now moving towards the range resistance line for a breakout. A strong bullish move can be expected once a breakout is confirmed on the daily chart. An increase in volume near the resistance is also observed.
Stop loss : $0.18
Take Profit 1: $0.41
Take Profit 2: $0.61
Take Profit 3: $1.23
PHAUSDTPHA ~ 1W
#PHA So far have continued to maintain this support block. If you still have Conviction on this coin,. This support block would be a very good buy for now. With a minimum target 20%++
PHAUSDTPHA ~ 1W
#PHA Maybe if you are interested in this coin,. you need to pay attention to this key Support,. Last time the price bounced off this key support. at least for a minimum 20%++ profit.

PHAUSDT 6 Day timeframe TargetBINANCE:PHAUSDT
PHA USDT , I am seeing a falling wedge on a 6 Day timeframe that can take phala to the next level.
also it touches the bottom.
A very good project AI and DEPIN.
not a financial advise.DYOR

PHAUSDT 30 min binance update PHAUSDT SHOWING SUPPORT AROUND 0.14$
Main resistance areas are mentioned and stop also
Play wisely

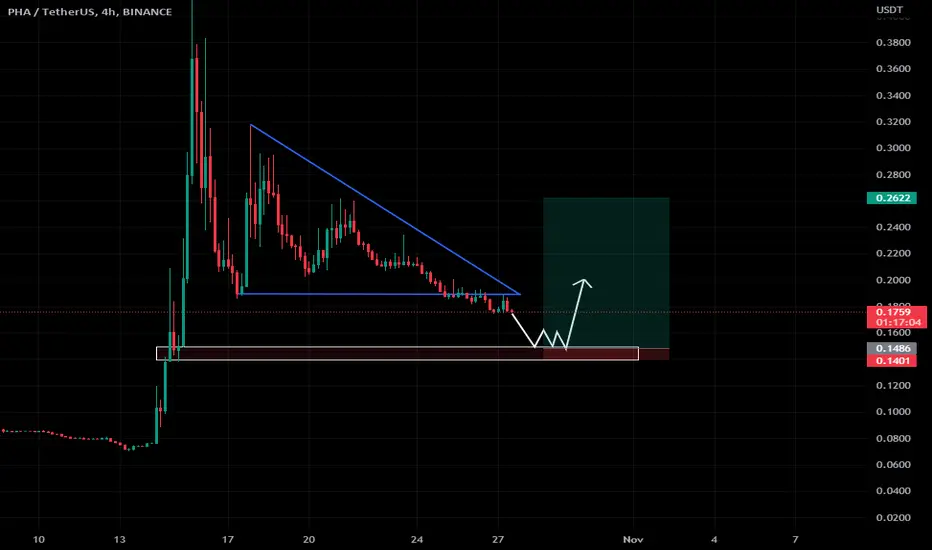
pha usdt buying setuppha coin currently trade at 0.175$
its brok now decendending triangle pattern on4h time frame chart.
now possible we seee it soon on its strong support area at 0.15$-0.14$
also bounce back expected from this support.
good buying range for shortterm profit is 0.14-0.15 cents
sell targets depend on you according to your investment plan
follow me for more updates.
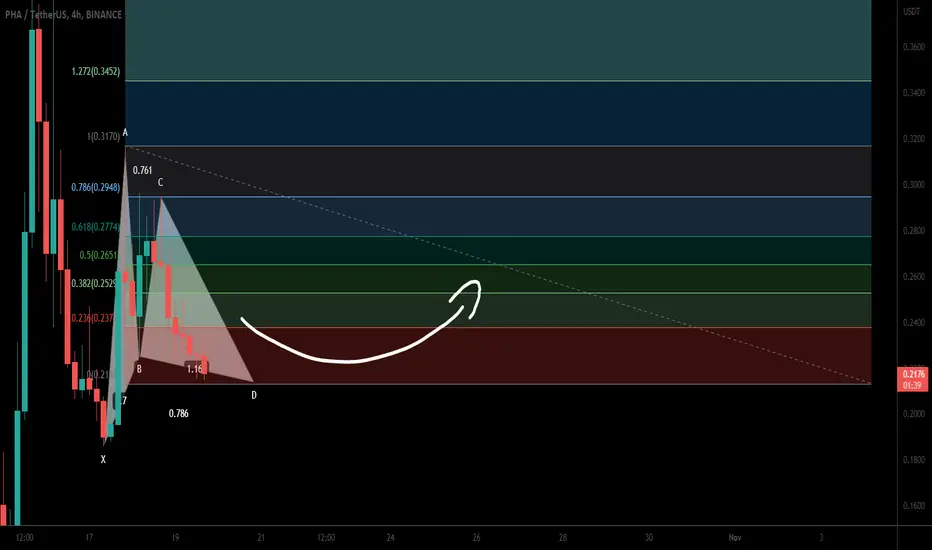
Phala Network (PHA) formed bullish Gartley for upto 58.50% moveHi dear friends, hope you are well, and welcome to the new update on Phala Network ( PHA ) coin with the US Dollar pair.
First of all congratulations to you all, for another such wonderful long-term trade, which is completed now. And it has rallied more than 530%
Now on a 4-hr time frame, PHA is about to complete the final leg of a bullish Gartley pattern.
Note: Above idea is for educational purpose only. It is advised to diversify and strictly follow the stop loss, and don't get stuck with trade
PHAUSDT up +600% in three days! Where to buy next?*** ***
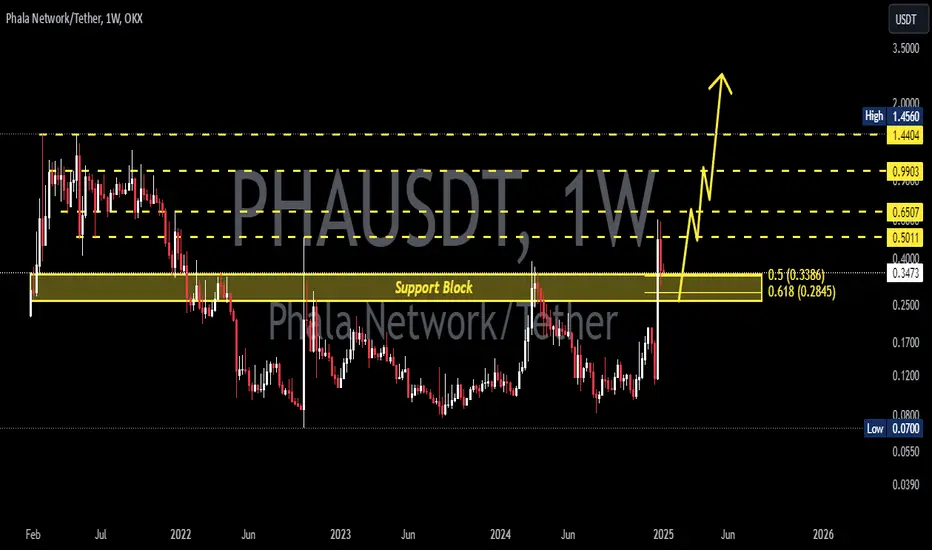
For this particular analysis on Phala Network we are using the PHAUSDT symbol on the OKX exchange.
*** ***
The idea is on the 1D time-frame where PHA is having an incredible stretch rising +600% since its Thursday bottom! This massive pump broke above its 1D MA50 (blue trend-line), 1D MA200 (orange trend-line) and 1W MA50 (red trend-line) in just two days! With the 1D RSI vastly overbought, the questions arises: Where can we buy next?
Naturally, a strong pull-back is expected on Phala Network based primarily on short-term profit-taking. The strongest candidate will be the 0.5 - 0.382 Fibonacci retracement zone (counting from the September 16 2021 High), which has been the High Volatility Zone from late January to early May 2022. If that fails, the final buy entry can be made on the 0.618 Fib (orange lines) of this recent pump move. Additionally when/ if the RSI hits the 30.000 level. In either case, the next target should be the 0.786 Fib and the 2021 High itself.
-------------------------------------------------------------------------------
** Please LIKE 👍, SUBSCRIBE ✅, SHARE 🙌 and COMMENT ✍ if you enjoy this idea! Also share your ideas and charts in the comments section below! This is best way to keep it relevant, support me, keep the content here free and allow the idea to reach as many people as possible. **
-------------------------------------------------------------------------------
You may also TELL ME 🙋♀️🙋♂️ in the comments section which symbol you want me to analyze next and on which time-frame. The one with the most posts will be published tomorrow! 👏🎁
-------------------------------------------------------------------------------
👇 👇 👇 👇 👇 👇
💸💸💸💸💸💸
👇 👇 👇 👇 👇 👇
