PHBUSDT Bounces from the Golden Pocket?🧠 Market Context & General Analysis
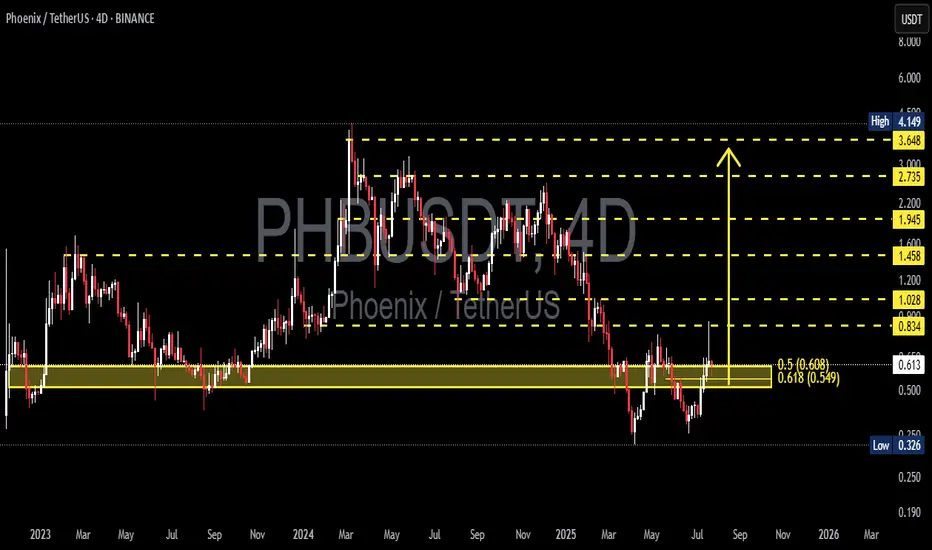
Phoenix (PHB) is currently at a critical juncture in its market structure. After a prolonged downtrend from its 2024 highs, price has now reacted strongly off a key Fibonacci Golden Pocket retracement zone (0.5–0.618), which also aligns with a historically respected demand area.
This level is not just a technical formality – it’s a zone where smart money typically enters, and historically it has provided reliable bullish reversals.
---
📍 Key Zones to Watch
🟨 Demand / Accumulation Zone:
0.549 – 0.608 → Fibonacci 0.5–0.618 + Historical support
⤷ Has been retested and shows early signs of a bullish reaction.
📈 Layered Resistance Zones (Fibonacci Targets):
0.834 → Minor resistance + potential double bottom neckline
1.028 → Previous structural resistance
1.200 → Psychological round level
1.458 → Key Fibonacci extension
1.945 – 2.735 – 3.648 → Mid/long-term Fibonacci targets
4.149 → All-Time High (ATH) on this chart
🔻 Major Support if Breakdown Occurs:
0.326 → Historical bottom / last line of defense
---
🧩 Pattern Formation: What’s Emerging on the Chart?
🔄 Potential Double Bottom:
Price structure is showing signs of a potential reversal formation in the form of a double bottom near the 0.55–0.61 zone. A confirmed breakout above the neckline at 0.834 would validate this bullish setup.
📉 Broken Downtrend Channel?:
PHB was previously trading in a downtrend channel. The current move suggests a possible breakout and the beginning of a trend shift or accumulation phase.
---
✅ Bullish Scenario: The Rise of the Phoenix
If the price holds above 0.608 and confirms with a strong breakout above 0.834, a bullish trend reversal could follow.
🚀 Short-term targets: 0.834 → 1.028
🔥 Mid-term targets: 1.200 → 1.458 → 1.945
🌕 Long-term potential: 2.735 – 3.648 – 4.149
Validation Key: Break above 0.834 with strong volume
Bullish confirmation candle: Bullish engulfing / Marubozu on 4D or Daily
---
⚠️ Bearish Scenario: Breakdown Threat Looms
If the price fails to hold the 0.549 support level, we could see a continuation of the downtrend, potentially targeting:
💀 First stop: 0.45 – 0.40 zone
🧊 Extreme case: Drop toward 0.326 (historical low)
Breakdown Confirmation:
Daily or 4D close below 0.549
Followed by selling volume and no quick recovery
---
🎯 Potential Trading Strategies (Not Financial Advice):
🟢 Bullish Swing Entry: Buy zone at 0.55–0.61
⤷ Targets: 0.834 – 1.028
⤷ Stop-loss: Below 0.52 (close basis)
🔴 Breakout Trade: Enter on breakout above 0.834 with volume
⤷ Targets: 1.200 – 1.945
⤷ Stop-loss: Below 0.80
🔵 Bearish Play / Re-entry: Short if break below 0.549
⤷ Targets: 0.40 – 0.326
⤷ Stop-loss: Above 0.60
---
🧲 Final Thoughts
PHBUSDT is in a make-or-break zone, sitting atop the Golden Pocket and showing early bullish momentum. If buyers step in and maintain the momentum, we could be witnessing the early stages of a significant market reversal.
However, failure to hold the key support at 0.549 would likely shift the sentiment back into bearish territory. Volume and confirmation candles will be the deciding factor for the trend’s next direction.
#PHBUSDT #PhoenixCrypto #AltcoinReversal #GoldenPocket #CryptoTA
#FibonacciLevels #BullishSetup #BearishBreakdown #ChartPatterns
Phbanalysis
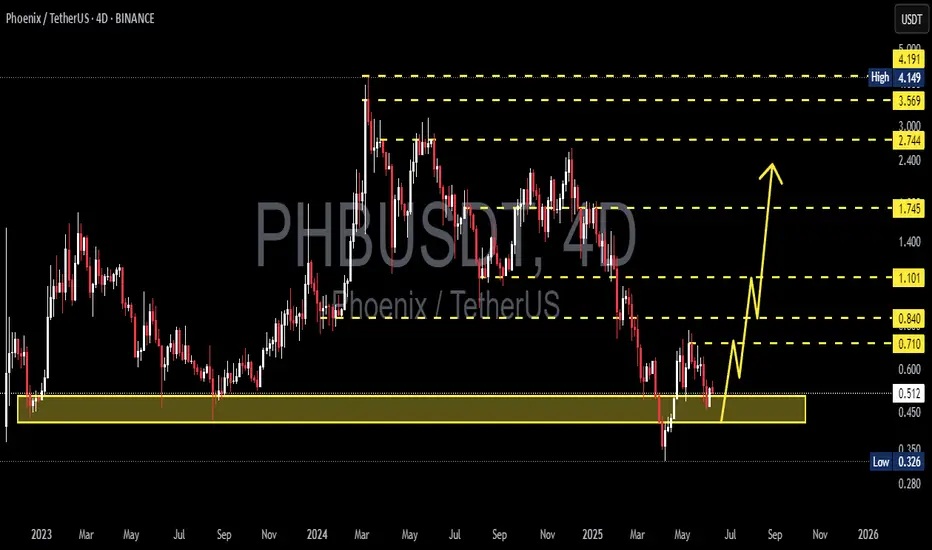
PHBUSDT 4D AnalysisPHB ~ 4D Analysis
#PHB This trade is very High risk, Buy gradually from here if you still have confidence in this coin with a short term target of at least 15%+ from here.
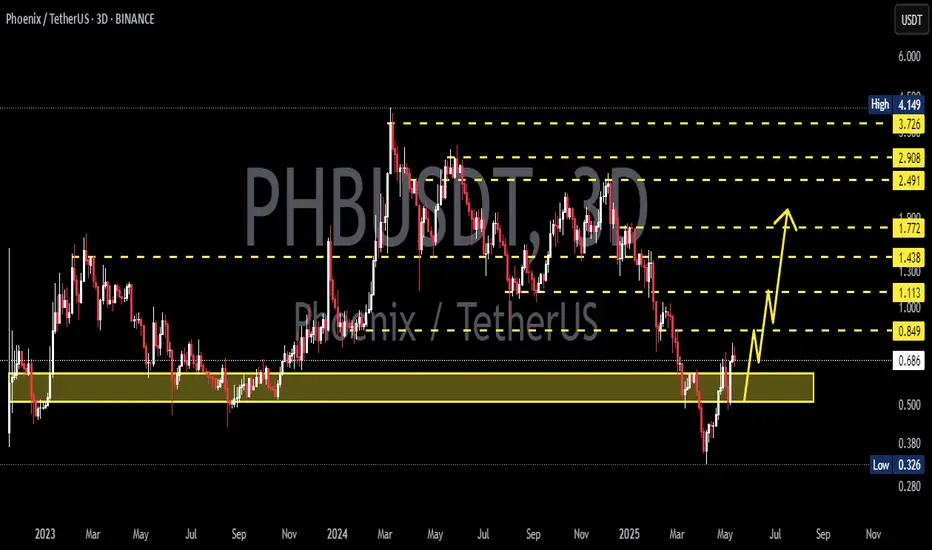
PHBUSDT 3D Analysis PHB ~ 3D Analysis
#PHB Buy from here if you still have confidence in this coin with a short term target of at least 15%++
PHBUSDT 6DPHB ~ 6D Analysis
#PHB Buy gradually from here with a short -term target of at least 20%+
The reason, this is the lowest support, before the price rises high.

PHBUSDT 3DPHB ~ 3D
#PHB for now continues to maintain this Support block,. Buy gradually on this support,. with a minimum target of 20%++

PHBUSDT long Spot TradePHBUSDT Elliott Wave Technical Analysis
Mode: impulse
Position: Wave (4)
Direction: Wave (4) is still in play
Details: Wave (4) is still in play which I expected to be end around 2.2-1.95 which will be my entry point.
Next Direction: Wave (5)
Targets :
TP1: 4.3 with about 100% profit
TP2: 4.9 with about 140% profit
TP3: the area between 5.2-5.4 with about 160% profit
Wave Cancel invalid level: Daily closing below 1.79 with 12% loss.
Disclaimer:
This analysis is intended for educational and informational purposes only and should not be construed as financial advice. Always conduct your own due diligence and consult with a professional financial advisor before making investment decisions.

PHBUSDT.4HPHB/USDT 4-hour chart, several critical technical indicators and levels stand out, providing insights into potential price movements.
Trend and Resistance Analysis:
The chart shows that Phoenix (PHB) has experienced a significant upward trend recently, with the current price at approximately 2.9137 USD. The price is following an upward sloping trend line, indicating strong bullish momentum. There are two major resistance levels to watch: R1 at 3.1619 USD and R2 at 3.8438 USD. The price is currently approaching R1, and a successful break above this level could see it testing R2, indicating further bullish momentum.
Support Levels:
On the downside, the primary support level is identified as S1 at 2.4241 USD. This level has shown strong buying interest and could act as a floor if the price starts to decline. Below S1, the next significant support levels are S2 at 2.0440 USD and S3 at 1.1253 USD, which have been critical support zones in the past.
Volume Analysis:
The volume pattern indicates that the recent upward movements were accompanied by substantial trading volume, reinforcing the bullish sentiment. High volume on price increases typically suggests strong market participation and confidence in the upward trend.
Conclusion:
In conclusion, the PHB/USDT pair is currently in a strong bullish trend, supported by a rising trend line and significant trading volume. The key resistance levels to watch are 3.1619 USD and 3.8438 USD. A break above these levels would confirm continued bullish momentum. On the downside, the support levels at 2.4241 USD, 2.0440 USD, and 1.1253 USD are critical for maintaining the bullish outlook. A failure to hold these support levels could lead to a deeper retracement.
Overall, the market sentiment for PHB remains optimistic, with critical attention needed at the aforementioned levels and indicators to make informed trading decisions.

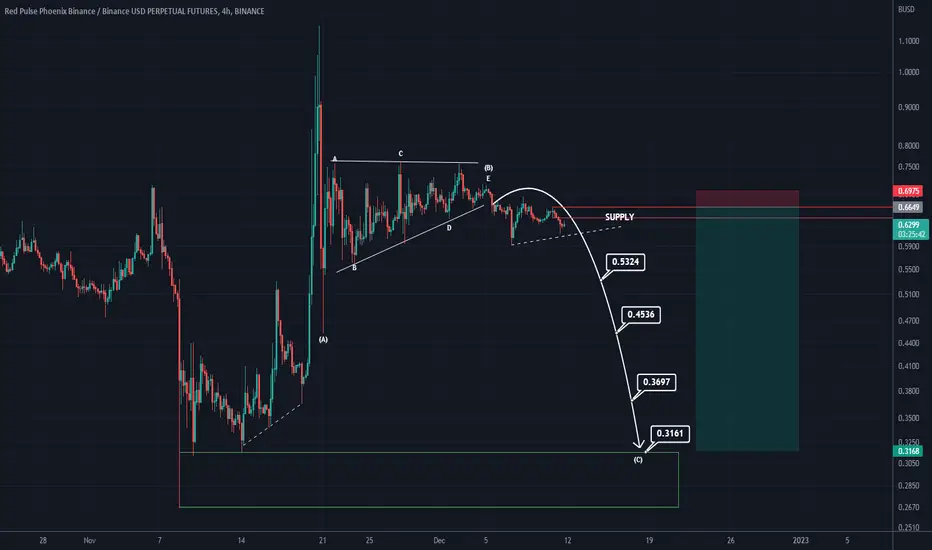
PHB LOOKS BEARISHBy maintaining the red range of supply, it seems that PHB can drop more.
A liquidity pool is swept above and then the Order Flow (OF) is well done.
Now we have liquidity pools in the lower limits, it is expected that the price of the lower pools will also collect.
By LSH, we mean the Long Shadow, which is a marked support on the chart.
The targets are marked on the chart. Closing a daily candle above the supply range will violate the analysis
For risk management, please don't forget stop loss and capital management
When we reach the first target, save some profit and then change the stop to entry
Comment if you have any questions
Thank You

PHB Chinese Narrative to $6Hi guys !
Since Chinese narrative is around the corner
Here is the AMEX:PHB one of the biggest coin for Chinese narrative seasooooon!
Based on my T.A
AMEX:PHB is currently on Ascending Broadening Wedge, that targeting the next resistance which is located around $3 to $6
with this Volume at the major support, Chinese narrative season and the fundamental of this coin I am really confident on this one
Thank me later if you profit from here...
Buy me something!
HAHAHAH charot!
Godluck! trade responsibly

PHBBUSD SHORT SETUPHello, dear traders. how are you ? Today we have a setup to SELL/SHORT the PHB symbol.
For risk management, please don't forget stop loss and capital management
When we reach the first target, save some profit and then change the stop to entry
Comment if you have any questions
Thank You
PHB near the bottom again, nice opportunity for buy and holdYOUR LIKE OR COMMENT IS MY FUEL FOR NEXT ANALYSIS :) IF U HAVE ANY QUESTION REACH ME HERE
This is not a financial advice. Always do your own research and always put stoploss in your trade (SL) :) If you want more detailed info how to study and read charts or just need help with some coin, just write to me here a comment, i will try to answer to everybody... i can help you :) all for free, don't worry, BE HAPPY!

Start strong moves to climb againIt has seen its lowest price and after Pollback, it is on a good support level
There are almost two divergences and a double bottom in the chart, which has raised expectations for growth
High risk is, and must be careful

PHBBTC 1W-TIMEFRAME ANALYSIS✨PHBBTC 1W-TIMEFRAME ANALYSIS✨
Hello ladies and gentlemen
This is my new idea for Phoenix Global PHBBTC
I expect the price to move higher...
I hope my idea is clear
Support me by like and share
Stay Safe💯
Good luck💰
