PHBUSDT Bounces from the Golden Pocket?🧠 Market Context & General Analysis
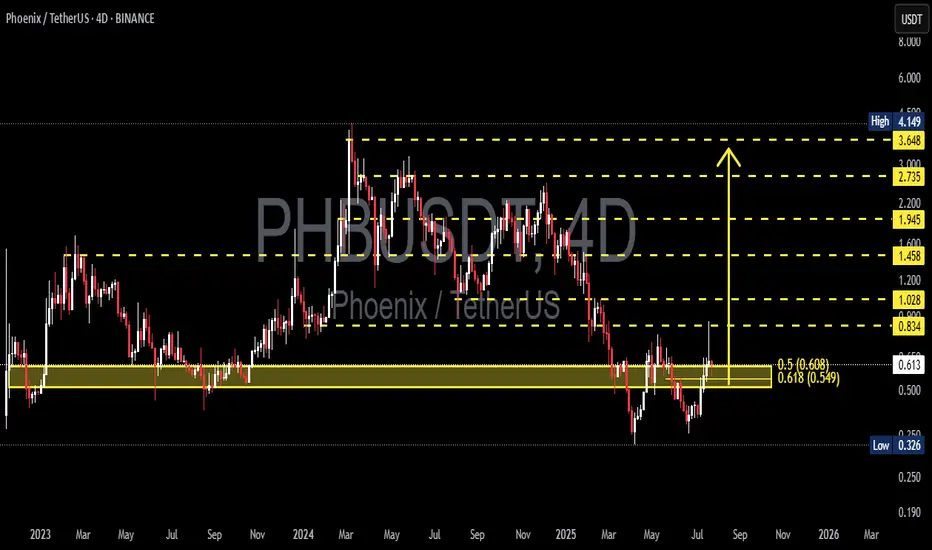
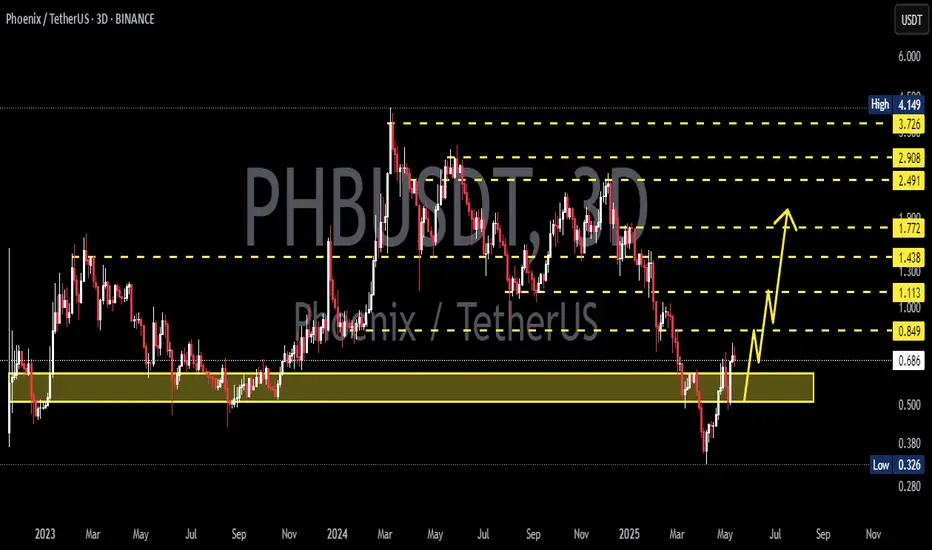
Phoenix (PHB) is currently at a critical juncture in its market structure. After a prolonged downtrend from its 2024 highs, price has now reacted strongly off a key Fibonacci Golden Pocket retracement zone (0.5–0.618), which also aligns with a historically respected demand area.
This level is not just a technical formality – it’s a zone where smart money typically enters, and historically it has provided reliable bullish reversals.
---
📍 Key Zones to Watch
🟨 Demand / Accumulation Zone:
0.549 – 0.608 → Fibonacci 0.5–0.618 + Historical support
⤷ Has been retested and shows early signs of a bullish reaction.
📈 Layered Resistance Zones (Fibonacci Targets):
0.834 → Minor resistance + potential double bottom neckline
1.028 → Previous structural resistance
1.200 → Psychological round level
1.458 → Key Fibonacci extension
1.945 – 2.735 – 3.648 → Mid/long-term Fibonacci targets
4.149 → All-Time High (ATH) on this chart
🔻 Major Support if Breakdown Occurs:
0.326 → Historical bottom / last line of defense
---
🧩 Pattern Formation: What’s Emerging on the Chart?
🔄 Potential Double Bottom:
Price structure is showing signs of a potential reversal formation in the form of a double bottom near the 0.55–0.61 zone. A confirmed breakout above the neckline at 0.834 would validate this bullish setup.
📉 Broken Downtrend Channel?:
PHB was previously trading in a downtrend channel. The current move suggests a possible breakout and the beginning of a trend shift or accumulation phase.
---
✅ Bullish Scenario: The Rise of the Phoenix
If the price holds above 0.608 and confirms with a strong breakout above 0.834, a bullish trend reversal could follow.
🚀 Short-term targets: 0.834 → 1.028
🔥 Mid-term targets: 1.200 → 1.458 → 1.945
🌕 Long-term potential: 2.735 – 3.648 – 4.149
Validation Key: Break above 0.834 with strong volume
Bullish confirmation candle: Bullish engulfing / Marubozu on 4D or Daily
---
⚠️ Bearish Scenario: Breakdown Threat Looms
If the price fails to hold the 0.549 support level, we could see a continuation of the downtrend, potentially targeting:
💀 First stop: 0.45 – 0.40 zone
🧊 Extreme case: Drop toward 0.326 (historical low)
Breakdown Confirmation:
Daily or 4D close below 0.549
Followed by selling volume and no quick recovery
---
🎯 Potential Trading Strategies (Not Financial Advice):
🟢 Bullish Swing Entry: Buy zone at 0.55–0.61
⤷ Targets: 0.834 – 1.028
⤷ Stop-loss: Below 0.52 (close basis)
🔴 Breakout Trade: Enter on breakout above 0.834 with volume
⤷ Targets: 1.200 – 1.945
⤷ Stop-loss: Below 0.80
🔵 Bearish Play / Re-entry: Short if break below 0.549
⤷ Targets: 0.40 – 0.326
⤷ Stop-loss: Above 0.60
---
🧲 Final Thoughts
PHBUSDT is in a make-or-break zone, sitting atop the Golden Pocket and showing early bullish momentum. If buyers step in and maintain the momentum, we could be witnessing the early stages of a significant market reversal.
However, failure to hold the key support at 0.549 would likely shift the sentiment back into bearish territory. Volume and confirmation candles will be the deciding factor for the trend’s next direction.
#PHBUSDT #PhoenixCrypto #AltcoinReversal #GoldenPocket #CryptoTA
#FibonacciLevels #BullishSetup #BearishBreakdown #ChartPatterns
PHBUSDTPERP
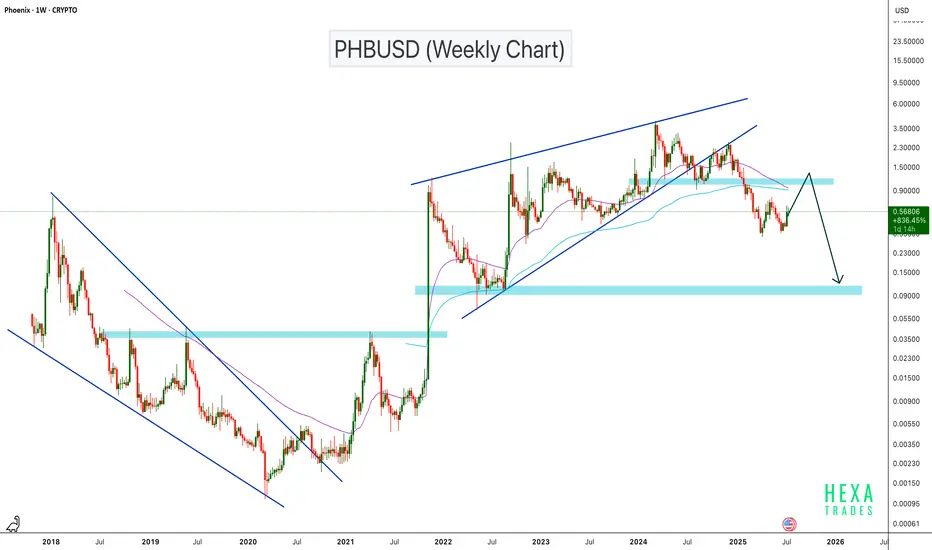
PHBUSD Breakdown: Rising Wedge Signals Bearish ContinuationPHBUSD has broken down from a rising wedge pattern on the weekly chart, signaling a potential trend reversal. The price is currently attempting a retest of the previous support zone at the $1.00–$1.20 level, which is now likely to act as resistance. If this retest fails, it could confirm a bearish continuation setup, with the next key support zone around $0.10. This level has previously acted as a major base and could serve as the next downside target
BINANCE:PHBUSDT AMEX:PHB
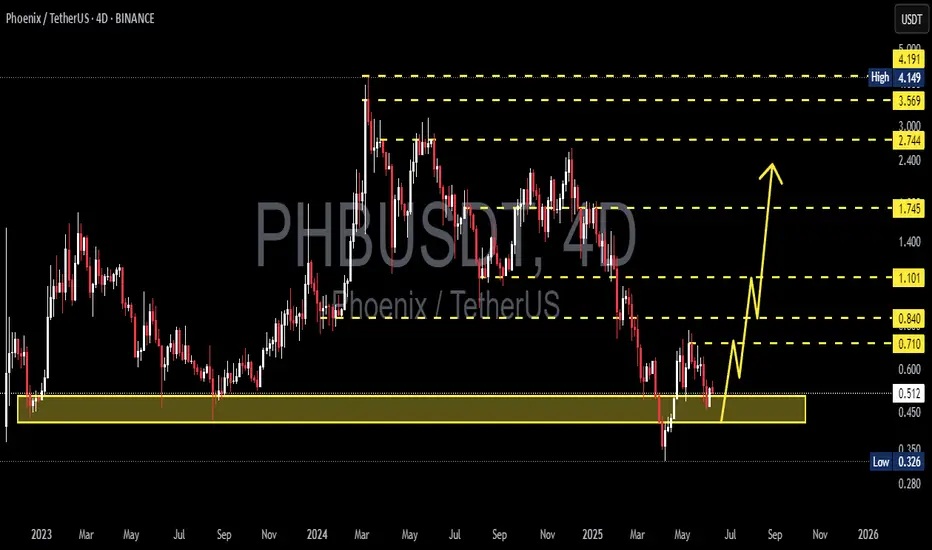
PHBUSDT 4D AnalysisPHB ~ 4D Analysis
#PHB This trade is very High risk, Buy gradually from here if you still have confidence in this coin with a short term target of at least 15%+ from here.
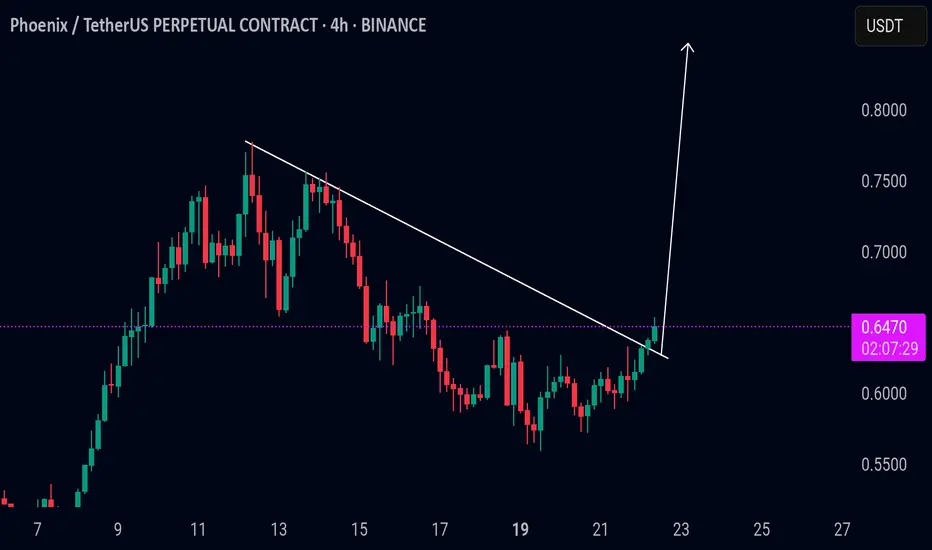
PHB/USDT trendline breakout alertPHB/USDT trendline breakout alert
PHB has broken above a key descending trendline, signaling a potential shift in momentum from bearish to bullish. Trendline breakouts often indicate the end of a correction or consolidation phase and the beginning of a new trend.
If PHB holds above the breakout level with increasing volume, it could lead to further upside. However, a drop back below the trendline may invalidate the breakout and signal a false move.
Key levels to watch:
* Retest of the broken trendline as support
* Immediate resistance overhead
* Volume confirmation for strength
Monitor PHB closely — this breakout could be the start of a trend reversal if confirmed.
PHBUSDT 3D Analysis PHB ~ 3D Analysis
#PHB Buy from here if you still have confidence in this coin with a short term target of at least 15%++
PHBUSDT 6DPHB ~ 6D Analysis
#PHB Buy gradually from here with a short -term target of at least 20%+
The reason, this is the lowest support, before the price rises high.

PHBUSDT 3DPHB ~ 3D
#PHB for now continues to maintain this Support block,. Buy gradually on this support,. with a minimum target of 20%++

PHBUSDTPHB ~ 1W
#PHB Forming a bullish pattern on the 1W Time frame. If you have Conviction on this coin,. Wait for the resistance line of this pattern to be successfully broken through with strong volume. after that buy in stages. with a minimum target of 20%++

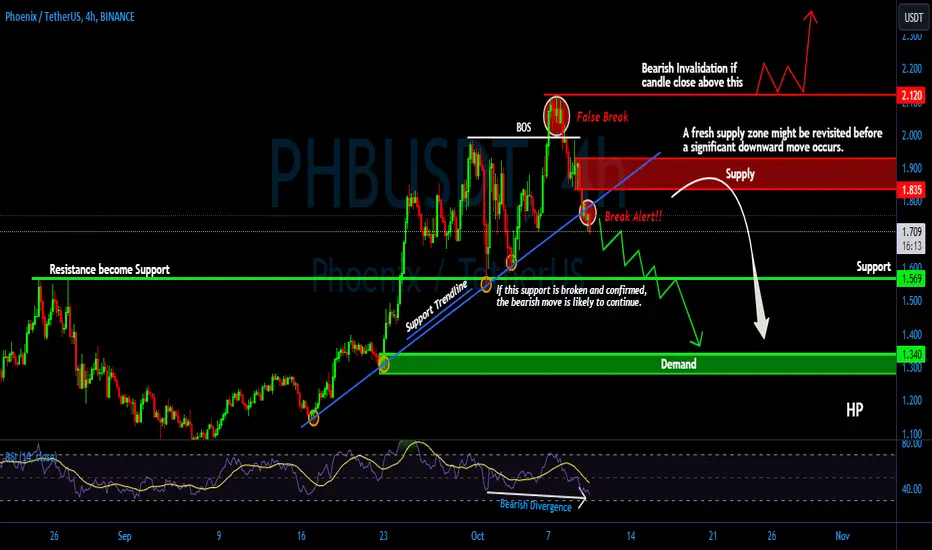
PHB Breakdown Alert! Bearish Move Confirmed — Will We Hit $1.34?Yello, Paradisers! Are we about to see a deeper plunge for #PHBUSDT? Let’s dive into the details!
💎#PHB has confirmed a shift to a bearish outlook after breaking down its crucial support trendline. Right now, our immediate target is the $1.57 support area. If the price breaks below this level, the bearish continuation will likely accelerate, increasing the probability of reaching our final target in the $1.34 demand zone.
💎If Bitcoin shows strength and rebounds, PHB could see a temporary relief rally, potentially testing the fresh supply zone at $1.83 - $1.93 before resuming any significant downward movement.
💎Bearish invalidation occurs if PHB closes above $2.12—this would signal a continuation of the upward momentum and make any short positions invalid.
Remember, it’s all about timing the market at the right levels for maximum gains.
MyCryptoParadise
iFeel the success🌴
PHB/USDT Breakout IdeaPHB/USDT has confirmed a breakout on the daily timeframe. This technical movement suggests that we could see a strong bullish trend in the coming days. Traders should watch for key support and resistance levels as this momentum develops. Remember, this is not financial advice; always do your own research (DYOR) before making any investment decisions.

#PHB/USDT#PHB
On the 4-hour frame, we have a bullish channel within which the price is trading
We have strong support that the price is committed to bouncing from
Entry price is 0.0900
The first target is 0.0944
The second goal is 0.09963
The third target is 1.0545

PHB Plan Breakout Confirmed as seen on the chart. Expecting a good bullish move soon 🐂
Anticipating a 40-80% bullish move in the short term 📈🚀
Dyor
PHB/USDT Keep an eye!! Success Reclaimed back and Bullish Moment💎 PHB has recently experienced significant market dynamics. Currently, PHB has successfully reclaimed the price above the previous resistance area, which has now turned into a support level.
💎 The current phase involves retesting this support for a potential continuation of the upward movement, with the price probability resuming its climb toward the strong resistance area.
💎 However, if PHB fails to bounce from this support level, it could indicate a false breakout scenario. In such a case, the price would likely retreat back downwards, possibly towards the demand area.
💎 The demand area holds critical importance as it signifies a key level of support. A bounce from this area would be necessary to maintain the upward momentum. However, if PHB breaks below the demand area, it could signal a bearish momentum shift, with the price potentially falling towards the strong support area.

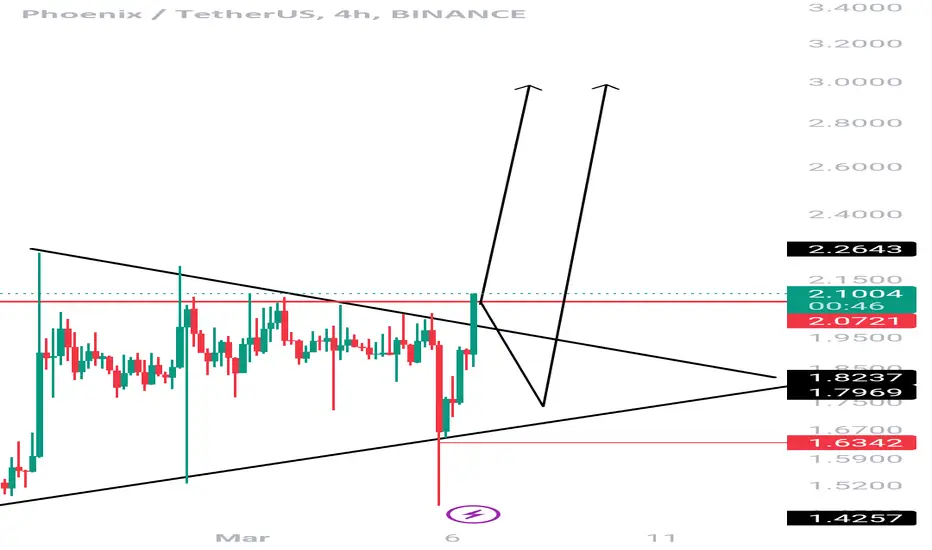
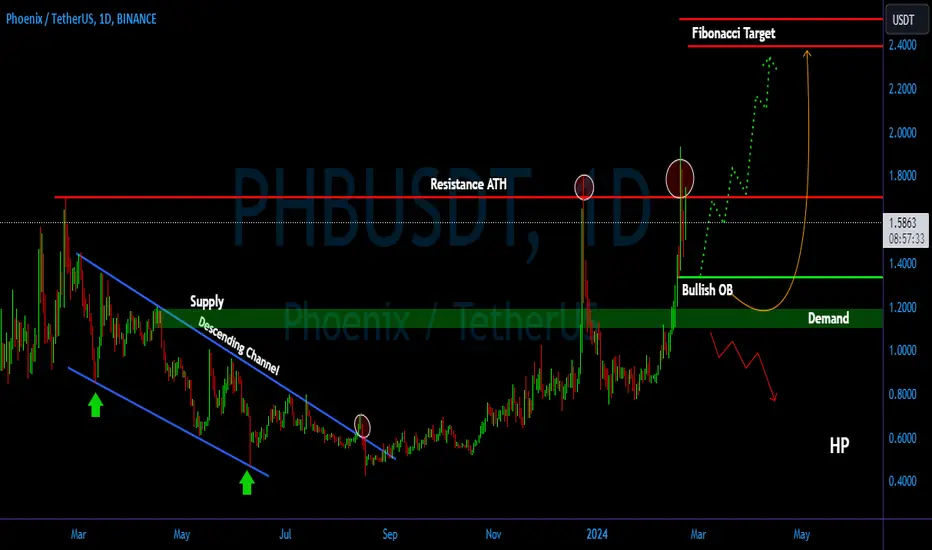
PHB/USDT Bullish Momentum for PHB if the break is successful.💎 PHB has recently faced significant market dynamics, encountering a strong rejection at the resistance of its all-time high.
💎 There's potential for the price to undergo a downward retracement, testing the Bullish OB (Order Block) area to establish new momentum for another attempt at breaking out. If the breakout occurs without a retest of the OB area, it probability could signal a move toward our target area.
💎 During the retest of the Bullish OB area, PHB must bounce off this level and resume its upward trajectory to attempt another breakout above the resistance.
💎 However, if PHB fails to bounce and instead breaks down below the Bullish OB, it may indicate a shift towards a more bearish sentiment, leading the price downwards towards the demand area.
💎 The demand area serves as a critical support zone, and its breach could signify a significant downturn for PHB. Therefore, PHB needs to bounce off this level to maintain its bullish momentum. Failure to do so may lead to further downward movement for PHB.
PHB/USDT Showing Promising SignsPHB, the PHB/USDT trading pair, is demonstrating strong potential for a breakout, particularly with the trendline resistance in sight. Although this is not financial advice, an anticipated breakout could result in a bullish move ranging from 40% to 80%. Stay informed and monitor the market closely for any significant price movements.

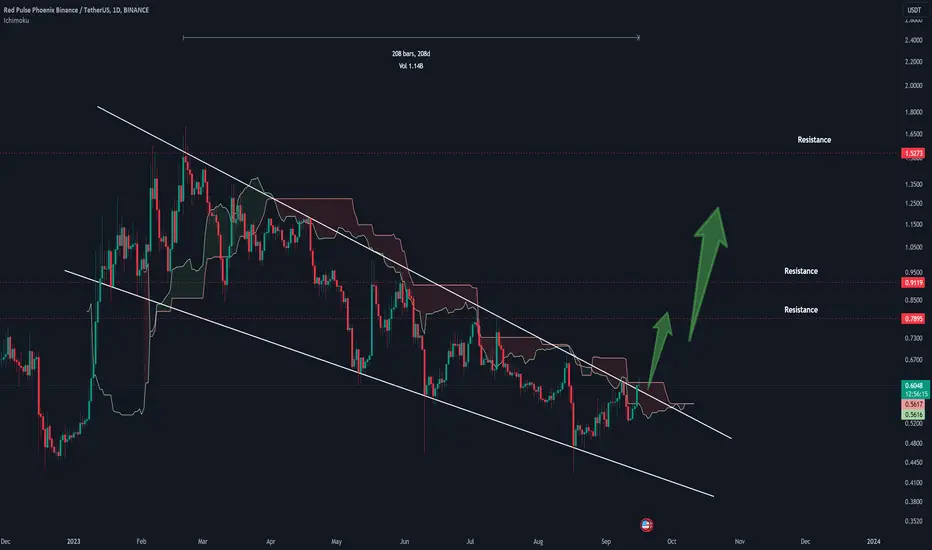
PHB: breakout this falling wedge pattern!Hi guys, This is CryptoMojo, One of the most active trading view authors and fastest-growing communities.
Consider following me for the latest updates and Long /Short calls on almost every exchange.
I post short mid and long-term trade setups too.
Let’s get to the chart!
I have tried my best to bring the best possible outcome to this chart, Do not consider financial advice.
#PHB/USDT
After a long time, PHB breaks this 208D-long Falling wedge pattern in the 1D time frame.
But we still need a retest of this pattern to conform this pattern.
IMO, it looks good to buy in a spot with a SL if any candle closes below the upper support of this pattern.
If everything goes well, we can expect a good return in the upcoming bull run.
This chart is likely to help you make better trade decisions if it does consider upvoting it.
I would also love to know your charts and views in the comment section.
Thank you
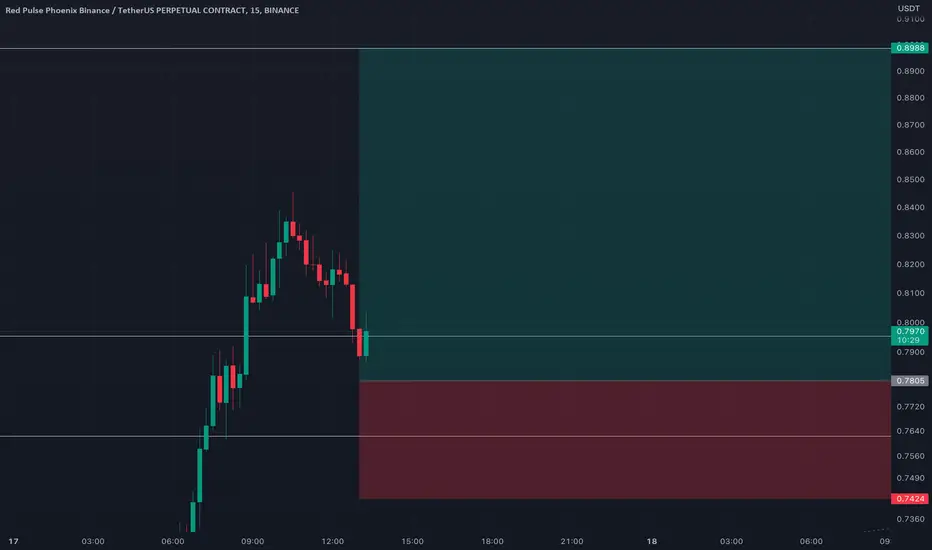
PHB is going to PUMP and I like itPhb breakout on the 1 hr, retest trendline multiple times. Tp at 0.85, 0.88 0.90
My Entry 0.77

PHB Quick 15% profit scalp (Long)Even though bitcoin is falling PHB is in AIL mode and every close and every pullback is a buy opportunity.
NFA