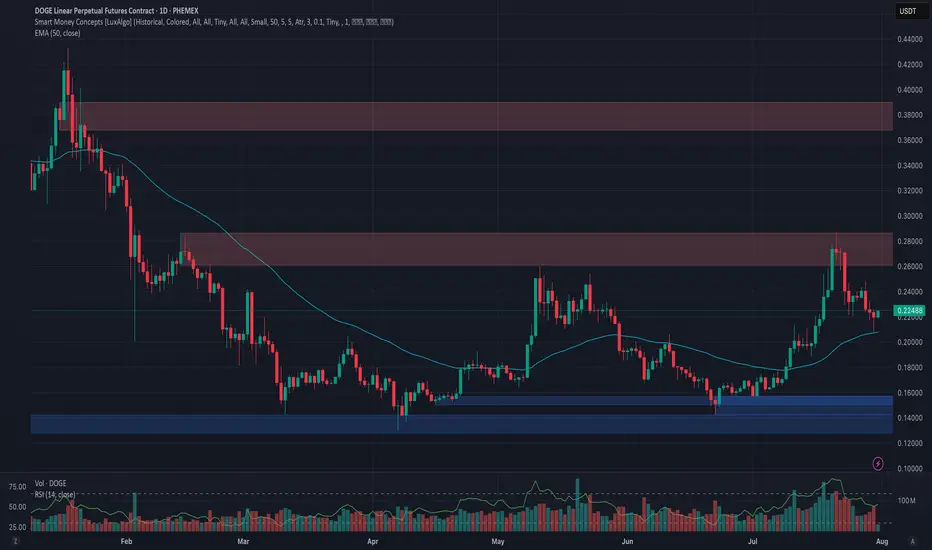
Phemex Analysis #101: Is Dogecoin (DOGE) Ready to Moon Again?Dogecoin ( PHEMEX:DOGEUSDT.P ), the original meme cryptocurrency, is once again capturing investor attention, fueled by impressive bullish movements. Currently trading around $0.2245, DOGE surged approximately 70% in July, decisively breaking the key resistance at $0.22 and challenging the next resistance level near $0.28.
With whale accumulation intensifying, renewed retail investor enthusiasm, and heightened speculation surrounding possible ETF approvals, Dogecoin appears poised to potentially sustain or even amplify its recent gains. But the key question remains: is DOGE truly ready to moon again, or is caution necessary following such rapid price movement?
Let’s carefully explore a few potential scenarios to inform your trading strategies:
Possible Scenarios
1. Bullish Continuation—Targeting Higher Levels
After successfully breaking above the crucial $0.22 resistance, Dogecoin could maintain its upward momentum if buying pressure remains strong. In this bullish scenario, DOGE might swiftly retest the immediate resistance at $0.25, then target higher levels near $0.28, and potentially surge toward the significant resistance at $0.39.
Pro Tips:
Entry Signals: Watch for a confirmed breakout above $0.25, especially if accompanied by rising trading volume, as a potential bullish entry point.
Profit-Taking: Strategically secure partial profits at resistance zones around $0.28 and $0.39.
Risk Management: Implement tight stop-loss orders just below the key support at $0.20 to guard against unexpected reversals.
2. Retest and Accumulation—Neutral Scenario
Given DOGE’s rapid price rise, a short-term pullback towards previous resistance-turned-support at $0.22 or even $0.20 is plausible. Such retracements, particularly on decreasing volume, might signal healthy consolidation, setting the stage for future bullish momentum.
Pro Tips:
Buying Opportunities: Look to accumulate DOGE if a low-volume pullback occurs toward support zones around $0.22 or $0.20.
Monitor Volume: Observe closely for decreasing trading volume during retracements, which typically indicates positive consolidation rather than a bearish reversal.
3. Bearish Scenario—Deeper Correction Possible
Should overall market sentiment shift negatively or DOGE fail to hold crucial support at $0.22, bearish pressure could escalate, potentially pushing Dogecoin down to deeper support levels around $0.198, and possibly as low as $0.15 or $0.13.
Pro Tips:
Risk Management: Consider reducing or exiting positions if DOGE decisively breaks below $0.22 on increased selling volume.
Long-Term Accumulation: Long-term holders may strategically accumulate DOGE at historically strong support levels ($0.15 or $0.13) once price stabilization occurs.
Conclusion
Dogecoin (DOGE) stands at a pivotal point, balancing bullish enthusiasm against the possibility of a correction. Traders should carefully monitor resistance at $0.25, the critical support at $0.22, and closely observe volume dynamics. By strategically aligning their trades with these outlined scenarios and employing disciplined risk management, traders can confidently navigate DOGE’s volatility and potentially capitalize on its next significant move.
🔥 Tips:
Armed Your Trading Arsenal with advanced tools like multiple watchlists, basket orders, and real-time strategy adjustments at Phemex. Our USDT-based scaled orders give you precise control over your risk, while iceberg orders provide stealthy execution.
Disclaimer: This is NOT financial or investment advice. Please conduct your own research (DYOR). Phemex is not responsible, directly or indirectly, for any damage or loss incurred or claimed to be caused by or in association with the use of or reliance on any content, goods, or services mentioned in this article.
Phemexanalysis
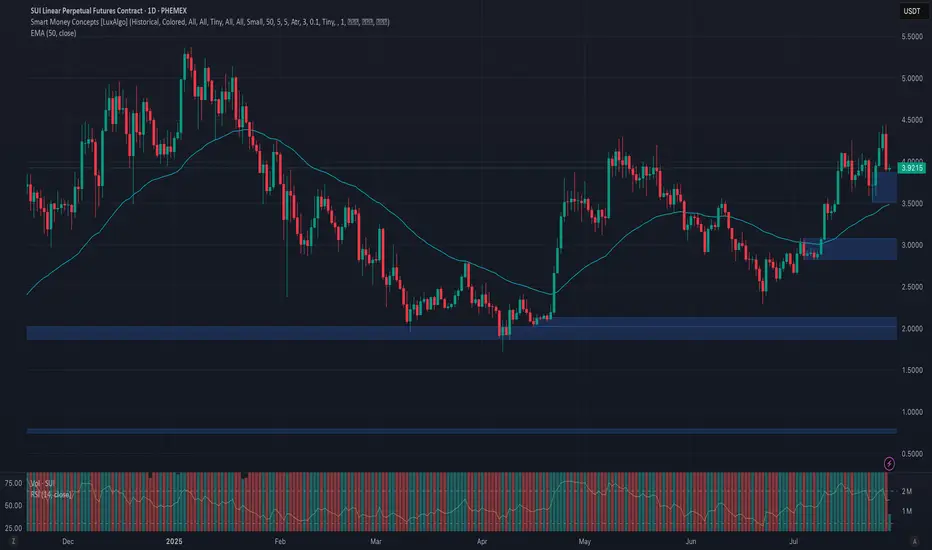
Phemex Analysis #100: Pro Tips for Trading Sui (SUI)Sui ( PHEMEX:SUIUSDT.P ) has swiftly emerged as one of the most promising Layer 1 blockchains, well-known for its focus on scalability, high throughput, and developer-friendly infrastructure. Recently, Sui has attracted significant attention thanks to its growing DeFi ecosystem, strategic partnerships, and community enthusiasm.
Over the past 2 weeks, SUI showed robust bullish activity, rising more than 30% to break key resistance around $4.3, and it’s now trading at around $3.9. The current price action indicates a potential continuation of bullish momentum, yet traders remain cautious about possible retracements and volatility.
Let’s carefully examine a few likely scenarios for SUI and determine how traders can capitalize strategically.
Possible Scenarios
1. Short-term Retracement (Healthy Pullback)
Following the recent rapid price rise, SUI might experience a short-term correction toward previous resistance-turned-support near $3.6. A low-volume retracement to this level could represent a healthy pause before the next bullish leg.
Pro Tips:
Buying the Dip: Closely watch support around $3.6; a successful retest on lower volume could present an ideal buying opportunity.
Volume Monitoring: Pay close attention to volume levels during the pullback—a low-volume dip indicates healthy profit-taking rather than bearish reversal.
2. Bullish Breakout (Pushing Higher!)
If SUI maintains bullish momentum and successfully holds above recent support around $3.8, it may continue to target higher resistance levels. Strong buying volume accompanying further gains could send SUI towards key resistance zones around $5.0 and potentially breaking previous all-time-high $5.37.
Pro Tips:
Entry Signals: Consider buying positions on a high-volume breakout confirmation above $4.45, signaling bullish continuation.
Profit Targets: Plan partial profit-taking around $5.0 and $5.37 resistance zones to lock in gains.
3. Bearish Scenario (Deeper Correction)
If broader market sentiment turns negative or if buying volume significantly weakens, SUI could break below $3.6, signaling bearish pressure. In this scenario, deeper corrections towards support levels at $2.8 or potentially $2.3 may occur.
Pro Tips:
Short Opportunities: Experienced traders could consider shorting or reducing exposure if SUI decisively breaks below the key $3.6 support level on increased selling volume.
Accumulation Strategy: Long-term investors can strategically accumulate positions near stronger support zones around $2.8 and $2.3 after confirming price stabilization.
Conclusion
Sui (SUI) currently offers compelling trading opportunities driven by recent bullish activity and increasing ecosystem growth. Traders should stay alert for critical breakout levels ($4.45) and monitor essential support areas ($3.6) closely. By applying disciplined trading approaches, setting clear profit targets, and managing risk prudently, traders can navigate SUI’s volatility with greater confidence and potentially maximize gains.
🔥 Tips:
Armed Your Trading Arsenal with advanced tools like multiple watchlists, basket orders, and real-time strategy adjustments at Phemex. Our USDT-based scaled orders give you precise control over your risk, while iceberg orders provide stealthy execution.
Disclaimer: This is NOT financial or investment advice. Please conduct your own research (DYOR). Phemex is not responsible, directly or indirectly, for any damage or loss incurred or claimed to be caused by or in association with the use of or reliance on any content, goods, or services mentioned in this article.
Phemex Analysis #99: PENGU Explodes 480%!Will the Hype Continue?Pudgy Penguins (PENGU), a playful and increasingly popular meme coin, has recently made waves in the crypto market due to its rapid price movements and strong community support. Originally inspired by the beloved Pudgy Penguins NFT collection, PENGU has rapidly transitioned from niche interest to broader market phenomenon.
In recent trading, PENGU surged impressively by nearly 480%, primarily fueled by major exchange listings and growing influencer endorsements. Currently trading around $0.041, PENGU has caught the attention of both meme-coin enthusiasts and seasoned crypto traders, sparking debates over its next big move.
With significant market attention and notable volatility, traders now face an essential question: Is PENGU poised for further explosive growth, or should traders brace for a potential pullback? Let's carefully evaluate several likely scenarios.
Possible Scenarios
1. Bullish Breakout (Continuing the Hype!)
PENGU’s recent price action suggests bullish momentum may persist, especially if the community-driven hype continues. A decisive breakout above recent resistance at $0.046—particularly if supported by increasing trading volumes—could accelerate the bullish trend, targeting next levels at $0.05 and possibly the psychological level of $0.08.
Pro Tips:
Entry Strategy: Consider entering positions only after confirmation of a high-volume breakout above $0.046.
Profit-Taking Targets: Plan partial profit-taking around next key resistance zones at $0.05 and $0.08 to manage risk effectively.
Risk Management: Set tight stop-losses just below recent support levels around $0.035.
2. Short-Term Correction (Healthy Retracement)
Given PENGU’s recent rapid rise, a short-term retracement to retest support levels around $0.035 or lower ($0.03) is likely. If this pullback happens on low volume, it could indicate a healthy consolidation rather than a full trend reversal.
Pro Tips:
Buying the Dip: Closely watch support at $0.035 and $0.03; a low-volume test of these levels might provide excellent entry points for traders who missed earlier rallies.
Volume Monitoring: Ensure low-volume retracements—high volume during declines might signal deeper bearish pressure.
3. Bearish Reversal (The Hype Fades)
As is typical with volatile meme coins, sudden reversals can occur if market sentiment swiftly changes. A high-volume drop below critical support around $0.035 could trigger more significant bearish sentiment, potentially targeting deeper support around $0.022 or even $0.0135.
Pro Tips:
Caution on Reversal Signals: Consider exiting or reducing positions if PENGU decisively breaks below key support levels with strong selling volume.
Accumulation Opportunities: Long-term believers might use significant pullbacks toward $0.022 or $0.0135 as strategic accumulation opportunities after price stabilization occurs.
Conclusion
Pudgy Penguins (PENGU) currently sits at an intriguing juncture, offering traders both opportunities and risks. Traders should carefully watch the outlined scenarios, particularly breakout signals above $0.046 and support levels around $0.035 and $0.03. Through disciplined entry and exit strategies, attentive volume analysis, and vigilant risk management, traders can navigate PENGU’s volatility and potentially profit from its next big move.
🔥 Tips:
Armed Your Trading Arsenal with advanced tools like multiple watchlists, basket orders, and real-time strategy adjustments at Phemex. Our USDT-based scaled orders give you precise control over your risk, while iceberg orders provide stealthy execution.
Disclaimer: This is NOT financial or investment advice. Please conduct your own research (DYOR). Phemex is not responsible, directly or indirectly, for any damage or loss incurred or claimed to be caused by or in association with the use of or reliance on any content, goods, or services mentioned in this article.

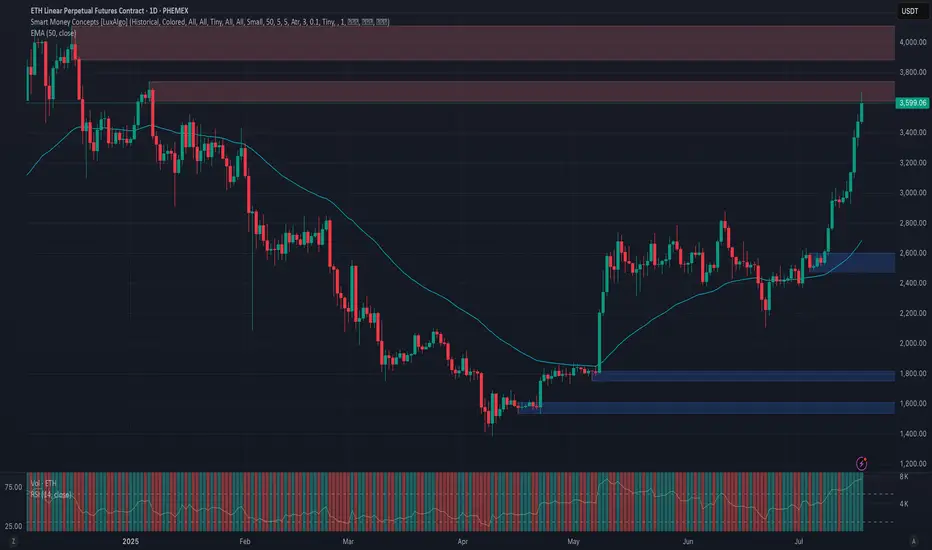
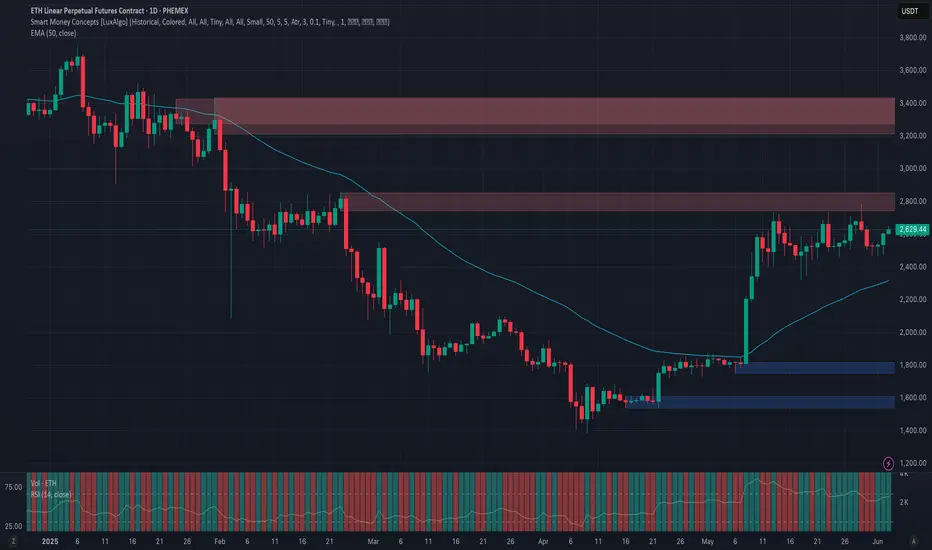
Phemex Analysis #98: ETH Price Explodes— Is $5,000 Finally Next?Ethereum ( PHEMEX:ETHUSDT.P ) has recently shown impressive strength, surging past significant resistance levels and stirring excitement in the crypto market. After an extended consolidation, ETH decisively broke through the crucial $3,300 resistance level, rallying more than 15% in just three days, and is now trading confidently around $3,500.
This renewed bullish momentum has traders and investors eagerly speculating: Could this be the start of Ethereum's next major run? Or should caution prevail amid ongoing market uncertainty? To help navigate this critical period, let's explore several key trading scenarios.
Possible Scenarios
1. Bullish Continuation – Targeting New Highs
Ethereum’s recent breakout above the $3,300 resistance signals strong bullish sentiment. If buying volume continues increasing, ETH could swiftly move towards higher resistance levels at $3,800 and potentially challenge the psychological milestone of $4,100.
Pro Tips:
Profit Targets: Consider locking in partial profits as ETH approaches strong resistance zones around $3,800 and $4,100.
Risk Management: Place tight stop-loss orders on recent lows, approximately around $2,902 to minimize downside risks.
2. Short-term Retracement – Healthy Pullback
Given ETH’s rapid surge, a short-term pullback to retest the recently broken resistance zone at $3,300 to $3,000 (now acting as strong support zone) is plausible. A successful retest would strengthen the bullish case, signaling healthy consolidation before further upward momentum.
Pro Tips:
Buying the Dip: If ETH holds above $3,000 with declining volume, consider cautiously adding to your positions or initiating new longs.
Volume Confirmation: Closely watch trading volume; lower volume during pullbacks typically indicates a healthy retracement rather than a bearish reversal.
3. Bearish Reversal – Breaking Below Critical Support
If Ethereum’s price experiences heavy selling pressure and breaks below the key support at $3,000, bearish sentiment could escalate, potentially driving ETH towards lower support levels near $2,470 and possibly even $2,110.
Pro Tips:
Short Positions: Experienced traders might consider initiating short positions if ETH decisively breaks below the crucial $3,000 support zone on increasing selling volume.
Long-term Accumulation: Long-term investors may strategically accumulate ETH near stronger support areas at $2,470 and $2,110, after clear signs of price stabilization.
Conclusion
Ethereum (ETH) currently offers attractive opportunities, propelled by recent bullish momentum yet balanced by market uncertainties. Traders must closely observe key resistance at $4,000, critical support around $3,000, and carefully analyze trading volumes for confirmation of market direction. By maintaining disciplined risk management and strategically capitalizing on outlined scenarios, investors can effectively navigate ETH’s price action in the weeks ahead.
🔥 Tips:
Armed Your Trading Arsenal with advanced tools like multiple watchlists, basket orders, and real-time strategy adjustments at Phemex. Our USDT-based scaled orders give you precise control over your risk, while iceberg orders provide stealthy execution.
Disclaimer: This is NOT financial or investment advice. Please conduct your own research (DYOR). Phemex is not responsible, directly or indirectly, for any damage or loss incurred or claimed to be caused by or in association with the use of or reliance on any content, goods, or services mentioned in this article.
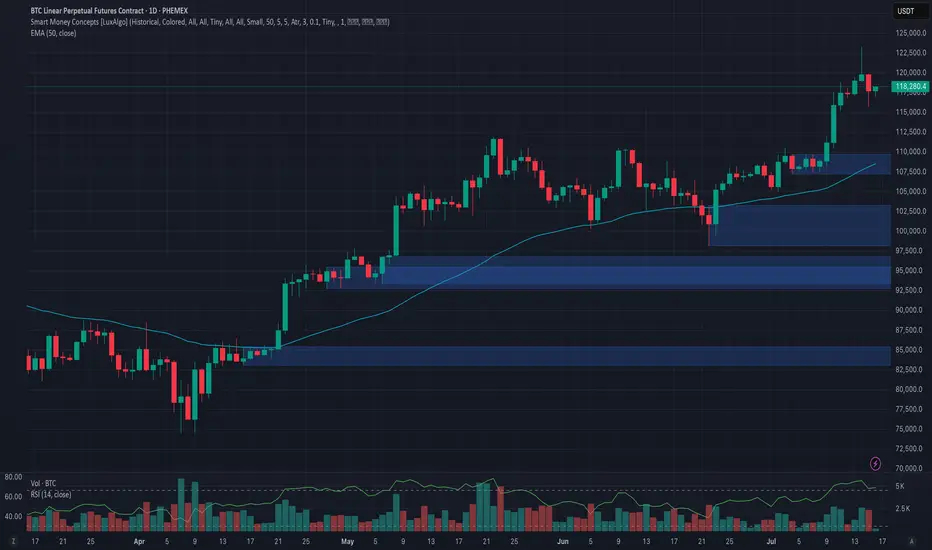
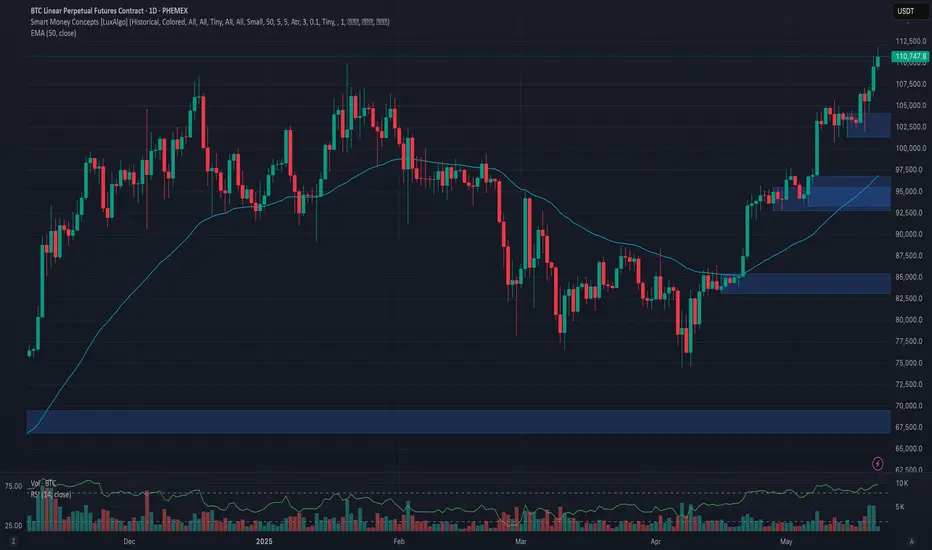
Phemex Analysis #97: What's Next for Bitcoin, After $123k?!Bitcoin ( PHEMEX:BTCUSDT.P ) recently made history by hitting an all-time high of $123,251 on July 14, 2025. However, enthusiasm was quickly tempered as BTC retraced by approximately 6%, dropping sharply to around $115,696 on July 15. Currently, the price has partially recovered and is trading at about $118,200.
With the market sentiment at a pivotal juncture following this volatile movement, traders and investors are carefully considering their next steps. Let's dive into several possible scenarios that might unfold in the coming days.
Possible Scenarios
1. Bullish Continuation (Breakout Above $123k)
If Bitcoin quickly regains bullish momentum, it may retest and surpass its recent high at $123,251. Breaking decisively above this resistance could trigger another strong rally, driven by renewed market optimism and potential institutional inflows.
Pro Tips:
Entry Strategy: Look to open or add to existing positions upon confirmation of a clear breakout above $123,251, especially if accompanied by high trading volume.
Profit Targets: Key resistance zones for profit-taking after a breakout include psychological levels at $128,000, and the significant milestone at $130,000.
Risk Management: Use protective stop-loss orders placed below the recent low around $115,000 to manage downside risks effectively.
2. Extended Consolidation (Range-Bound Scenario)
Bitcoin could enter a period of price consolidation, fluctuating between support at approximately $115,000 and resistance near $123,000. This scenario often occurs when the market awaits clearer directional cues.
Pro Tips:
Range Trading: Employ a grid-trading strategy, placing buy orders near support ($115,000–$116,000) and sell orders around resistance ($122,000–$123,000) to maximize profits from short-term volatility.
Monitoring Indicators: Keep an eye on declining trading volume, which often signals the potential for an upcoming breakout or breakdown.
3. Bearish Pullback (Correction Scenario)
Given the rapid recent surge to all-time highs, a deeper market correction remains possible. If BTC decisively breaks below support at $115,000 with strong selling pressure, further declines towards $107,218 or even $98,132 could ensue, especially if accompanied by negative broader market sentiment.
Pro Tips:
Short Opportunities: Experienced traders might explore short positions if BTC convincingly breaks below the $115,000 support level.
Accumulation Strategy: Long-term investors can strategically accumulate positions around significant lower support levels such as $107,218 and $98,132, provided price stabilization signals are evident.
Conclusion
Bitcoin is currently at a crucial technical and psychological level after hitting its latest all-time high. Traders should closely monitor the outlined scenarios—particularly watching key resistance at $123,251 and essential support at $115,000. By utilizing disciplined risk management, proactive profit-taking strategies, and careful market analysis, investors can effectively navigate BTC’s ongoing volatility and strategically position themselves for the next significant move.
🔥 Tips:
Armed Your Trading Arsenal with advanced tools like multiple watchlists, basket orders, and real-time strategy adjustments at Phemex. Our USDT-based scaled orders give you precise control over your risk, while iceberg orders provide stealthy execution.
Disclaimer: This is NOT financial or investment advice. Please conduct your own research (DYOR). Phemex is not responsible, directly or indirectly, for any damage or loss incurred or claimed to be caused by or in association with the use of or reliance on any content, goods, or services mentioned in this article.
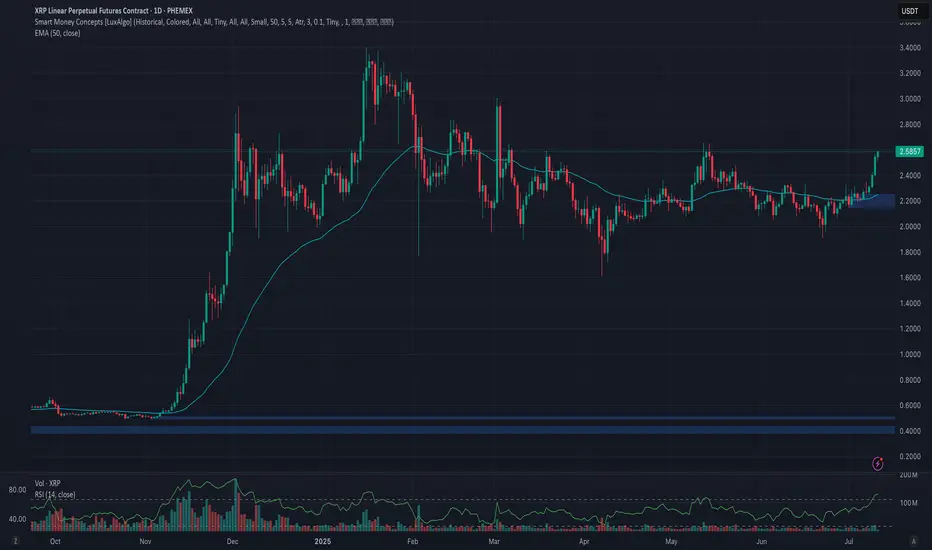
Phemex Analysis #96: Pro Tips for Trading Ripple (XRP)Since our previous analysis on XRP , Ripple’s native token [ PHEMEX:XRPUSDT.P ] successfully broke above the significant $2.45 resistance level, subsequently establishing a higher low around $1.90 on June 22nd. Encouragingly, XRP has surged 10% over the past two days, once again decisively breaking the $2.45 barrier, and is currently trading at around $2.57.
Given XRP’s recent bullish performance and evolving market dynamics, let's explore several potential scenarios that traders should closely monitor.
Possible Scenarios
1. Continued Bullish Momentum (Breakout Scenario)
If XRP maintains its current bullish strength, it’s likely to break above its recent high at $2.65. Such a breakout would signal strong buying interest and may push the price further toward the resistance zones at $2.96 and $3.12.
Pro Tips:
Entry Strategy: Consider entering or scaling positions upon confirmation of a breakout above $2.65, supported by increased trading volume.
Profit-Taking: Strategically take partial profits as XRP approaches the next resistance levels at $2.96 and especially $3.12 to secure gains effectively.
2. Rejected by Strong Resistance Levels (Pullback Scenario)
While the recent rally is promising, broader market conditions currently exhibit limited bullish momentum, indicating caution. XRP may face strong selling pressure at resistance levels like $3.12, leading to a potential price rejection.
In this scenario, XRP could retreat to establish a higher low above the important support at $2.15.
Pro Tips:
Buying Opportunities: Long-term investors might consider gradually accumulating positions if XRP forms a confirmed higher low above the critical support zone around $2.15.
Patience: Wait for clear stabilization signs at support before increasing positions, rather than rushing entries during active retracements.
3. Consolidation within Defined Range (Neutral Scenario)
XRP might enter a period of price consolidation, oscillating between support at $1.91 and resistance at $2.65. This scenario is common when market sentiment is uncertain or awaiting clearer directional cues.
Pro Tips:
Grid Trading Strategy: Utilize grid trading bots to profit systematically from predictable range-bound price movements. Initiate Long Grid bots near support at $1.91 and Short Grid bots near resistance around $2.65.
Stop-Loss: Always set clear stop-losses outside the consolidation range, ensuring protection against unexpected breakouts or breakdowns.
Conclusion
Ripple (XRP) currently offers compelling trade opportunities across different market scenarios. By closely monitoring bullish breakout signals above $2.65, potential pullbacks toward $2.15, and consolidation opportunities within $1.91–$2.65, traders can strategically position themselves to capitalize effectively while managing risks prudently. Always maintain a disciplined approach, pay close attention to broader market trends, and carefully execute trades based on well-defined scenarios.
🔥 Tips:
Armed Your Trading Arsenal with advanced tools like multiple watchlists, basket orders, and real-time strategy adjustments at Phemex. Our USDT-based scaled orders give you precise control over your risk, while iceberg orders provide stealthy execution.
Disclaimer: This is NOT financial or investment advice. Please conduct your own research (DYOR). Phemex is not responsible, directly or indirectly, for any damage or loss incurred or claimed to be caused by or in association with the use of or reliance on any content, goods, or services mentioned in this article.
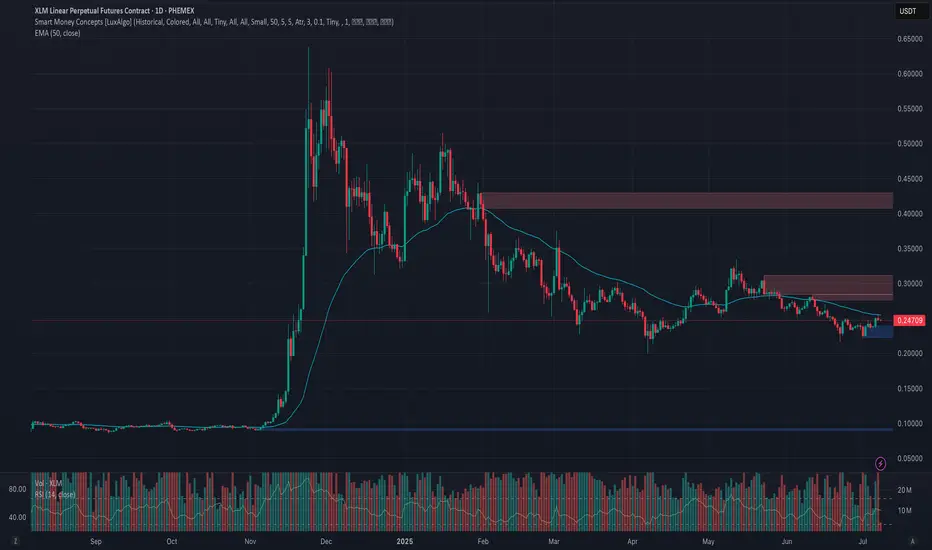
Phemex Analysis #95: Pro Tips for Trading Stellar (XLM)Stellar ( PHEMEX:XLMUSDT.P ) is an open-source, decentralized blockchain platform specializing in fast, affordable cross-border transactions aimed at enhancing global financial inclusion. Its native cryptocurrency, Lumens (XLM), serves as a bridge for currency exchanges and is used to pay transaction fees on the network. Founded in 2014 by Jed McCaleb, Stellar connects banks, payment systems, and individuals worldwide, providing seamless and cost-effective financial interactions.
Recently, Stellar has shown positive market momentum, including a notable 5% price surge coupled with increased transaction volumes. A key catalyst for this optimism is PayPal’s upcoming integration of its stablecoin PYUSD onto the Stellar blockchain, significantly expanding Stellar's real-world use case and accessibility across more than 170 countries.
Given these promising developments, let’s explore several possible trading scenarios to help traders strategically approach XLM.
Possible Scenarios
1. Breakout Rise to $0.28 and Above (Bullish Scenario)
On the daily chart, XLM recently formed a clear "cup and handle" pattern, with the handle emerging around June 22. This classic bullish indicator signals accumulation of buying momentum. If XLM decisively breaks out above the critical resistance level at $0.257, particularly with strong trading volume, it could confirm a bullish continuation, potentially targeting resistance zones around $0.28, $0.312, and even the significant resistance at $0.43.
Pro Tips:
Entry Point: Consider entering positions after confirming the breakout above $0.257, ideally with significant volume confirmation.
Profit-Taking Levels: Aim to take partial profits at key resistance levels: $0.28, $0.312, and $0.43.
2. Rejection by Key Resistance Levels (Neutral Scenario)
While the immediate resistance at $0.28 is relatively weak and likely to be overcome easily, subsequent resistance at $0.312 and particularly at $0.43 could present strong selling pressure, potentially rejecting XLM’s first attempt.
If rejection occurs, the price will likely retrace to retest support zones, such as around $0.25, consolidating before attempting another bullish move.
Pro Tips:
Cautious Entries: If initial rejections occur at higher resistance zones ($0.312 or $0.43), consider waiting for price stabilization around lower support areas ($0.25) before re-entering.
Volume Check: Closely monitor trading volumes during retracements—declining volume often indicates a healthy pullback rather than a significant reversal.
3. All Things Go South (Bearish Scenario)
If broader market sentiment suddenly turns sharply negative—particularly driven by a significant decline in Bitcoin—XLM could face substantial selling pressure. A sharp drop below key support at $0.216 with high volume, accompanied by broader market downturns, would signal serious bearish momentum.
Pro Tips:
Market Observation: Stay cautious and consider stepping aside until clear stabilization occurs at lower support levels.
Accumulation Opportunities: Long-term holders should watch closely for stabilization at critical historical supports, including $0.20, $0.18, $0.12, and $0.09, which could offer attractive entry points for gradual accumulation.
Conclusion
Stellar (XLM) currently stands at a pivotal juncture driven by significant fundamental catalysts and compelling technical signals. By closely monitoring the outlined bullish, neutral, and bearish scenarios, traders can strategically position themselves for profitable trades while effectively managing risks. Always remain alert, employ disciplined risk management strategies, and stay informed on broader market movements to successfully navigate XLM’s market dynamics.
🔥 Tips:
Armed Your Trading Arsenal with advanced tools like multiple watchlists, basket orders, and real-time strategy adjustments at Phemex. Our USDT-based scaled orders give you precise control over your risk, while iceberg orders provide stealthy execution.
Disclaimer: This is NOT financial or investment advice. Please conduct your own research (DYOR). Phemex is not responsible, directly or indirectly, for any damage or loss incurred or claimed to be caused by or in association with the use of or reliance on any content, goods, or services mentioned in this article.
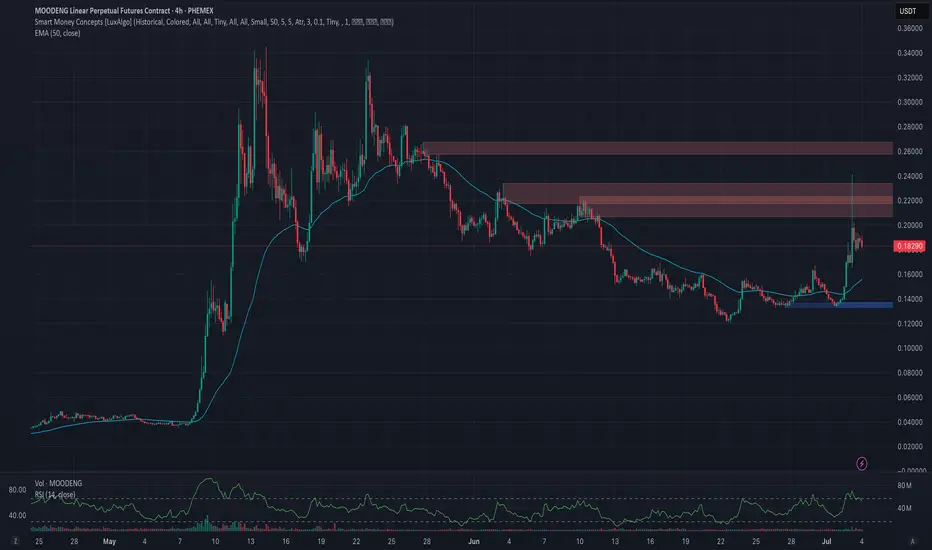
Phemex Analysis #94: Pro Tips for Trading MooDeng (MOODENG)MooDeng ( PHEMEX:MOODENGUSDT.P ) is a playful, Solana-based meme coin inspired by a charming pygmy hippopotamus born at Thailand’s Khao Kheow Zoo. Since its debut in 2024, MOODENG has quickly captured crypto enthusiasts' imaginations, gaining prominence through explosive price surges and a rapidly growing community.
Recently, MooDeng’s market presence surged dramatically following its listing on Upbit, one of South Korea’s largest cryptocurrency exchanges. Upbit added trading pairs with KRW, BTC, and USDT, leading MOODENG’s price to spike by over 70%, while liquidity and trading volume increased by a staggering 600%, elevating its market capitalization beyond $200 million.
This newfound liquidity and heightened market attention bring exciting yet challenging trading conditions. To navigate these effectively, let’s explore several scenarios that traders should consider in the near term.
Possible Scenarios
1. Bullish Continuation (Extended Rally)
The recent Upbit listing provided significant bullish momentum, which might continue propelling MOODENG’s price upward. If buying pressure remains strong and price confidently holds above immediate support $0.165, the rally could extend toward higher resistance levels.
Pro Tips:
Monitor Key Resistance Levels: Keep an eye on critical short-term resistance zones $0.234 and $0.2676. Consider partial profit-taking at these levels to safeguard gains.
Entry and Risk Management: Look for price consolidations or small retracements as potential entry points. Always set stop-losses below recent support areas to minimize downside risk.
2. Price Consolidation (Sideways Movement)
After substantial upward movement, MooDeng might enter a period of consolidation as the market absorbs recent gains. Consolidation typically involves price fluctuating within a defined range, testing support $0.165 and resistance $0.206 repeatedly before the next significant move.
Pro Tips:
Range Trading: Implement range-trading strategies by identifying clear support and resistance levels, taking advantage of repeated price movements within these bounds.
Volume Analysis: Carefully observe trading volumes during consolidation phases. Declining volumes typically indicate a healthy pause before a potential next leg upward or downward breakout.
3. Bearish Correction (Pullback Scenario)
Following significant rallies, sharp pullbacks can occur as traders take profits, particularly in meme coins known for volatility. If MOODENG breaks below recent key support levels $0.165 with substantial trading volume, it might signal a bearish correction, returning the price toward lower support areas.
Pro Tips:
Identify Support Zones: Carefully monitor established support levels $0.133 or $0.12 for potential accumulation or buying opportunities. Significant pullbacks could present strategic entry points for long-term believers.
Stay Cautious: Avoid hastily entering trades during strong bearish momentum; instead, wait patiently for clear signs of price stabilization before taking new positions.
Conclusion
MooDeng’s recent explosive growth following the Upbit listing presents traders with numerous opportunities. By carefully monitoring outlined scenarios—considering bullish continuation, consolidation, and potential pullbacks—traders can effectively manage risk while capitalizing on MOODENG’s volatility. Stay disciplined, remain responsive to market dynamics, and always practice strategic risk management to maximize your trading success with MooDeng.
🔥 Tips:
Armed Your Trading Arsenal with advanced tools like multiple watchlists, basket orders, and real-time strategy adjustments at Phemex. Our USDT-based scaled orders give you precise control over your risk, while iceberg orders provide stealthy execution.
Disclaimer: This is NOT financial or investment advice. Please conduct your own research (DYOR). Phemex is not responsible, directly or indirectly, for any damage or loss incurred or claimed to be caused by or in association with the use of or reliance on any content, goods, or services mentioned in this article.
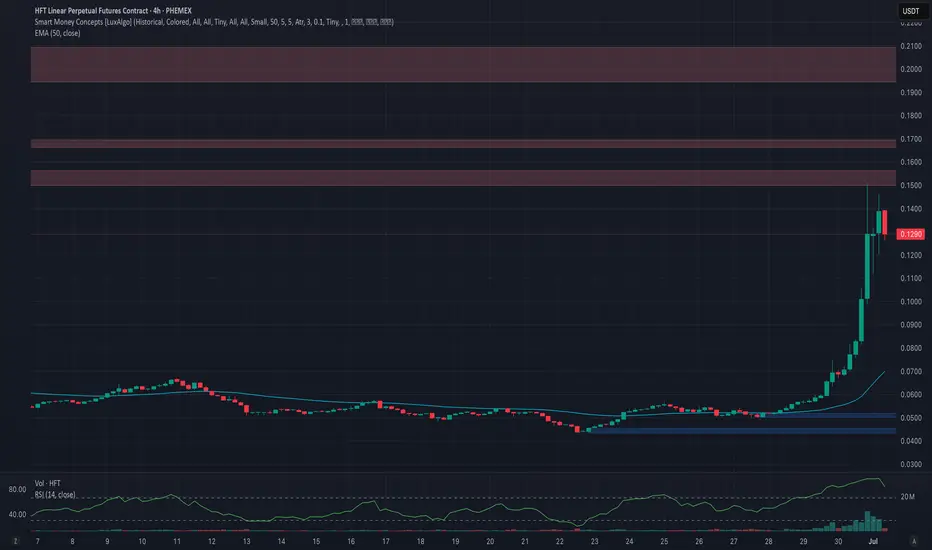
Phemex Analysis #93: Is it Time to Enter Hashflow (HFT)?Hashflow ( PHEMEX:HFTUSDT.P ) is a decentralized trading protocol designed to facilitate seamless, secure cross-chain asset swaps with zero slippage and protection against MEV (Maximal Extractable Value) exploits. Unlike traditional decentralized exchanges, Hashflow enables users to trade across various blockchains without relying on external bridges or synthetic assets. Trades execute precisely at the quoted price without hidden commissions, enhancing transparency and efficiency.
Recently, HFT experienced an impressive bullish rally, surging approximately 190% within 48 hours, currently stabilizing around the $0.12 mark. This rapid appreciation naturally raises questions among traders: is now the ideal entry point, or is caution warranted following such sharp movements? To assist traders in making informed decisions, let's examine a few potential scenarios closely.
Possible Scenarios
1. Bullish Continuation (Positive Scenario)
Currently, the HFT price faces significant resistance around $0.15. A bullish continuation scenario involves HFT consolidating briefly above the $0.10 support area, gathering strength before making another attempt at breaking through the critical $0.15 resistance.
Pro Tips:
Entry Strategy: Consider carefully entering positions only after a confirmed breakout above the resistance at $0.15, accompanied by strong volume.
Profit-Taking Targets: Short-term profit-taking levels to monitor closely are at $0.156, $0.17, and $0.21.
Risk Management: Implement a clear stop-loss strategy slightly below the $0.10 area to mitigate potential downside risk.
2. The Hype Is Over (Bearish Scenario)
Given the broader market consolidation, there's a realistic risk that recent bullish momentum may fade quickly. If the price falls decisively below the $0.10 support, this scenario could trigger further declines towards key support levels such as $0.067, or even back down to $0.05.
Pro Tips:
Stay Cautious: Traders should remain on the sidelines if prices fall below $0.10 with increased selling volume, as it could indicate a broader sell-off.
Long-Term Accumulation: For long-term investors interested in HFT, wait patiently for price stabilization at or near support areas ($0.067 and $0.05) before gradually accumulating positions.
3. Consolidation between $0.10–$0.15 (Neutral Scenario)
A third possibility involves HFT price remaining range-bound, consolidating between the immediate support at $0.10 and resistance at $0.15. Such consolidation would represent market indecision as traders and investors await further market cues.
Pro Tips:
Range Trading: Employ range-trading techniques to profit from short-term price fluctuations between these clearly defined boundaries.
Observe Breakout Signals: Closely watch volume patterns, as increased volume accompanying a breakout from either end of the range could signify the next significant directional move.
Conclusion
Hashflow (HFT) has recently demonstrated significant volatility, creating multiple opportunities and risks for traders. By closely monitoring the outlined scenarios—particularly the critical levels of $0.10 and $0.15—and employing strategic risk management, traders can confidently position themselves to optimize potential returns. Always prioritize clear confirmation of market signals and adapt your strategies according to the unfolding price action.
🔥 Tips:
Armed Your Trading Arsenal with advanced tools like multiple watchlists, basket orders, and real-time strategy adjustments at Phemex. Our USDT-based scaled orders give you precise control over your risk, while iceberg orders provide stealthy execution.
Disclaimer: This is NOT financial or investment advice. Please conduct your own research (DYOR). Phemex is not responsible, directly or indirectly, for any damage or loss incurred or claimed to be caused by or in association with the use of or reliance on any content, goods, or services mentioned in this article.
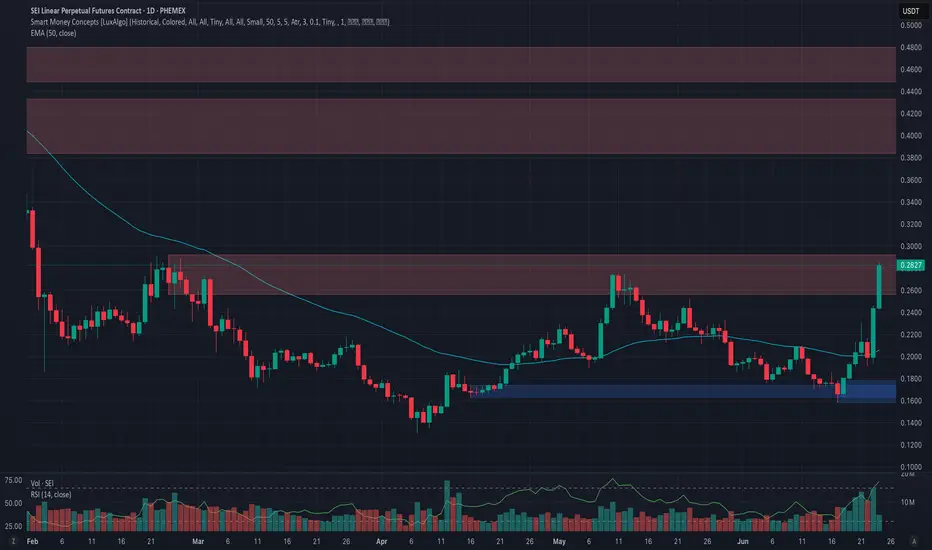
Phemex Analysis #92: Pro Tips for Trading Sei (SEI) Sei ( PHEMEX:SEIUSDT.P ) Network’s recent advancements underscore its commitment to extreme scalability, Ethereum Virtual Machine (EVM) compatibility, and streamlined user experience, all backed by strong institutional support and rapid adoption.
The recent launch of Sei V2 marks a major milestone, enhancing Sei’s performance dramatically. With this upgrade, the network now processes an impressive 5 gigagas per second, equating to approximately 200,000 transactions per second (TPS) with sub-400 millisecond finality. Such metrics position Sei among the fastest EVM-compatible blockchains globally, facilitating groundbreaking real-time applications in DeFi, AI, and trading. Improvements like the SeiDB storage layer further boost efficiency by accelerating node syncing and reducing state bloat.
Institutionally, Sei is experiencing remarkable momentum. Recently, Canary Capital filed with the US SEC for the first-ever SEI-based Exchange Traded Fund (ETF), offering regulated access to staked SEI and on-chain yields. Additionally, prominent investors like Circle Ventures, Multicoin Capital, and Delphi Digital strongly validate Sei’s potential as a high-performance Layer-1 blockchain.
These significant developments—technical excellence, streamlined ecosystem, and strong institutional backing—position Sei Network as a top-tier contender in the blockchain industry.
Possible Scenarios
1. Bullish Continuation (Further Uptrend)
Over the past two days, SEI’s price surged by more than 45%, indicating robust bullish momentum. The immediate resistance at $0.292 appears attainable if bullish strength persists.
However, traders should anticipate significant resistance at higher levels, notably at $0.43 and $0.50. Approaching these key levels, market volatility could increase substantially.
Pro Tips:
Profit-Taking: Strategically take partial profits as SEI approaches the critical resistance zones near $0.43 and subsequently $0.50.
Risk Management: Implement protective stop-loss orders just below recent support zones, such as $0.255, to manage unexpected reversals.
2. Rejection at $0.292 (Potential Retracement)
Considering the sharp recent gains in a relatively uncertain market environment, a rejection at the $0.292 resistance is plausible. Should this occur, SEI might seek support at lower levels, primarily around $0.19 and $0.158, before stabilizing.
Pro Tips:
Buy-the-Dip Strategy: Monitor the lower support levels ($0.19 and $0.158) closely. These areas might offer favorable opportunities for accumulating SEI at discounted valuations.
Volume Confirmation: Keep an eye on trading volume during pullbacks; lower volume would indicate a potentially healthy correction rather than a sustained bearish move.
3. Breakthrough $0.292 but Retrace to Accumulate Momentum (Consolidation Scenario)
Another scenario involves SEI initially breaking above $0.292, then experiencing mild pullbacks toward approximately $0.255 to consolidate momentum. In this pattern, price may gradually climb higher, with smaller upward moves interspersed by brief retracements.
Pro Tips:
Long Grid Bots: Leverage grid trading bots effectively to capture profits from the smaller price fluctuations typical in this scenario. Start long-grid bots around the support level at $0.255 and target modest incremental gains.
Patience and Adaptability: Maintain discipline, patiently letting positions unfold while continuously managing your exposure through proper stop-loss placements and profit-taking strategies.
Conclusion
Sei Network’s robust technical performance, institutional backing, and recent bullish price action provide traders with several actionable scenarios. By carefully observing the outlined resistance and support levels and employing disciplined trading strategies—including timely profit-taking, grid bot deployment, and vigilant risk management—traders can confidently navigate SEI’s volatility to optimize returns effectively.
🔥 Tips:
Armed Your Trading Arsenal with advanced tools like multiple watchlists, basket orders, and real-time strategy adjustments at Phemex. Our USDT-based scaled orders give you precise control over your risk, while iceberg orders provide stealthy execution.
Disclaimer: This is NOT financial or investment advice. Please conduct your own research (DYOR). Phemex is not responsible, directly or indirectly, for any damage or loss incurred or claimed to be caused by or in association with the use of or reliance on any content, goods, or services mentioned in this article.
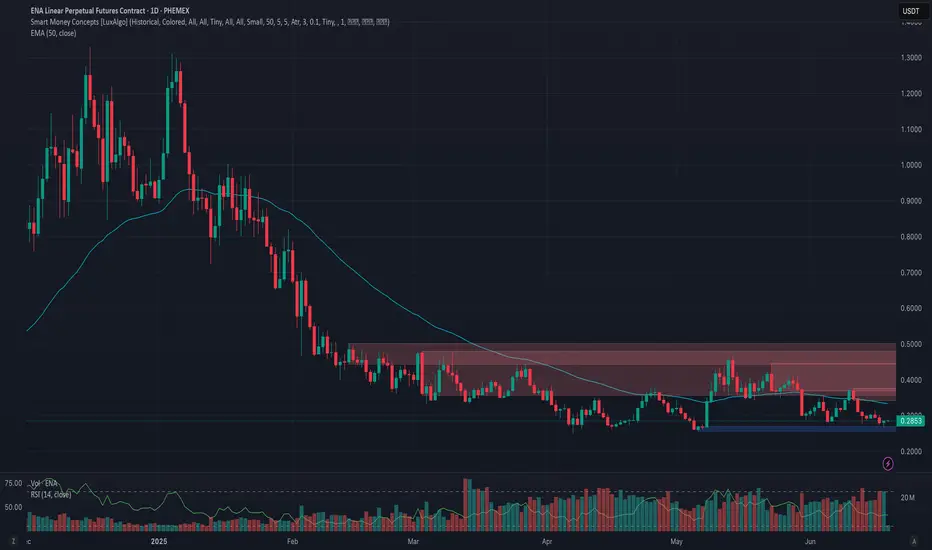
Phemex Analysis #91: Pro Tips for Trading Ethena (ENA)Launched in 2024, Ethena ( PHEMEX:ENAUSDT.P ) has swiftly risen as a powerful innovator in decentralized finance (DeFi). Its flagship synthetic dollar stablecoin, USDe, has achieved remarkable growth—ballooning from a mere $100 million supply at the beginning of 2024 to an impressive $5.8 billion, securing the third position among stablecoins by market capitalization. Concurrently, the ENA token itself delivered an astounding 550% price surge over the last five months, placing Ethena firmly among the top 10 DeFi protocols by total value locked (TVL), currently at approximately $5.8 billion.
In December 2024, Ethena expanded its stablecoin offerings by launching USDtb, a stablecoin backed 1:1 by cash and cash equivalents, with a remarkable 90% of reserves held in BlackRock’s USD Institutional Digital Liquidity Fund via Securitize. Ethena’s innovative USDe and the newly introduced USDtb represent crypto-native alternatives to established stablecoins such as USDT and USDC, promising censorship resistance and enhanced on-chain transparency.
Given USDtb's institutional-grade backing and advanced risk mitigation, it stands to substantially impact the broader stablecoin ecosystem, particularly as traditional USD-backed stablecoins face heightened regulatory scrutiny.
With Ethena’s significant innovations and market momentum in mind, let's carefully examine several potential price scenarios traders should be prepared for.
Possible Scenarios
1. Breakout Rise (Bullish Scenario)
Technical analysis indicates that ENA has formed a notable "triple bottom" around the $0.25 area, suggesting robust buying interest at this support level. If this support further solidifies, ENA could soon experience a bullish breakout above the immediate resistance at $0.37.
However, traders should exercise patience as the $0.50 zone represents strong resistance. It is expected that ENA’s price may fluctuate considerably before breaking confidently above this key psychological level.
Pro Tips:
Entry Strategy: Look to enter positions upon a confirmed breakout above $0.37, ideally with increasing trading volume.
Risk Management: Place stop-losses slightly below recent lows around $0.24–$0.25 to safeguard against false breakouts or reversals.
Profit-Taking: Consider partial profit-taking as the price approaches the critical resistance zone near $0.50.
2. Bearish Drop (Caution Scenario)
In a bearish scenario, potentially driven by broader negative market sentiment, ENA’s price could experience renewed downward pressure. A decisive, high-volume breakdown below the crucial support at $0.25 would strongly signal this bearish trend continuation.
Pro Tips:
Short Opportunities: Advanced traders might explore short-selling opportunities if ENA convincingly breaks below the $0.25 support.
Risk Mitigation: Set tight stop-losses to manage exposure, particularly if trading in volatile conditions.
3. Accumulation Phase (Neutral Scenario)
If the key $0.25 support successfully withstands selling pressure, Ethena’s price may enter a period of consolidation, bouncing between $0.25 (support) and $0.37 (resistance). Such consolidation typically reflects market indecision and accumulation before a substantial directional move.
Pro Tips:
Range Trading: Consider employing strategies such as grid trading to benefit from regular price oscillations within this trading range.
Observation and Patience: Stay observant for changes in volume or price momentum, as these could signal an imminent breakout or breakdown.
Conclusion
Ethena (ENA) is positioned at an intriguing crossroads, supported by impressive fundamentals, innovations, and growing market influence. Traders should closely monitor the outlined technical scenarios—recognizing key support and resistance levels, employing disciplined risk management, and capitalizing strategically based on evolving market conditions. With careful planning and timely execution, traders can confidently navigate Ethena’s current volatility and capture potential upside opportunities.
🔥 Tips:
Armed Your Trading Arsenal with advanced tools like multiple watchlists, basket orders, and real-time strategy adjustments at Phemex. Our USDT-based scaled orders give you precise control over your risk, while iceberg orders provide stealthy execution.
Disclaimer: This is NOT financial or investment advice. Please conduct your own research (DYOR). Phemex is not responsible, directly or indirectly, for any damage or loss incurred or claimed to be caused by or in association with the use of or reliance on any content, goods, or services mentioned in this article.
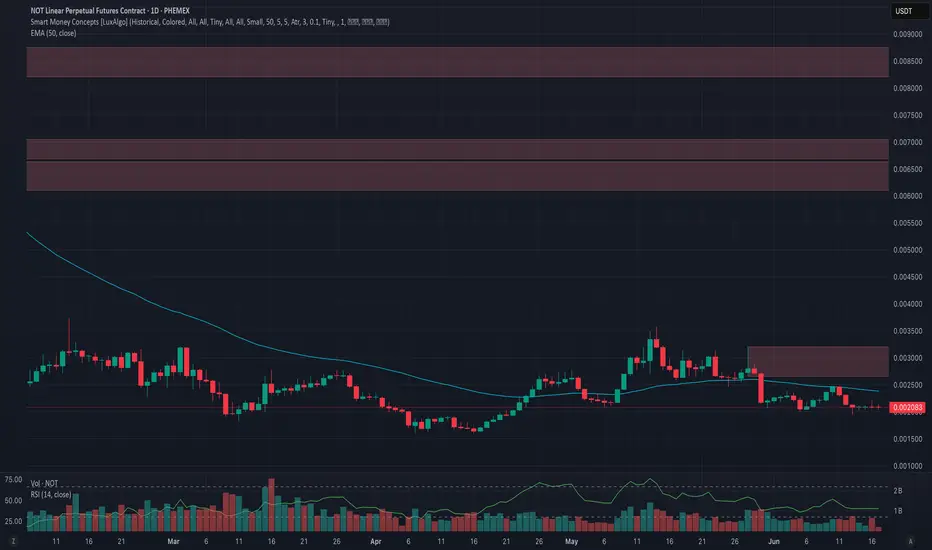
Phemex Analysis #90: Pro Tips for Trading Notcoin (NOT)Notcoin ( PHEMEX:NOTUSDT.P ) is rapidly becoming a standout token in the Web3 gaming sector, supported by a massive and highly engaged community comprising 13 million Telegram subscribers, 35 million game players, and 6.2 million active wallets. This impressive scale positions Notcoin as one of the largest gaming platforms in the Web3 space.
Recently, Notcoin has announced ambitious plans to enhance and expand its gaming ecosystem, making its existing popular games just a starting point for a much broader suite of offerings. This strategic expansion is designed not only to retain existing players but also to leverage Telegram's extensive user base to continually attract new users.
Furthermore, the introduction of innovative games and fresh reward mechanisms aims to build a more sustainable and enduring play-to-earn model, reducing dependency on short-lived hype and laying down foundations for consistent long-term growth.
Given these exciting developments, let's explore several possible trading scenarios that could unfold in the coming days.
Possible Scenarios
1. Breakout Rise Above $0.0032 (Bullish Scenario)
If Notcoin manages to maintain a stable footing above the critical support at $0.002, it could validate a clear "cup and handle" formation—a widely recognized bullish reversal pattern. A decisive breakout above the resistance level at $0.0032, especially if accompanied by strong trading volume, would signal the potential start of a significant bullish move.
Pro Tips:
Entry Strategy: Consider entering or scaling positions only once the breakout above $0.0032 is confirmed with substantial trading volume.
Short-Term Targets: Aim to take partial profits near key resistance zones at $0.0065 and $0.0084 to lock in gains effectively.
2. Retesting the $0.0016 Support Level (Neutral Scenario)
If the $0.002 support level fails to hold firmly, Notcoin’s price could pull back toward a critical lower support at $0.0016. Monitoring trading volume at this stage is crucial—if the decline occurs on low volume, it may indicate a temporary shakeout rather than sustained bearish pressure.
Pro Tips:
Volume Analysis: Pay close attention to trading volume. Low volume during a retest of $0.0016 would suggest weakening selling pressure and potential rebound.
Cautious Accumulation: Consider cautiously accumulating positions only after seeing clear stabilization around $0.0016.
3. Bearish Drop Below $0.0016 (Bearish Scenario)
Should Notcoin breach the crucial support at $0.0016 accompanied by high selling volume, this could signal significant bearish momentum. In this scenario, traders should exercise extreme caution and avoid immediate long positions.
Pro Tips:
Market Observation: Step back and remain cautious; staying on the sidelines could prevent unnecessary exposure to further declines.
Risk Management: Wait patiently for clear bullish reversal signals before re-entering the market or accumulating positions again.
Conclusion
Notcoin (NOT) is at an exciting yet pivotal moment, backed by robust community engagement and an evolving, sustainable gaming ecosystem. Traders should carefully monitor the outlined technical scenarios, apply disciplined risk management strategies, and keep a keen eye on trading volume as a key indicator. By approaching Notcoin strategically, traders can effectively navigate volatility, optimize potential rewards, and confidently capitalize on opportunities as they unfold.
🔥 Tips:
Armed Your Trading Arsenal with advanced tools like multiple watchlists, basket orders, and real-time strategy adjustments at Phemex. Our USDT-based scaled orders give you precise control over your risk, while iceberg orders provide stealthy execution.
Disclaimer: This is NOT financial or investment advice. Please conduct your own research (DYOR). Phemex is not responsible, directly or indirectly, for any damage or loss incurred or claimed to be caused by or in association with the use of or reliance on any content, goods, or services mentioned in this article.
Phemex Analysis #89: Toncoin (TON) - Breakout or Breakdown?!Toncoin ( PHEMEX:TONUSDT.P ) has seen its price pull back to $3.22, marking a 60% decline from its all‑time high near $8.28 in June 2024. While this might raise concerns, the project’s fundamentals have been strengthening dramatically, validating long‑term optimism. Over the past month, TON has remained in a tight consolidation between roughly $3.50 and $2.88, often seen as the “calm before the storm.” This brings us to the key question: Is TON preparing for a breakout—or a breakdown?
Possible Scenarios
1. Breakout Rise
If TON rises convincingly above $3.50 with increasing volume, it could signal the end of consolidation and the start of a bullish rally. A breakout here could propel TON towards $4.21, unlocking a potential 40% upside.
Pro Tips:
Enter on a strong breakout above $3.50, ideally with volume exceeding recent averages.
For short term profit, aim for $4.21, $5.36 or $6.0.
2. Bearish Drop
If TON breaks below the $2.88 support level with increased volume, this could trigger a bearish reversal. A further breakdown toward $2.36 or lower price is possible as traders exit positions
Pro Tips:
Consider short positions if the drop occurs with significant volume.
For believers in TON’s long-term roadmap, $2.40 support zone could present a favorable accumulation zone.
3. Retest $2.35 Support
A third scenario involves TON dipping to $2.35–$2.40—where stronger foundation lies—before resuming upward momentum. A shallow retracement with declining volume would indicate a soft landing that sets the stage for another rally.
Pro Tips:
Observe volume closely; a low-volume drop often signals a drop with no follow-through.
Consider accumulating gradually at or just above this support range.
Conclusion
Toncoin is forming a classic “calm before the storm” pattern—tight consolidation backed by bullish fundamentals. Whether it breaks upward toward $4.50, dips toward $2.40, or holds within range changes how traders can approach risk and opportunity.
Prepare by:
Watching volume-driven breakouts above $3.50,
Planning entries or accumulations around $2.40,
And managing risk with tight stop-losses just beyond the consolidation boundaries.
With strategic planning, informed risk control, and attention to market cues, traders can position themselves to benefit from TON’s next major move.
🔥 Tips:
Armed Your Trading Arsenal with advanced tools like multiple watchlists, basket orders, and real-time strategy adjustments at Phemex. Our USDT-based scaled orders give you precise control over your risk, while iceberg orders provide stealthy execution.
Disclaimer: This is NOT financial or investment advice. Please conduct your own research (DYOR). Phemex is not responsible, directly or indirectly, for any damage or loss incurred or claimed to be caused by or in association with the use of or reliance on any content, goods, or services mentioned in this article.

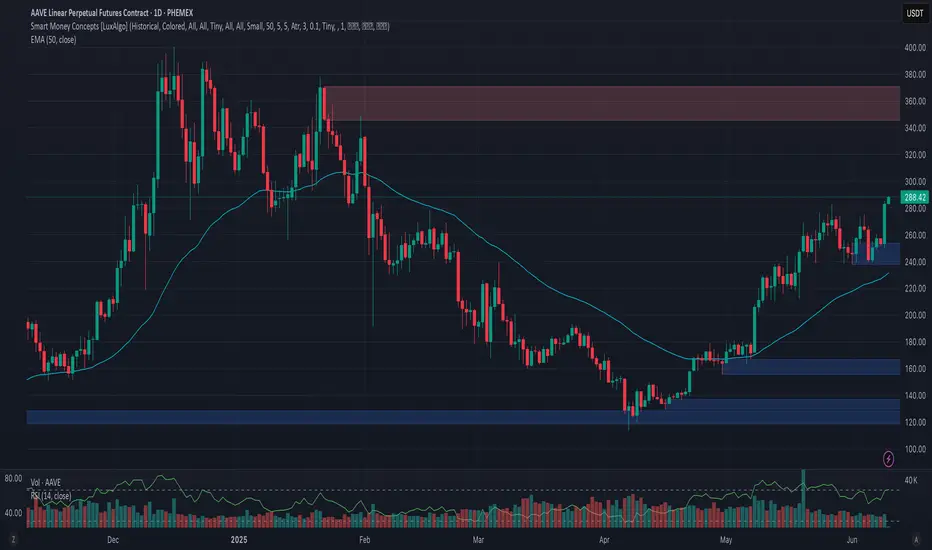
Phemex Analysis #88: Pro Tips for Trading Aave (AAVE)Aave ( PHEMEX:AAVEUSDT.P ), a leading decentralized lending protocol and one of the standout Layer 1 tokens, has attracted substantial trader interest recently by demonstrating remarkable resilience. Impressively, AAVE bounced back by approximately 100% from its recent low of $113 on April 7. Adding to this optimism, AAVE broke through a significant resistance at $282 just yesterday, potentially signaling a bullish continuation.
However, traders must proceed with caution, as this recent upward breakout was accompanied by relatively lower trading volume and a weaker Relative Strength Index (RSI) compared to the previous bullish surge seen on May 27. These factors introduce uncertainty into AAVE’s near-term trajectory, prompting the need for careful evaluation of possible scenarios over the next few days.
Possible Scenarios
1. Continued Bullish Momentum
Despite the RSI divergence observed during this latest peak, AAVE may continue its upward momentum, driven by sustained investor enthusiasm and broader market conditions. Traders should closely monitor price action around immediate resistance levels for short-term profit opportunities.
Pro Tips:
Profit Taking: Consider locking in short-term gains as AAVE approaches significant resistance areas, particularly at around $333 and subsequently at $370.
Risk Management: Set protective stop-loss orders below the recent support at $250 to limit potential losses in case market sentiment shifts suddenly.
2. Limited Rise Followed by Sharp Rejection
Another plausible scenario involves AAVE rising moderately higher but facing strong selling pressure near critical resistance levels, such as $300 and $333. A rejection at these levels could trigger a sharp corrective move, particularly if accompanied by increased selling volume.
Pro Tips:
Cautious Entries: Be cautious about initiating long positions near these resistance zones. Instead, wait for clear signals or confirmations before entering.
Short Opportunities: Experienced traders could potentially capitalize on short-selling opportunities if strong rejection signals manifest at these resistance levels.
3. Retest of Lower Support Levels
Given the relatively weak volume accompanying the recent breakout, there is a potential third scenario in which AAVE retests lower support areas. A pullback towards previously broken resistance (now support) at around $282, or even further down to around $250 & $238, might occur as the market tests buyer strength.
Pro Tips:
Observe Volume: Pay close attention to trading volumes if prices decline. Low-volume pullbacks could present good accumulation opportunities at support levels.
Accumulation Strategy: Consider cautiously accumulating positions near $250 or $238 only after clear signs of price stabilization and potential reversal appear.
Conclusion
While Aave (AAVE) showcases impressive strength and investor confidence, the current RSI divergence and volume trends suggest caution. By closely monitoring the outlined scenarios and implementing disciplined risk management strategies, traders can better navigate the uncertainty and volatility surrounding AAVE’s current market conditions.
🔥 Tips:
Break free from "buy low, sell high"! Our new Pilot Contract empowers you to profit from ANY market direction on DEX coins with up to 3x leverage. Go long, go short, go further!
Check out Phemex - Pilot Contract today!
Disclaimer: This is NOT financial or investment advice. Please conduct your own research (DYOR). Phemex is not responsible, directly or indirectly, for any damage or loss incurred or claimed to be caused by or in association with the use of or reliance on any content, goods, or services mentioned in this article.
Phemex Analysis #87: Pro Tips for Trading Hyperliquid (HYPE)Hyperliquid ( PHEMEX:HYPEUSDT.P ) has rapidly become one of the most talked-about cryptocurrencies over the past two months. Impressively defying broader market uncertainties, HYPE soared from a low of $9.313 on April 7 to a remarkable high of $40.019 on May 26—achieving an astounding growth of approximately 329%.
However, caution is advised, as recent price action has formed a classic "Head-and-Shoulders" pattern, with the third peak emerging around June 3. This technical setup often indicates weakening bullish momentum and potential trend reversal. Given this scenario, let's delve deeper into several possible outcomes that could unfold for HYPE in the upcoming days.
Possible Scenarios
1. Bearish Reversal
The Head-and-Shoulders formation signals a potential bearish reversal. If HYPE breaks below the critical support levels at $31.5, especially with increased trading volume, and subsequently breaches the $30 support, the likelihood of a sharp downward movement intensifies.
Pro Tips:
Short Positions: Consider initiating short positions upon confirmed breakdowns below $31.5 or $30. Always employ tight stop-losses to manage risk effectively.
Long-Term Accumulation: For those with a longer-term bullish outlook on HYPE, watch closely for price stabilization around lower support levels at $25.5 and $24.3, which could offer strategic entry points for buying the dip.
2. Retesting the $30 Support Level
Another plausible scenario is that HYPE might retrace to the $30 support level, characterized by declining trading volume. If volume diminishes significantly at this level, it could indicate that selling pressure is weakening, setting the stage for consolidation rather than further declines.
Pro Tips:
Grid Trading Strategy: Utilize grid trading to systematically capitalize on potential range-bound movement between clear support at $30 and resistance near $38.
Risk Management: Remain disciplined by setting clear stop-losses above the resistance or below support to protect against unexpected breakouts or breakdowns.
3. Breakout Rise (Bullish Scenario)
While considered less likely given current technical patterns, crypto markets often defy expectations. A bullish breakout above the immediate resistance levels at $37.2 and subsequently $39.7—particularly if accompanied by strong positive news or substantial trading volume—could signal another significant upward move.
Pro Tips:
Watch Resistance Levels: Stay alert for decisive breakouts above $37.2 and $39.7, validating the bullish scenario.
Confirmation Required: Only enter long positions if breakouts are confirmed by sustained volume and supportive fundamental news.
Conclusion
Hyperliquid (HYPE) currently stands at a crucial technical juncture, presenting multiple strategic opportunities for traders. Whether anticipating a bearish reversal, a consolidation phase, or a surprise bullish breakout, successful trading will depend on vigilance, technical confirmations, and disciplined risk management. Stay adaptable, carefully monitor key price levels, and remain informed about news and market developments to confidently navigate trading HYPE.
Tips:
Elevate Your Trading Game with Phemex. Experience unparalleled flexibility with features like multiple watchlists, basket orders, and real-time adjustments to strategy orders. Our USDT-based scaled orders give you precise control over your risk, while iceberg orders provide stealthy execution.
Disclaimer: This is NOT financial or investment advice. Please conduct your own research (DYOR). Phemex is not responsible, directly or indirectly, for any damage or loss incurred or claimed to be caused by or in association with the use of or reliance on any content, goods, or services mentioned in this article.

Phemex Analysis #86: Pro Tips for Trading Ethereum (ETH)Ethereum ( PHEMEX:ETHUSDT.P ) has captured traders’ attention after experiencing a notable 50% rise since early May. Currently, ETH has been consolidating between $2,800 and $2,300 for approximately three weeks. This sideways movement indicates that the market could be in a phase of accumulation, potentially preparing for a bullish breakout. However, traders should remain cautious, as consolidation can sometimes precede bearish trends as well. Let's carefully evaluate several possible scenarios to better understand Ethereum’s next potential move.
Possible Scenarios
1. Breakout Rise (Bullish Scenario)
If Ethereum successfully breaks the critical resistance at around $2,855, particularly with increased trading volume, this would strongly signal the onset of a bullish trend. Such a breakout could attract additional buyers, further fueling upward momentum.
Pro Tips:
Entry Strategy: Consider entering a long position only after ETH clearly surpasses $2,855 with substantial volume.
Risk Management: Place stop-loss orders below the recent resistance-turned-support area around $2,800 to safeguard against potential fake-outs or reversals.
2. Retesting Support Levels (Bearish Scenario)
Should Ethereum fail to surpass the $2,855 resistance zone convincingly, a pullback towards lower support levels becomes likely. Significant areas to monitor in such a scenario include support at $2,320, $1,750, and potentially as low as $1,536.
Pro Tips:
Buy the Dip Carefully: Watch closely for price stabilization at these support levels before initiating accumulation.
Risk Consideration: Avoid aggressively entering positions if price shows accelerated declines with increasing volume. Always wait for confirmed support and reversal signals.
3. Continued Consolidation (Range-bound Scenario)
Ethereum might extend its current consolidation, continually bouncing within the range of $2,300 to $2,800. This scenario presents unique opportunities for traders to capitalize on repeated price movements.
Pro Tips:
Grid Trading Bots: Implement a Grid Trading strategy to effectively capitalize on small but frequent price fluctuations. Start long grid positions near the $2,300 support area and short grid positions around the $2,800 resistance.
Caution and Risk Management: Always set clear stop-loss levels outside the trading range, specifically below support or above resistance, to protect against sudden trend reversals or breakouts.
Conclusion
Ethereum’s current price action presents traders with multiple strategic opportunities, whether through breakout trades, support-level retests, or consolidation strategies. By remaining vigilant, monitoring key levels, and employing disciplined risk management, traders can effectively navigate Ethereum’s evolving market conditions and enhance their trading outcomes.
Tips:
Elevate Your Trading Game with Phemex. Experience unparalleled flexibility with features like multiple watchlists, basket orders, and real-time adjustments to strategy orders. Our USDT-based scaled orders give you precise control over your risk, while iceberg orders provide stealthy execution.
Disclaimer: This is NOT financial or investment advice. Please conduct your own research (DYOR). Phemex is not responsible, directly or indirectly, for any damage or loss incurred or claimed to be caused by or in association with the use of or reliance on any content, goods, or services mentioned in this article.
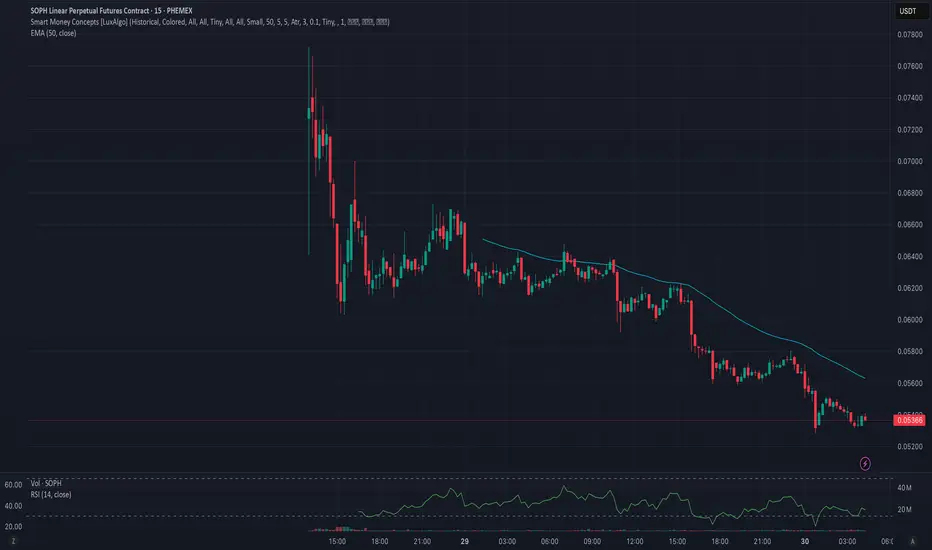
Phemex Analysis #85: Is it Time to Enter SOPHON (SOPH)?!SOPHON ( PHEMEX:SOPHUSDT.P ), a rising project in the cryptocurrency space, has recently attracted traders' attention with its dynamic price action and notable volatility. Currently trading around $0.055, SOPH experienced a bearish move after failing to maintain earlier gains above $0.065. As the price now hovers near crucial short-term support levels, traders are evaluating whether this dip presents a buying opportunity or signals further downward pressure. Let’s explore several potential scenarios based on SOPH’s 15-minute chart to determine if now is the ideal moment to enter the market.
Possible Scenarios (15-minute chart)
1. Double Bottom at $0.05 with RSI Divergence (Bullish Reversal)
A closer examination of SOPH's 15-minute chart reveals the potential formation of a double bottom near the $0.05 level, accompanied by RSI divergence. Specifically, the RSI is showing higher lows while the price revisits its previous low, signaling diminishing selling pressure and a likely bullish reversal.
Pro Tips:
Long-term Accumulation: Consider gradually accumulating SOPH near the $0.05 support if bullish divergence persists.
Confirmation: Wait for price stabilization and rising volume near the support level to confirm the reversal before scaling in.
2. Breakout Above $0.058 (Bullish Confirmation)
If SOPH decisively breaks the immediate resistance level at $0.058, especially accompanied by high trading volume, it could mark a strong bullish signal. However, after the breakout, a minor retracement could form a classic "cup and handle" pattern—historically a robust bullish setup—prior to resuming its upward trajectory.
Pro Tips:
Long Entry: Go long upon confirmed breakout above $0.058.
Pattern Recognition: If a cup and handle pattern forms after the breakout, look to add positions on the subsequent confirmation, preparing for potentially significant upward movement.
3. Bearish Continuation (Cautionary Scenario)
On the downside, if SOPH falls below the critical support at $0.0528 accompanied by higher-than-average trading volume, it indicates the bearish momentum might persist. Such a breakdown could lead to further declines and test deeper support zones.
Pro Tips:
Risk Management: Avoid entering new long positions if this bearish scenario plays out.
Market Observation: Remain on the sidelines, observing until clear bullish reversal signals or price stabilization at a lower support level appear.
Conclusion
SOPHON (SOPH) currently sits at a crucial juncture, offering potential opportunities depending on how price action unfolds in the short term. Traders should closely watch for bullish divergence signals around $0.05, breakout confirmations above $0.058, or bearish continuation below $0.0528. Employ disciplined risk management, and remain adaptable to market dynamics to confidently and strategically trade SOPHON (SOPH).
Tips:
Elevate Your Trading Game with Phemex. Experience unparalleled flexibility with features like multiple watchlists, basket orders, and real-time adjustments to strategy orders. Our USDT-based scaled orders give you precise control over your risk, while iceberg orders provide stealthy execution.
Disclaimer: This is NOT financial or investment advice. Please conduct your own research (DYOR). Phemex is not responsible, directly or indirectly, for any damage or loss incurred or claimed to be caused by or in association with the use of or reliance on any content, goods, or services mentioned in this article.
Phemex Analysis #84: Pro Tips for Trading PEPEIn the vibrant and ever-changing landscape of cryptocurrency trading, PEPE ( PHEMEX:1000PEPEUSDT.P ) has recently captured significant attention from investors. Over the past 30 days, PEPE surged an impressive 130%, showcasing strong bullish momentum after a prolonged downtrend. This recent rally has rekindled investor interest, suggesting that a potential bullish reversal may be underway.
Yet, with volatility remaining high, traders should remain cautious.
Let’s explore several possible price scenarios and strategies to capitalize effectively on PEPE’s movements.
Possible Scenarios
1. Accumulation Followed by Breakout Rise
Currently, PEPE is showing signs of accumulation in the $0.015 to $0.012 range. This sideways consolidation typically indicates that market participants are gathering positions before a potentially significant upward move. If PEPE breaks decisively above the critical resistance at $0.0163, especially accompanied by a notable spike in trading volume, it would be a strong confirmation of bullish sentiment.
Pro Tips:
Entry Strategy: Consider accumulating positions within the consolidation range ($0.015 - $0.012). Wait for confirmation of a breakout above $0.0163 to scale up your positions confidently.
Risk Management: Place stop-loss orders below $0.012 to mitigate downside risk should the breakout fail to materialize.
2. Retesting the $0.007 Support Area
A pullback scenario could also unfold, bringing PEPE’s price down to retest the critical support zone around $0.007. If this retest occurs with relatively low trading volume and the RSI remains higher compared to previous lows—signaling a Double Bottom formation with RSI divergence—this could provide an excellent accumulation opportunity.
Pro Tips:
Accumulation Signals: Monitor trading volume and RSI closely. A successful retest at $0.007 with bullish divergence could indicate strong buying pressure.
Entry Confirmation: Conservative traders may prefer waiting for a confirmed breakout upward from the $0.007 support area before entering positions.
3. Bearish Drop Scenario
Despite the recent bullish signs, a bearish scenario remains possible. If PEPE declines towards the support level at $0.012 with increasing trading volume, and subsequently drops to $0.007 with even higher volume, it could indicate strong bearish momentum and weak market sentiment. Under these conditions, caution is highly recommended.
Pro Tips:
Market Caution: If price action unfolds this way, it’s advisable to refrain from entering positions immediately.
Wait and Observe: Allow price to stabilize before reconsidering any potential entry points, ensuring clear evidence of support.
Conclusion
PEPE’s recent 130% surge represents promising signs of a bullish reversal, yet navigating such volatility demands careful planning and strategic execution. By closely monitoring the outlined scenarios—recognizing accumulation signals, bullish divergences, and maintaining disciplined risk management—traders can maximize their potential returns while minimizing risk exposure. Always stay alert, responsive to market signals, and ready to adapt to changing conditions to trade PEPE confidently and profitably.
Tips:
Trade Smarter, Not Harder with Phemex. Benefit from cutting-edge features like multiple watchlists, basket orders, and real-time strategy adjustments. Our unique scaled order system and iceberg order functionality give you a competitive edge.
Disclaimer: This is NOT financial or investment advice. Please conduct your own research (DYOR). Phemex is not responsible, directly or indirectly, for any damage or loss incurred or claimed to be caused by or in association with the use of or reliance on any content, goods, or services mentioned in this article.

Phemex Analysis #82: BTC Breaking the $110,000 All-Time-High!Bitcoin ( PHEMEX:BTCUSDT.P ) has reached a new all-time high, surpassing $111,000, driven by strong institutional inflows, regulatory clarity, and macroeconomic factors. This surge follows our previous analysis , where we anticipated a potential breakout above the $105,000 mark. The current rally is fueled by increased demand from institutional investors, favorable regulatory developments, and concerns over traditional financial markets.
Possible Scenarios
1. Testing $120,000
With momentum on its side, Bitcoin could aim for the next psychological resistance at $120,000. Institutional interest, as evidenced by significant ETF inflows and corporate investments, supports this bullish outlook. Technical indicators, such as the "golden cross" pattern, also suggest continued upward momentum.
Pro Tips:
Monitor trading volume and market sentiment for signs of sustained bullishness.
Set stop-loss orders to protect against sudden reversals.
2. Rejection and Retest of $100,000 Support
After reaching new highs, Bitcoin may experience a pullback to test the $100,000 support level. This consolidation could be a healthy correction before the next leg up.
Pro Tips:
Watch for buying opportunities near the $100,000 support zone.
Be cautious of false breakouts and wait for confirmation before entering new positions.
3. Bearish Reversal Due to U.S. Treasury Bonds News
Rising U.S. Treasury yields and fiscal concerns have led to increased volatility in traditional markets. A significant shift in investor sentiment could trigger a bearish reversal in Bitcoin's price.
Pro Tips:
Stay informed about macroeconomic developments, particularly U.S. fiscal policies and bond market movements.
Long-Term Accumulation: For investors with a longer-term perspective, significant price dips near lower supports—such as $92750, $83000, or even $66810—could represent attractive opportunities to accumulate BTC at discounted valuations.
Conclusion
Bitcoin's recent surge past $110,000 marks a significant milestone, reflecting growing institutional adoption and favorable market conditions. While the bullish trend may continue, traders should remain vigilant and prepared for potential corrections or reversals influenced by macroeconomic factors. Employing sound trading strategies and staying informed will be key to navigating the evolving landscape of Bitcoin's price movements.
Pro Tips:
Armed Your Trading Arsenal with advanced tools like multiple watchlists, basket orders, and real-time strategy adjustments at Phemex. Our USDT-based scaled orders give you precise control over your risk, while iceberg orders provide stealthy execution.
Disclaimer: This is NOT financial or investment advice. Please conduct your own research (DYOR). Phemex is not responsible, directly or indirectly, for any damage or loss incurred or claimed to be caused by or in association with the use of or reliance on any content, goods, or services mentioned in this article.
Phemex Analysis #82: Pro Tips for Trading Dogecoin (DOGE)Dogecoin (DOGE), once known primarily as a playful meme token, has proven it can produce substantial market movements, drawing significant attention from traders and investors. Notably, in October 2024, DOGE made headlines with a stunning 500% rally, soaring from $0.11 to a peak of $0.48. Yet, as swiftly as it surged, Dogecoin experienced a sharp reversal, dropping nearly 70% to its current price around $0.15.
Recently, technical indicators have hinted at potential opportunities. On March 11, DOGE's price dipped below the level seen on February 28, yet the Relative Strength Index (RSI) remained steady, creating a bullish divergence—often signaling a potential reversal. But before traders jump in, let’s carefully examine a few possible scenarios using key support and resistance levels as a roadmap.
Possible Scenarios
1. Bullish Reversal
The RSI divergence observed on the daily chart suggests decreasing selling momentum, hinting at a possible bullish reversal. If DOGE manages to break decisively above nearby resistance levels, renewed buying interest could emerge, pushing the price higher.
Pro Tips:
Entry Strategy: Look for a confirmed breakout above the key resistance zones of $0.261 and $0.286, ideally accompanied by increased trading volume.
Risk Management: To mitigate risk, set stop-loss orders below the recent support level of $0.21, ensuring you’re protected if the anticipated reversal fails.
2. Consolidation Phase
Following substantial price moves, DOGE may enter a period of sideways trading as the market consolidates gains or losses. During this phase, the price could oscillate within a defined range, offering opportunities for both traders and long-term investors to accumulate strategically.
Pro Tips:
Identify Key Levels: Closely monitor the key support at $0.21 and resistance around $0.261 to effectively execute range-based trading strategies.
Utilize Grid Bots: Due to lower volatility during consolidation, deploying grid trading bots can help systematically capture profits from minor price fluctuations.
3. Continued Downtrend
Despite recent positive signals, Dogecoin remains susceptible to broader market conditions. If DOGE breaks below the critical support at $0.21, bearish sentiment could intensify, resulting in further price declines toward lower support levels.
Pro Tips:
Short Positions: Advanced traders may consider short-selling DOGE below key support levels, profiting from continued downward pressure while maintaining a clearly defined exit strategy.
Long-Term Accumulation: For investors with a longer-term perspective, significant price dips near lower supports—such as $0.164, $0.15, or even $0.13—could represent attractive opportunities to accumulate DOGE at discounted valuations.
Conclusion
Dogecoin’s volatility continues to present unique trading opportunities alongside considerable risks. Traders must carefully analyze technical indicators like RSI divergences and closely monitor market sentiment and broader crypto trends. By understanding the scenarios outlined above, employing disciplined risk management, and remaining patient during market fluctuations, traders can confidently navigate DOGE’s price movements, positioning themselves strategically for potential rewards.
Pro Tips:
Armed Your Trading Arsenal with advanced tools like multiple watchlists, basket orders, and real-time strategy adjustments at Phemex. Our USDT-based scaled orders give you precise control over your risk, while iceberg orders provide stealthy execution.
Disclaimer: This is NOT financial or investment advice. Please conduct your own research (DYOR). Phemex is not responsible, directly or indirectly, for any damage or loss incurred or claimed to be caused by or in association with the use of or reliance on any content, goods, or services mentioned in this article.

Phemex Analysis #81: Pro Tips for Trading VIRTUAL In the rapidly evolving landscape of cryptocurrency, Virtuals Protocol ( PHEMEX:VIRTUALUSDT.P ) has emerged as a notable player, particularly within the AI and metaverse sectors. As of May 16, 2025, VIRTUAL is trading at approximately $1.85, with a 24-hour trading volume of around $280 million and a market capitalization of $1.21 billion. This positions VIRTUAL as a significant asset within the crypto market, reflecting growing investor interest.
Recent developments have further bolstered VIRTUAL's prominence. The introduction of veVIRTUAL, a vote-escrowed token system launched on May 13, 2025, incentivizes long-term staking and governance participation. Additionally, expansion to the Solana blockchain and partnerships with initiatives such as the AI Hackathon highlight Virtuals Protocol's commitment to cross-chain development and community engagement.
Given these dynamics, traders are keen to understand potential trajectories for VIRTUAL's price movement. Let's explore several possible scenarios to guide your trading strategies.
Possible Scenarios
1. Bullish Continuation
VIRTUAL has demonstrated impressive growth, achieving a 234% increase over the past month. If this momentum continues, reinforced by ongoing developments and increased adoption, VIRTUAL may test critical resistance levels around $2.50 and potentially approach its all-time high of $5.07.
Pro Tips:
Entry Strategy: Consider entering positions on confirmed breakouts above key resistance levels such as $2.16, particularly if accompanied by high trading volume.
Risk Management: Implement stop-loss orders near recent swing lows, such as $1.76, to protect your positions from sudden market reversals.
2. Consolidation Phase
After significant price movements, VIRTUAL may enter a consolidation phase, trading within a defined range as the market absorbs recent gains. Such periods can provide opportunities for range-bound trading strategies or accumulation for long-term growth.
Pro Tips:
Identify Key Levels: Monitor key support and resistance zones, notably $1.27 (support) and $2.16 (resistance), to effectively execute buy and sell orders within the trading range.
Patience: Avoid overtrading during consolidation phases. Wait for clear breakout signals before making significant trading decisions.
3. Bearish Reversal
Despite recent successes, external factors such as broader market downturns or unforeseen negative news could trigger a bearish reversal. If VIRTUAL falls below critical support levels, notably $1.50, further declines could follow.
Pro Tips:
Short Positions: Experienced traders might consider short-selling strategies to profit from potential declines, ensuring they maintain a clear exit plan.
Long-Term Accumulation: For long-term investors, significant price dips could represent buying opportunities. Watch key support levels such as $1.27, $1.00, and $0.67 for potential entry points to accumulate VIRTUAL at lower valuations.
Conclusion
Virtuals Protocol's innovative approach to integrating AI within the blockchain ecosystem positions it as a compelling asset in the crypto market. While recent developments and price movements suggest potential for continued growth, traders must remain vigilant. Employing sound risk management and staying informed about ongoing developments is essential. By considering the scenarios outlined above, traders can navigate VIRTUAL's market dynamics with greater confidence and strategic insight.
Pro Tips:
Armed Your Trading Arsenal with advanced tools like multiple watchlists, basket orders, and real-time strategy adjustments at Phemex. Our USDT-based scaled orders give you precise control over your risk, while iceberg orders provide stealthy execution.
Disclaimer: This is NOT financial or investment advice. Please conduct your own research (DYOR). Phemex is not responsible, directly or indirectly, for any damage or loss incurred or claimed to be caused by or in association with the use of or reliance on any content, goods, or services mentioned in this article.
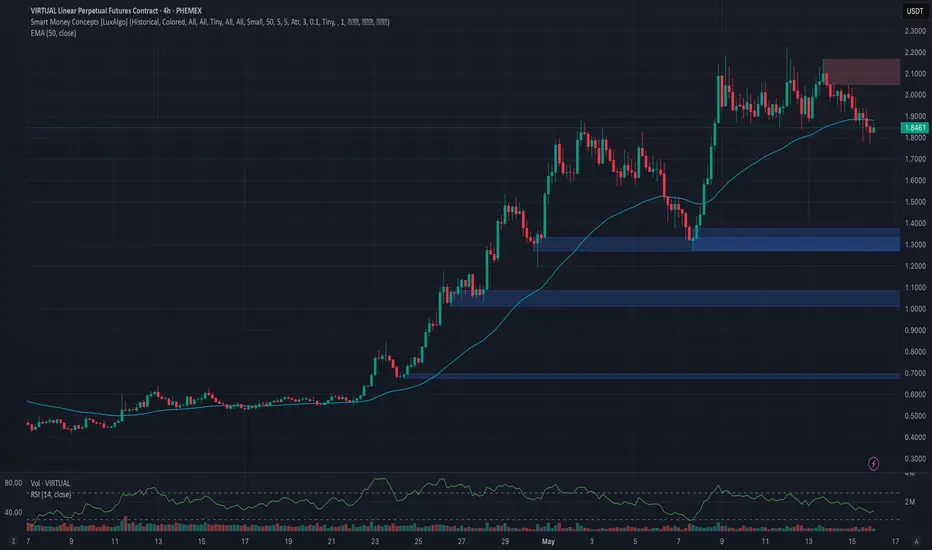
Phemex Analysis #80: Can Bitcoin Hold $100k?Bitcoin’s breakout above the $100,000 mark on May 8, 2025—its highest level since early January—reflects renewed risk-on sentiment across global markets, supported by easing U.S.-China tension and expectations of favorable crypto regulation. Spot ETF flows have also played a pivotal role: U.S. Bitcoin ETFs have accumulated over $1 billion in net inflows this month, with BlackRock’s IBIT leading demand, underpinning liquidity in the $100k zone. Despite the enthusiasm, trading volumes on leading exchanges have shown signs of plateauing, hinting at cautious engagement from larger players.
Possible Scenario
Support Analysis
1. $100,000 Psychological Support
After initially spiking to $105,784, BTC retreated to hover just above $100k, which has transitioned into a crucial support level. A decisive hold here would confirm buyer conviction at round-number thresholds.
$97,000 Major Technical Floor: Beneath six figures, the $97,000 region—previously a resistance zone in April—now offers strong demand, reinforced by the convergence of the 50- and 100-day moving averages.
$92,000 Secondary Support: Should broader market risk aversion emerge, traders could see a retracement back to $ 92K, where on-chain data indicates accumulation by long-term holders. This level aligns with the 200-day moving average, often cited as a bear-market safeguard.
2. ETF-Driven Cushion
Spot ETF inflows continue to absorb sell-side pressure, potentially dampening volatility around support levels. Historical data shows ETFs acted as a buffer during the March sell-off, suggesting they may again prevent sharp dives if BTC dips towards $90k–$100k.
Resistance Analysis
1. $105,000 Near-Term Cap
BTC peaked at approximately $105,784 on May 12, encountering supply from short-term profit-takers. A close above this region would target the early-2025 all-time high near $109,917.
2. $109,917 All-Time High
Surpassing the January ATH at $109k remains a key objective for bulls. However, historical patterns reveal increasingly subdued momentum on successive tests of this level, indicating potential exhaustion if attempted too quickly.
3.Upside Target $120,000
Most Analysts highlight a possible extension to $120k should institutional demand persist and macro conditions remain supportive.
Conclusion
Bitcoin’s ability to hold the $100,000 mark hinges on its capacity to stave off profit-taking around headline-grabbing price points and sustain ETF-driven support. Key technical floors at $100k and $ 97K—reinforced by moving-average convergence—provide a strong base, while resistance levels at $105k and the all-time high near $109.6k represent the next hurdles. If these zones are negotiated successfully, a new leg toward $120k could unfold; if not, traders should watch for a pullback to the mid-$90,000 range for renewed entries.
Overall, barring sudden negative macro shocks, the outlook favors BTC maintaining its foothold at six figures, underpinning continued upside momentum.
Pro Tips:
Armed Your Trading Arsenal with advanced tools like multiple watchlists, basket orders, and real-time strategy adjustments at Phemex. Our USDT-based scaled orders give you precise control over your risk, while iceberg orders provide stealthy execution.
Disclaimer: This is NOT financial or investment advice. Please conduct your own research (DYOR). Phemex is not responsible, directly or indirectly, for any damage or loss incurred or claimed to be caused by or in association with the use of or reliance on any content, goods, or services mentioned in this article.
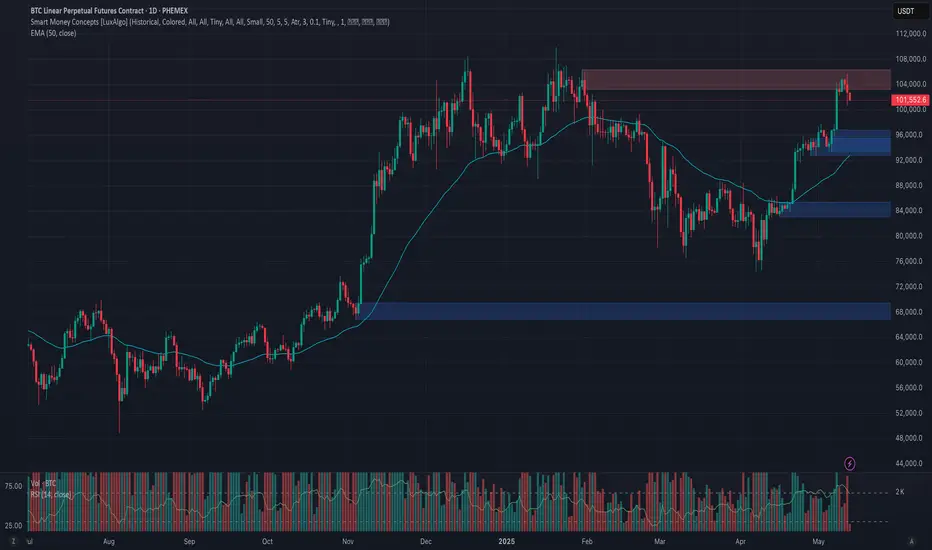
Phemex Analysis #79: KAITO Surge 85% in 48 Hours!KAITO token has recently experienced a significant surge, gaining approximately 85% in the past 48 hours. This explosive price action has drawn considerable attention from traders and investors. The surge appears to be fueled by increased investor interest driven by new partnerships and expanding community rewards, particularly the integration of Huma Finance's Yapper leaderboard. Kaito is an AI token based on the BASE blockchain. The platform aims to enhance user experience and engagement within decentralized finance (DeFi) by providing AI-driven insights. This analysis will delve into the potential reasons behind this surge and explore possible trading scenarios for KAITO.
Possible Reasons
The recent price surge in KAITO can be attributed to a combination of factors:
Huma Finance Integration: KAITO's integration of Huma Finance's Yapper leaderboard has generated excitement. Yappers, who actively engage with crypto-related content on X, are being rewarded through Kaito's platform. This collaboration is likely driving increased demand for KAITO tokens.
"Earn and Drop" Season: Kaito founder Yu Hu announced the start of the "Earn and Drop" season, with collaborations like the one with PayFi Network's BOOP. These initiatives incentivize user participation and can contribute to positive price momentum.
Increased Transparency: The addition of Total Value Distributed data to Kaito's Dune Analytics dashboard provides greater transparency into reward distribution within the ecosystem. This transparency can boost investor confidence.
Community Growth: Kaito has experienced strong community growth, with a significant number of monthly active "Yappers." A vibrant and engaged community can contribute to increased token demand.
Token Withdrawals from Exchanges: Data indicates that investors have been withdrawing KAITO tokens from exchanges, suggesting accumulation rather than selling pressure.
Possible Scenarios
Given the recent surge, here are three potential scenarios for KAITO's short-term price action:
1. Continuation of the Uptrend
If KAITO maintains strong buying pressure, high volume, and positive sentiment driven by ongoing developments and community engagement, the uptrend could continue.
Pro Tips:
If the price continues rising, consider taking short-term profits at key resistance levels like $1.78, $2.02 & $2.43.
Monitor technical indicators such as the Relative Strength Index (RSI) and Moving Average Convergence Divergence (MACD) for confirmation of continued bullish momentum.
2. Bearish Reversal
Following the rapid price increase, KAITO is vulnerable to a bearish reversal. Profit-taking, negative news, or a shift in overall market sentiment could trigger a significant decline.
Pro Tips:
Watch for signs of weakening momentum, such as bearish divergence in the RSI or the formation of bearish chart patterns (e.g., double top, head and shoulders).
Be prepared to exit long positions quickly if a reversal occurs.
Consider short-selling opportunities if the price breaks below key support levels with strong volume, but exercise caution and manage risk effectively.
3. Small Dip Before Continued Rise
KAITO's price may experience a small dip, potentially towards the $1.00 level, followed by a consolidation period before resuming its upward trajectory. This scenario suggests a temporary pullback before the uptrend continues.
Pro Tips:
Identify the potential support level for the dip (e.g., $1.00).
Watch for signs of consolidation following the dip, such as sideways price action with decreasing volatility.
You might start accumulating KAITO during the sideways movement or look for a breakout above the consolidation range as a signal to enter long positions, targeting the previous resistance levels.
Conclusion
KAITO's recent 85% surge is driven by a combination of factors, including strategic integrations, community engagement, and positive market sentiment. While the current momentum is strong, traders should be aware of the inherent volatility in the cryptocurrency market. The three scenarios outlined above—continuation of the uptrend, bearish reversal, and a small dip before a continued rise—provide a framework for understanding potential future price action. By employing sound risk management practices, utilizing technical and fundamental analysis, and staying informed about developments within the Kaito ecosystem, traders can navigate the market effectively.
Pro Tips:
Trade Smarter, Not Harder with Phemex. Benefit from cutting-edge features like multiple watchlists, basket orders, and real-time strategy adjustments. Our unique scaled order system and iceberg order functionality give you a competitive edge.
Disclaimer: This is NOT financial or investment advice. Please conduct your own research (DYOR). Phemex is not responsible, directly or indirectly, for any damage or loss incurred or claimed to be caused by or in association with the use of or reliance on any content, goods, or services mentioned in this article.
