PIUSDT Daily Technical AnalysisPIUSDT Daily Technical Analysis
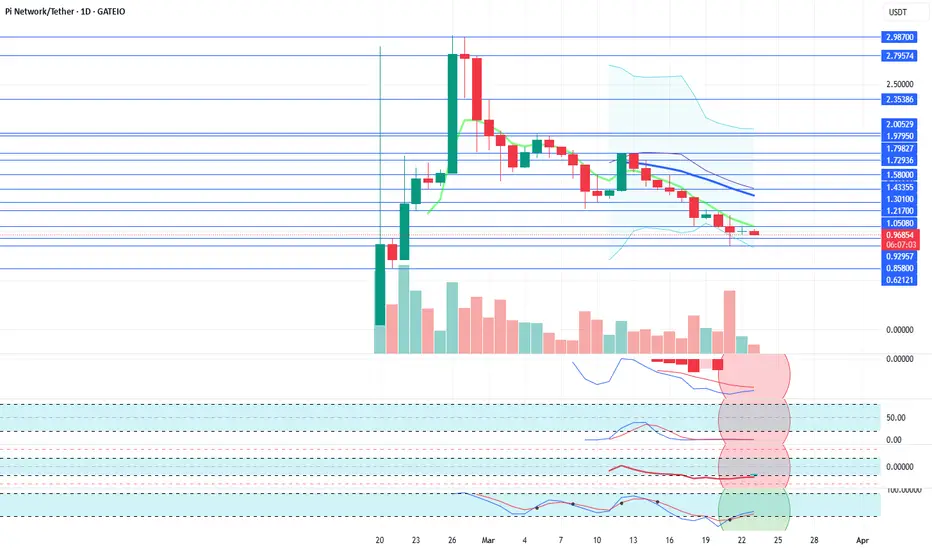
Pi Network Coin indicators are NEGATIVE. The selling pressure on Pi Coin is still ongoing. Indicators are at a low position but still appear negative. If it can move sideways above the 0.92957 support level, the chances of recovery in the coming days may increase. The 0.92957 - 0.858 price levels are important support points.
It seems that the Pi Network team is somewhat weak in social communication. The applications created on the platform are still inactive, and the KYC period for users who joined before the Mainnet has now expired. There has been no explanation regarding the coins removed from accounts, or at least, we haven't seen one. In fact, no statement has been made on their YouTube channel either. If the coin does not break below these support levels, it could create a buying opportunity for positive price movements in the future. There is currently no clear information, so we will see how things develop.
NOT INVESTMENT ADVICE.
The information, comments, and recommendations provided here do not constitute investment advice. Investment advisory services are offered within the framework of an agreement between clients and brokerage firms, portfolio management companies, and non-deposit banks. The content on this page reflects only personal opinions. These views may not be suitable for your financial situation, risk tolerance, or return preferences. Therefore, investments should not be made based on the information and writings on this page.
To avoid missing our analyses of both positive and risky technical indicators, follow us and like our content—we would appreciate it!
PI
PIUSDT Hourly Technical AnalysisPIUSDT Hourly Technical Analysis
In the 1-hour technical analysis of Pi Network Coin, the selling pressure continues as it failed to break the 1.21 resistance. The price has dropped to the 1.0770 support level. If this support is also broken downward, the next support levels are 1.031 - 1.010. Our current expectation is negative. Next week, we may shift to daily technical analysis since daily technical data is also becoming clearer. However, for now, the daily outlook also appears negative. If there are sharp declines, buying at lower prices could create a potential for significant long-term returns.
THIS IS NOT INVESTMENT ADVICE.
The information, comments, and recommendations provided here do not constitute investment advice. Investment advisory services are provided within the framework of an investment advisory agreement signed between the investor and brokerage firms, portfolio management companies, or non-deposit banks. The content on this page reflects only personal opinions and may not be suitable for your financial situation, risk tolerance, or return expectations. Therefore, no investment decisions should be made based on the information and statements provided here.
To stay updated on our analyses with both positive and risky technical indicators, please follow and like our page. Your support is greatly appreciated!

Just In: $PI Set for 200% Surge Amidst Steep Falling WedgeThe price of price is set to skyrocket amidst a steep falling wedge pattern that has left the asset plummeting currently down 14%.
While the asset is currently oversold as indicated by the Relative strength index (RSI) of 21, this adds more credence to the bullish thesis. With a recent All time high (ATH) of $2.98 and a total and maximum supply of 100 billion tokens, PI coin is more than ready to capitalize on this market dip to spark a renaissance.
Albeit the crypto market is facing turbulence time at the moment, with the crypto fear and greed index dipping to 27% hinting at a bearish sentiment. Similarly, CRYPTOCAP:BTC lose its dominance over altcoin with the ration pegged as 21% bitcoin and the remaining 79% comprises of all the remaining tokens. This metric hints at a potential altcoin season incoming and NASDAQ:PI is not exempted.
Pi Price Live Data
The live Pi price today is $0.897547 USD with a 24-hour trading volume of $543,904,959 USD. Pi is down 23.67% in the last 24 hours, with a live market cap of $6,122,316,736 USD. It has a circulating supply of 6,821,168,428 PI coins and a max. supply of 100,000,000,000 PI coins.

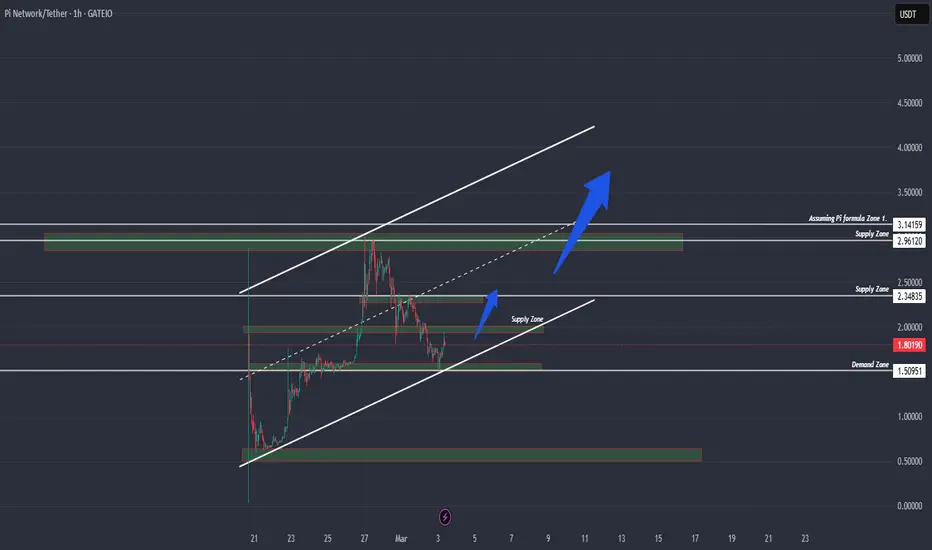
PI ANALYSIS (4H)Given the bearish CH and the formation of multiple supply zones, this asset is expected to move toward the green zone.
Targets are marked on the chart.
A daily candle closing above the invalidation level will invalidate this analysis.
For risk management, please don't forget stop loss and capital management
When we reach the first target, save some profit and then change the stop to entry
Comment if you have any questions
Thank You

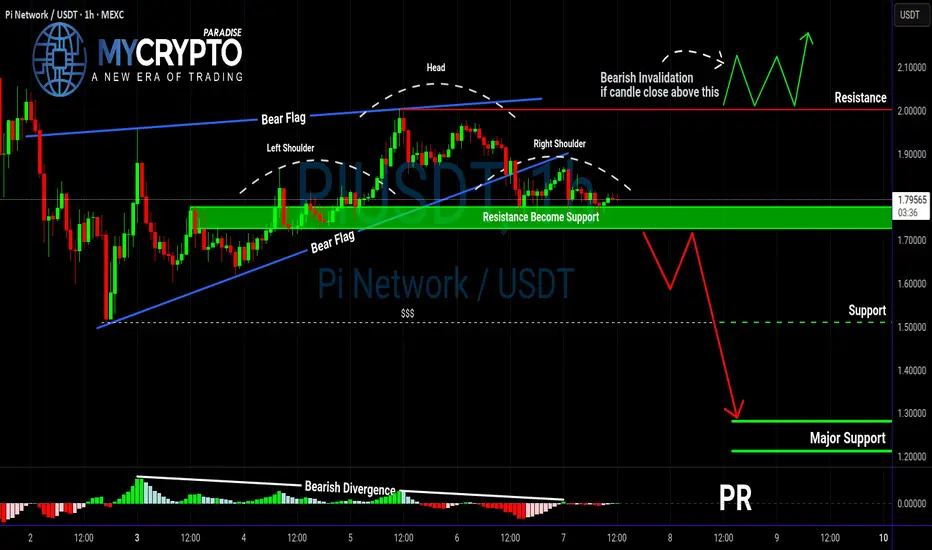
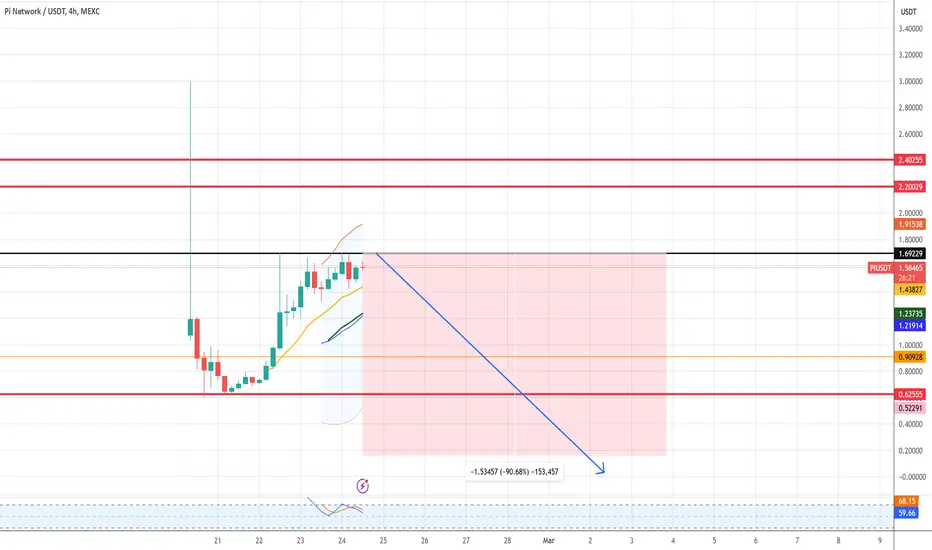
PIUSDT : Head & Shoulders Signals a Major Drop Incoming!Yello, Paradisers! PIUSDT is flashing strong bearish signals! The price has formed a Head & Shoulders pattern right on the resistance trendline of a descending channel—this combination significantly increases the probability of a sharp move to the downside.
💎PIUSDT breaks below the neckline and closed a candle which validates the bearish setup, increasing the likelihood of further downside.
💎However, We have to wait for the proper retest of the neckline, patience is key for the right entry.
💎On the flip side, if PIUSDT breaks above the resistance zone and closes candle above it, the bearish setup will be invalidated.
Stay disciplined and wait for confirmation, Paradisers. A fakeout could trap impatient traders—don’t be one of them! 🎖
MyCryptoParadise
iFeel the success 🌴

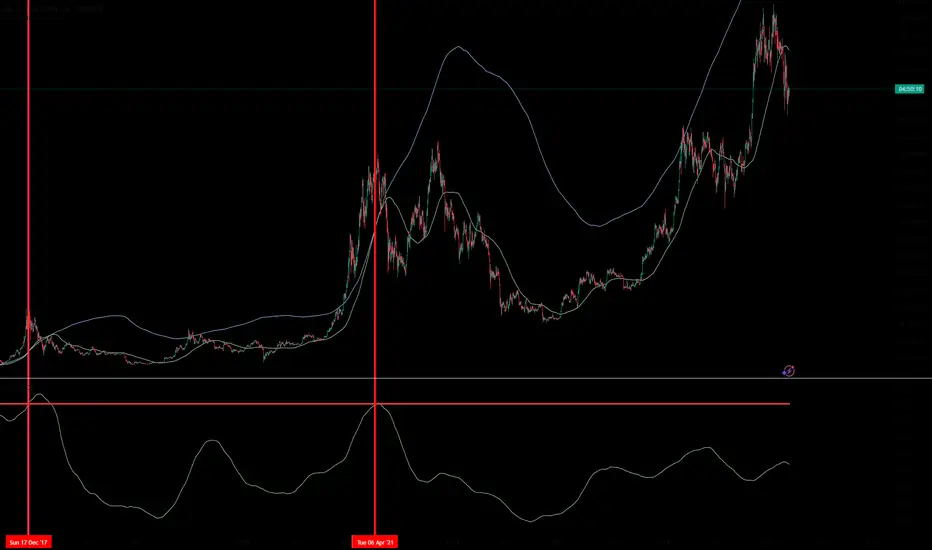
Why the Bitcoin Pi Cycle Indicator will not trigger this cycleIn this post, we’ll take a closer look at the Pi Cycle Indicator and explain why we believe it is unlikely to trigger in this cycle. Instead, we present an alternative signal that may better indicate the true Bitcoin top.
Understanding the Pi Cycle Indicator
The Pi Cycle Indicator has historically been highly accurate in predicting Bitcoin cycle tops. It consists of two simple moving averages:
The 111-day simple moving average (SMA) (blue)
The 350-day simple moving average (SMA) multiplied by two (green)
A signal is generated when the 111-day SMA crosses above the multiplied 350-day SMA, which is marked by a red vertical line.
Why This Signal Alone Isn’t Enough
While this signal has been useful in the past, we believe it doesn't provide the full picture—specifically, it doesn’t indicate how strong the crossover is. By transforming this indicator into an oscillator that measures the ratio between these two moving averages, we gain a more nuanced perspective:
In the chart, the green line represents the ratio between the two moving averages. When it crosses above the red horizontal line (ratio > 1), a Pi Cycle signal occurs (marked by a red vertical line). Notably, the 2017 signal was significantly stronger than the 2021 signal, suggesting a pattern of diminishing returns. We highly recommend checking out our post on diminishing returns and the overall timeline for the current cycle here . Additionally, we've developed our own Bitcoin model that factors in the effects of diminishing returns. Check it out here .
The TRUE cycle top signal
The key question is whether this diminishing return is strong enough to prevent a signal from forming in this cycle. Based on our analysis, we believe it is.
By extrapolating this trend into the future using a white diagonal trend line, it becomes clear that the ratio will likely remain below 1, meaning no crossover is expected this cycle.
Instead, we anticipate that the next Bitcoin top will occur at a ratio of approximately 0.9 , as indicated by the orange area on the chart.
In summary, while the Pi Cycle Indicator has been a reliable tool in previous cycles, its diminishing strength suggests that it may not trigger this time. Rather than relying solely on this metric, we suggest considering looking deeper into the true value of this indicator instead.
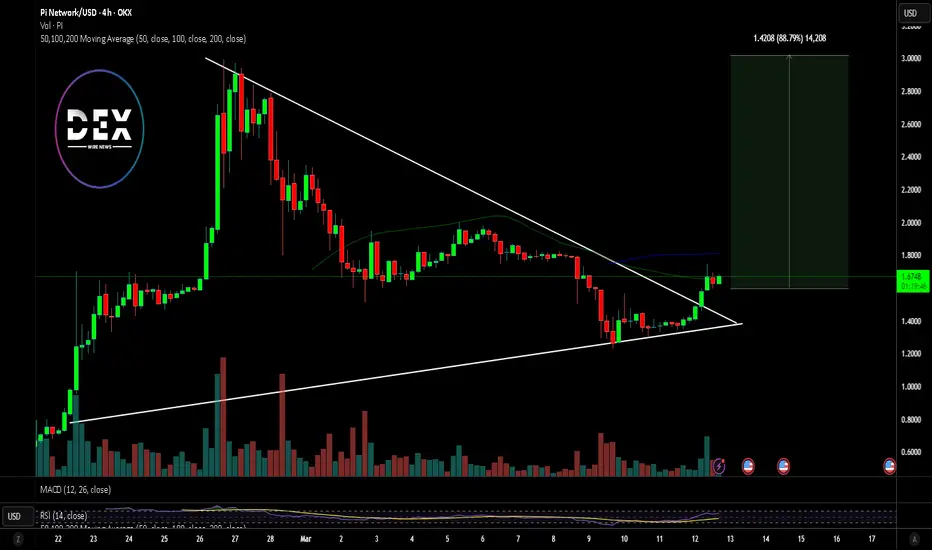
$PI Set for Massive Breakout Amidst Bullish Symmetrical TriangleThe long-awaited launch of NASDAQ:PI has ignited excitement in the crypto space. After six years of mining, Pi Coin finally hit the open market last month, and its price action suggests a potential major breakout. With a bullish symmetrical triangle pattern forming and key technical indicators aligning in its favor, NASDAQ:PI is gaining traction among investors and traders alike.
Technical Analysis
Pi Coin is currently trading at $1.66, having surged 22.75% in the last 24 hours. Its 24-hour trading volume stands at an impressive $811,256,445, indicating strong market interest.
Symmetrical Triangle Formation
A symmetrical triangle is often considered a continuation pattern, signaling a potential breakout in the direction of the prior trend. NASDAQ:PI recently broke out of this bullish formation, setting the stage for further upside movement.
The Relative Strength Index (RSI) sits at 62, suggesting increasing buying pressure. An RSI above 70 typically signals overbought conditions, but with room for growth, NASDAQ:PI is positioned for an extended bullish campaign. If buying pressure intensifies, NASDAQ:PI could soon breach the key psychological resistance at $2, with the next pivot point set at $3.
Market Capitalization and Trading Volume
NASDAQ:PI boasts a live market cap of $11.91 billion, with a circulating supply of 7.15 billion coins. Such a high ranking underscores the coin’s growing adoption and market confidence.
Conclusion: What’s Next for Pi Coin?
With strong technical indicators and a solid fundamental foundation, NASDAQ:PI appears well-positioned for continued growth. If the buying momentum sustains, breaking the $2 resistance could open the door for a push towards $3. Meanwhile, its unique approach to mining and real-world adoption potential make it an intriguing project for long-term investors.
PIUSDT Breakdown Incoming? Bearish Patterns Are Stacking Up! Yello, Paradisers! Is PIUSDT about to break down hard? The charts aren’t looking great, and the confluence of bearish signals is something we can’t ignore.
💎PIUSDT has formed a bear flag on the higher timeframe, a classic continuation pattern that suggests further downside. This alone is already a bearish signal, but there’s more.
💎On the lower timeframe, we can see a head & shoulders pattern forming, along with bearish divergence. These factors together significantly increase the probability of a move to the downside.
💎In the case of PIUSDT breakdown and closes candle below the support zone, this will confirm the bearish setup and likely trigger selling pressure. A breakdown at this level would validate both the bear flag and the head & shoulders pattern.
💎If the price bounces from here, the bearish bias still remains, but there’s also a chance that the market is setting a trap within this range. This makes it a high-risk zone, so it’s better to avoid trading here until a clearer move develops.
💎However, If the price breaks and closes candle above the resistance zone, the bearish outlook will be completely invalidated. In that case, it’s smarter to wait for a more defined price action before making any moves.
🎖Patience is key, Paradisers. The market loves to shake out inexperienced traders before the real move happens. Stay disciplined, focus on high-probability setups, and trade like a pro. Only those who truly understand market cycles will capitalize in the end!
MyCryptoParadise
iFeel the success 🌴
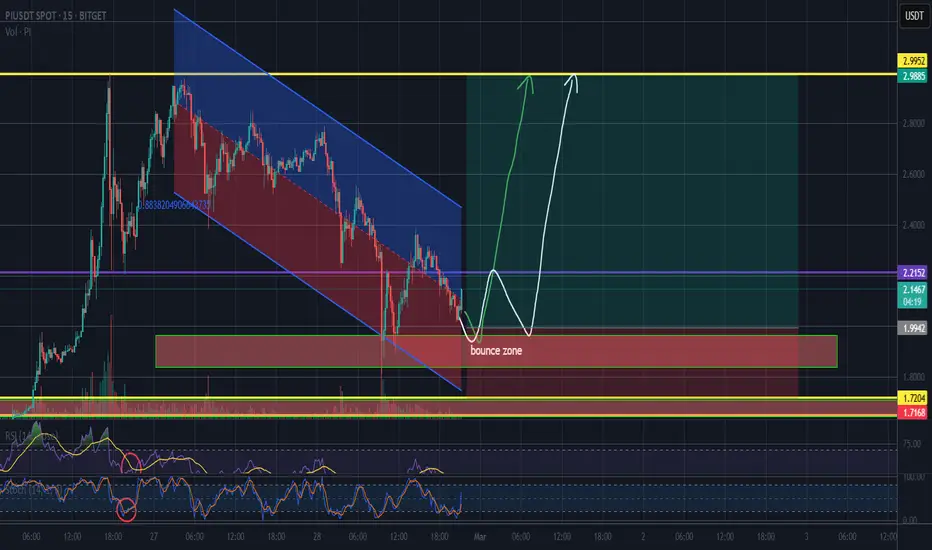
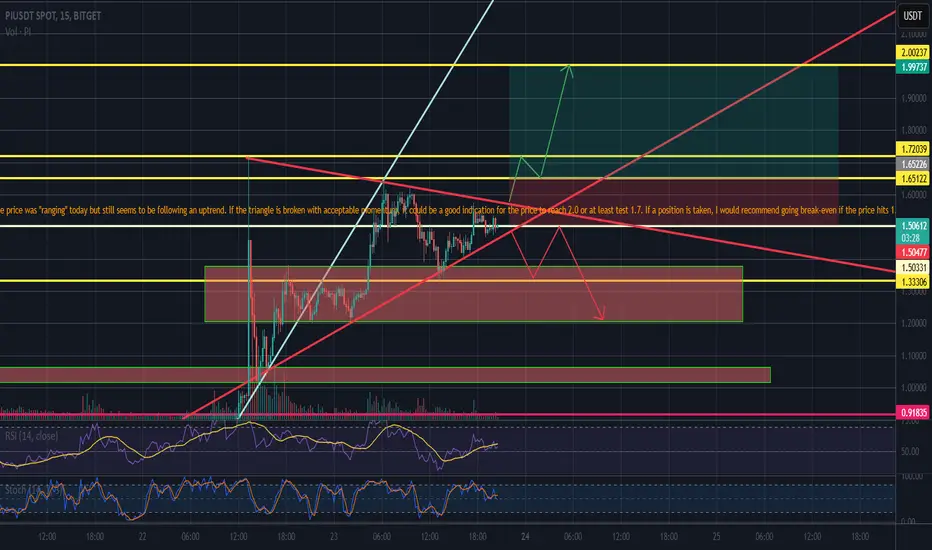
Bollinger Squeeze and resistance break to go longA squeeze on the Bollinger Bands could be happening in the coming days. This usually indicates consolidation, and an exit from such a pattern is generally explosive. You can see that it has already happened once on Pi.
So, a good squeeze on the BB followed by a breakout of the 'bounce zone' would be a strong long position, with a stop-loss (SL) around 1.6.
The previous analysis suggested a long position, but the price did not respond accordingly to the support, so I hope you didn’t enter a long position.
That's it for today. Have a good week, guys!

TradeCityPro | PI: Detailed Crypto Analysis and Insights👋 Welcome to TradeCity Pro!
In this analysis, I want to review PI, which has been highly requested in the comments. This project was one of the oldest crypto airdrops, and its coin has finally been launched. Now, I want to analyze it for you.
✨ This coin doesn’t have much chart history, so I will analyze it using the 4-hour and 1-hour timeframes.
⏳ 4-Hour Timeframe
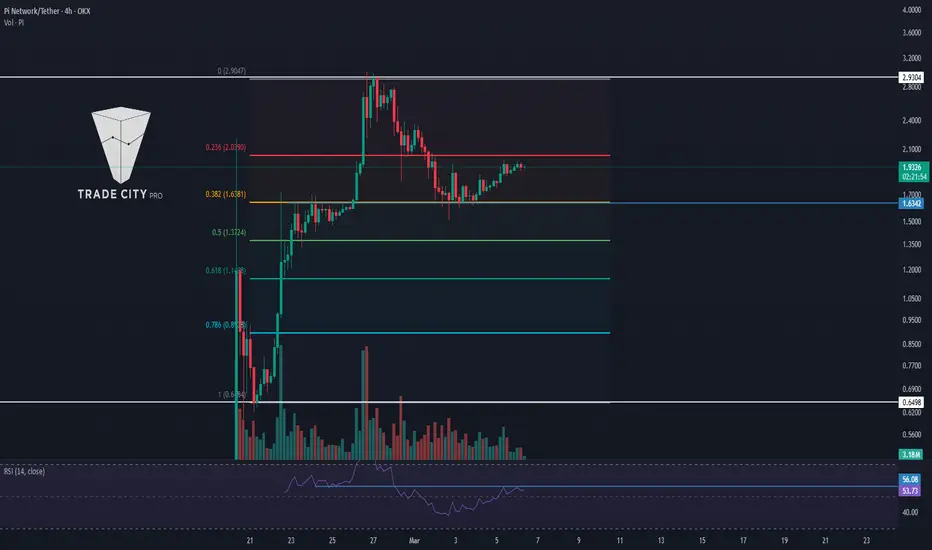
On the 4-hour timeframe, as you can see, after the launch of this coin, we saw a massive bullish leg, moving from $0.6498 to $2.9304. Currently, the price is undergoing a correction phase.
📊 Volume initially surged during the launch, which is expected, but it has been decreasing during the correction. RSI is also near the 56.08 trigger, and if this level is broken, strong momentum could enter the market.
🔼 The correction has continued to the 0.382 Fibonacci level, and it seems that a range has formed between the 0.382 and 0.236 Fibonacci retracement levels. If the top of this range is broken, we can enter a long position.
📉 If the correction continues, the next important levels are 0.5, 0.618, and 0.786 Fibonacci retracement levels, and we have to see which level the price reacts to.
⏳ 1-Hour Timeframe
On the 1-hour timeframe, we can see price movements in more detail.
🧲 As you can see, after the price hit the $1.6342 low, it has been forming a bullish structure and has now reached the $1.9807 level.
📈 If this level is broken, we can enter a long position. The next resistance level is $2.3479.
💥 The RSI oscillator is in a sensitive zone, and as long as it stays above the 50 level, market momentum remains bullish. However, if $1.8770 is broken, we can enter a short position.
📝 Final Thoughts
This analysis reflects our opinions and is not financial advice.
Share your thoughts in the comments, and don’t forget to share this analysis with your friends! ❤️
Pi Network in the bullish term. All right, there is lots of rumors saying that Pi Network will fail, will go to zero, will fall like brick untill nothing. When ever the trade already online and the market took place, the price wont easily drop like a brick or easily flying like a rocket. There must have a support and resistance in the chart and graph, when it already in the online financial/crypto trade market.
Things will be so cool, when Trump will host a first ever crypto summit in this coming 7 March. Attendees will include prominent founders , CEOs, and investors from the crypto industry as well as members of the President's Working Group on Digital Assets.
When ever the announcement, the investors are just in second into the fast click to invest in the crypto. This will be a massive, and astonishing event in crypto ever.
Looking forward the Pi Network proce goes up to $10.00 in few weeks.
Bullish opportunity in Pi Network ROAD TO 3.14151. Price dipped after hitting 3.0 but thats not the target(at least not yet).. that why a lower low ahs not been created yet
2. We have MSS supported by a H3 OB+
3. We have price finding strength above the H3 OB+ Wick
since Pi is 3.1415 there is a high probability of it hitting 3.14 price

Wait for the bounce ...The price has already tested the support and failed to break it. The best thing to do now is to wait for a re-entry into the zone with an upswing and good momentum. Do not take a position if the price exits slowly. Wait for another re-entry or a different type of signal, like a retest of the new upper resistance.
A good SL could be the previous resistance, which can now act as strong support.
Have a great weekend, everyone!
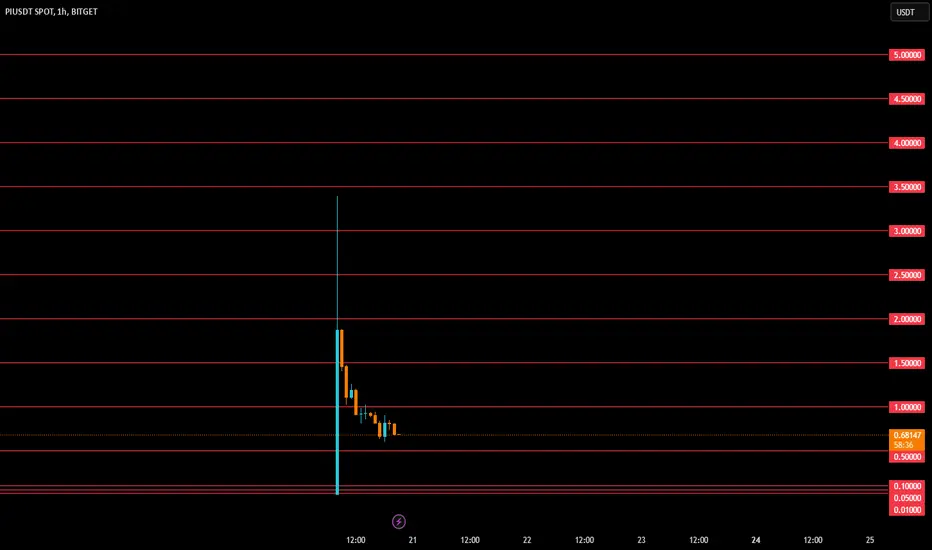
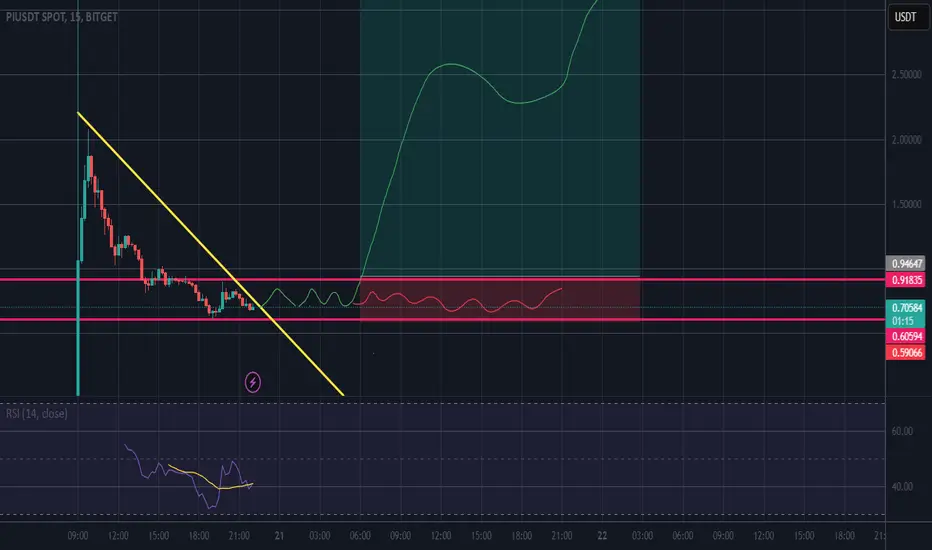
Best LevelsGeneral Observation:
📉 Strong Bearish Candles: After a sudden price spike, the price has undergone a sharp correction, forming strong bearish candles.
📊 Support & Resistance Levels: Several key levels are marked on the chart:
🔴 Resistance Levels: 1.00, 1.50, 2.00, and higher.
🟢 Support Levels: 0.50, 0.10, 0.05, and 0.01.
📉 Trading Volume: Initially high but then declined, indicating seller dominance and weakening buyer strength.
⚠️ Possibility of Further Decline: The price is near the 0.70 support. If broken, further drops to 0.50 or even 0.10 could follow.
🚀 Bullish Scenario: If the price reclaims 0.80, an upward move towards 1.00 might occur.
Amazing day for Pi – what's to come?Today was a big day for Pi. We are getting closer to the ATH of 3.4.
The market should not have any reason to reverse in the coming days, but it's important to watch the new level of 3.0 that we need to break. The price can range or continue to retrace a bit (to the SL zone). Another possible scenario is a bearish triangle break (green arrow), which Pi seems to do a lot since the launch.
You should have all the important levels on the graph to help you make decisions in the coming days.
Have a good week, guys!

Breaking: $PI Surges to $3 Before Retracing Amidst Market DipThe cryptocurrency market witnessed a surprising move as Pi Network ( NASDAQ:PI ) surged past its all-time high of $2.70, reaching an impressive $3 before a sharp retracement brought it back to $2.21. This remarkable 70% surge caught traders and investors off guard, demonstrating the unpredictable nature of the crypto space.
Technical Analysis
At the time of writing, NASDAQ:PI remains up 38.59%, with technical indicators showing a mix of bullish and corrective signals.
The 1-hour RSI sits at 59.47, indicating that buying pressure remains present but is gradually slowing down. The psychological $2 resistance zone has now been decisively broken, which could turn into a new support level. A potential retracement to $1.60, the ceiling of the bullish symmetrical triangle, may occur before another major upward push.
While the initial rally was explosive, the decline in buying momentum suggests a temporary cooldown before the next leg up.
If NASDAQ:PI can hold above $2, it could establish a solid foundation for another attempt at higher price levels. However, if selling pressure continues, the $1.60 level will be a critical area to watch for a rebound.
What’s Next for NASDAQ:PI ?
If bullish momentum returns, NASDAQ:PI could attempt to reclaim the $3 level and push toward new highs. However, if the price continues to decline, $1.60 will serve as a crucial support level before another breakout attempt. Traders should monitor RSI trends, volume shifts, and key resistance zones** for further confirmation of the next move.
With the $2 psychological barrier now broken, NASDAQ:PI ’s price action in the coming days will be crucial in determining whether this was a one-time event or the beginning of a sustained bullish trend.

PI Network token purchase pointshello friends
Due to the good growth of this token, now in case of correction, we can buy step by step within the specified limits and move with it to the specified goals.
*Trade safely with us*
Price Prediction for Pi Network: The Crash Is Inevitable $0.005For those still holding onto Pi with the hope of future gains, it's time for a serious reality check.
🔍 Why Pi Network Is Destined to Collapse:
Illegal KYC Practices Under Investigation:
Apple and Google are actively investigating Pi Network’s highly questionable KYC process, where random users - not official employees, are allowed to review sensitive personal information, including passports and ID documents.
This is in violation of data privacy laws such as the GDPR (General Data Protection Regulation) and other global data protection standards.
If these investigations lead to the app being removed from the Google Play Store and Apple App Store, the Pi Network ecosystem will collapse overnight.
A Centralized Ponzi Disguised as Crypto:
Despite the crypto façade, Pi Network is entirely centralized, operating through a single app where all transactions and mining are controlled.
The referral-based system strongly resembles a Pyramid scheme, with rewards heavily dependent on recruiting new users instead of delivering any genuine utility.
Whale Manipulation & Market Extraction:
Recent price movements show clear signs of whale manipulation - a tactic used to pump up the price, extract as much value as possible from retail investors, and leave smaller holders with the losses.
The latest pump seems to have created just enough liquidity for a massive final dump.
📉 My Prediction: Imminent Crash Ahead
Short-term target: Expect PI to fall to $0.20 as whales continue to unload their holdings, draining liquidity from hopeful investors.
Mid-term collapse: Within the next few weeks or months, the price could plummet to as low as $0.005 as legal investigations intensify and user trust erodes completely.
Long-term outlook: Once the app is removed from major platforms, and regulatory action kicks in, the Pi Network could become entirely worthless - similar to what happened with BitConnect.
❗ Final Thoughts:
If you're still holding onto PI thinking a turnaround is possible, you’re risking everything on a collapsing pyramid. The recent pumps aren’t a sign of strength - they’re the final attempts by insiders to extract whatever value remains from unsuspecting holders.
The Pi Network isn’t just another failing crypto project—it’s a glorified fraud that has preyed on vulnerable communities, exploiting users' data while delivering zero real value.
Don’t be the last person left holding the bag when the inevitable crash happens. 🚫💥
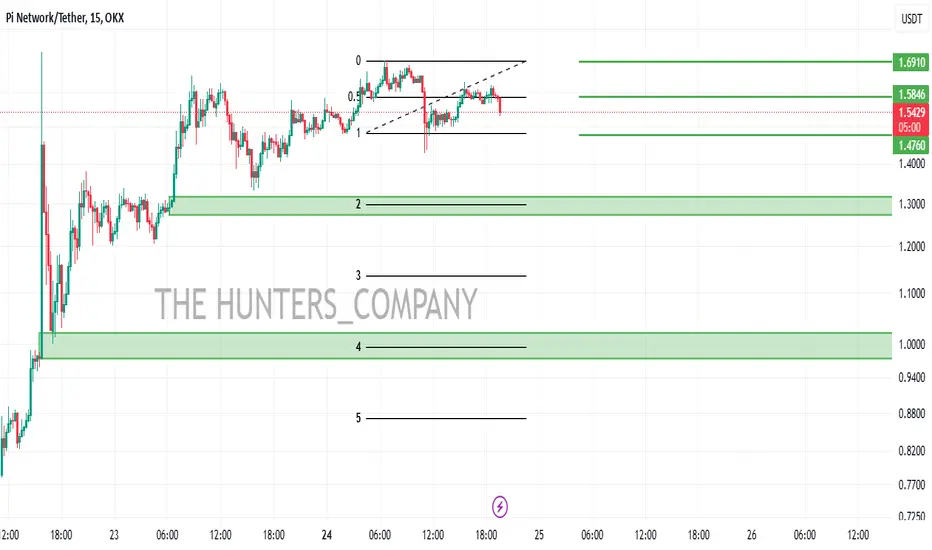
Bull run continuation if the triangle squeeze is broken.The price was "ranging" today but still seems to be following an uptrend. If the triangle is broken with acceptable momentum, it could be a good indication for the price to reach 2.0 or at least test 1.7. If a position is taken, I would recommend going break-even if the price hits 1.7.
If you want to try to short, you also have some hints on the graph.
Good luck, everyone, and see you soon!
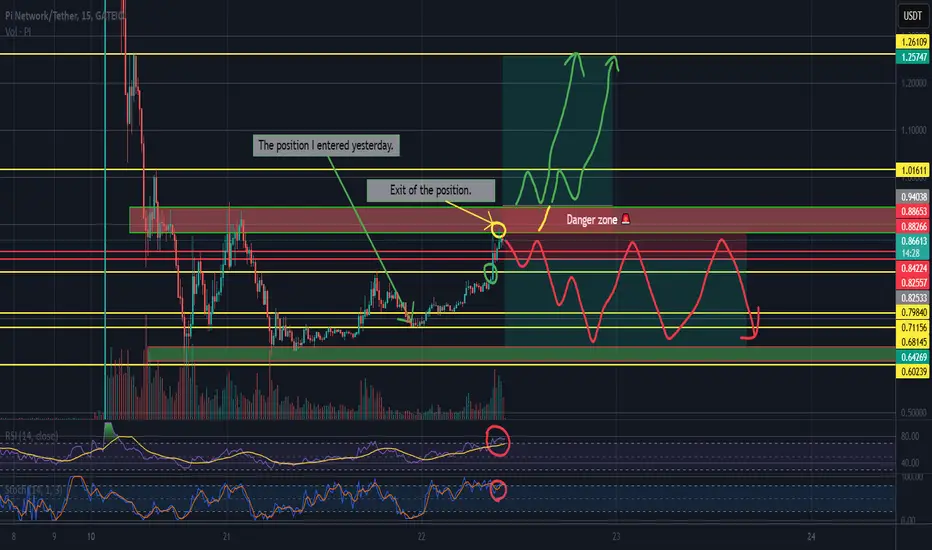
Possible start of a range or a breakout above 0.9.As mentioned in the previous analysis I posted here , the 0.8 is finally broken, and the price even topped at around 0.9. Now, the key is to look for a reversal that confirms entry into a possible range. However, if 0.9 zone breaks, the next levels to aim for are the yellow levels marked on the graph.
Have a good week-end.
Dont fall for the panic sellThe price has settled at a really good level, around 0.7, after a panic sell. This is a really good sign. There is almost nothing to lose by waiting a bit longer for the European and U.S. exchanges to open.
See you soon, guys.
Is There Hope for $PI Network?The highly anticipated mainnet launch of the Pi Network, a project that had garnered a massive following of over 10 million users, was expected to be a watershed moment for the cryptocurrency market. However, the aftermath of the launch has left traders and investors reeling, as the PI coin witnessed a staggering 99% drop in value within hours of listing.
A Case of Overhyped Expectations
The Pi Network's mainnet launch was expected to be a game-changer, marking the transition of the PI coin from a testnet-based digital asset to a fully tradable cryptocurrency. With a massive user base and major crypto exchanges like MEXC announcing pre-listing trading, expectations were sky-high. The limited initial circulating supply of 1 billion tokens out of the total 9.7 billion was anticipated to create a supply squeeze, potentially driving prices higher. However, the reality played out quite differently.
This lack of clarity has led to a situation where the coin's value is largely driven by speculation, rather than any underlying fundamental value. As a result, when the mainnet launch failed to deliver on the hype, the price of the coin plummeted.
Technical Analysis
From a technical perspective, the PI coin's chart is a picture of despair. The token's price surged past $330 in the aftermath of the mainnet launch, only to nosedive to as low as $0.66, marking a dramatic 99.9% drop. The decline has been relentless, with the token currently trading at $0.6766, down 24.48% in the last 24 hours. The Relative Strength Index (RSI) is at 31.87, indicating that the token is oversold, yet the selling pressure continues to mount.
The chart pattern is bearish, with the token breaking out of a falling wedge pattern and failing to show any signs of a reversal. The open interest on the PI token is low, indicating a lack of conviction among traders, and the selling pressure is overwhelming. Gate.IO is the exchange with the most traded tokens, accounting for 29% of all trades, but even this has failed to stem the decline.
What Went Wrong?
So, what went wrong with the PI coin? The answer lies in a combination of factors, including:
1. Overhyped expectations: The mainnet launch was overhyped, and the market was expecting a moonshot. When this failed to materialize, the price collapsed.
2. Lack of clear use case: The PI coin lacks a clear use case, and the project's whitepaper is vague. This has led to a situation where the coin's value is driven by speculation, rather than any underlying fundamental value.
3. Poor marketing: The project's marketing efforts have been poor, failing to generate significant interest among institutional investors and users.
4. Technical issues: The mainnet launch was plagued by technical issues, including slow transaction processing times and high fees.
Conclusion
The PI coin crash is a stark reminder of the risks involved in investing in cryptocurrency. The project's lack of clear use case, poor marketing, and technical issues have all contributed to the decline. While the token may experience a dead cat bounce, the long-term outlook remains bearish.

Opinion: PI Network So this coin could do what LUNA did or UNI did, BTC has another leg up to 160k+ left during mania I wouldn't be shocked to soo it run to 10-70 dollar area.
It has an interesting supply distribution similar to airdrop/faucet/mined coins; first come first serve just like it was with bitcoin, litecoin, and every other crypto currency (not tokens/pos/premine/etc...), the difference was this was free, all you had to do was press a button. It started in 2019 so about 6 years of supply distribution, and only KYC supply can be taken out. Most of the 100B supply isn't verified; so it'll be illiquid and you'll have about 70 million users with free coins with zero incentive to sell because it was free, that is also 70 million marketers. (lol) People saw what BTC did and what LTC did and KASPA, XRP, XLM and soo on. Valuations mean nothing when you have meme scams like TRUMP or TRUMPINU6900 or LUNC or DOGE etc... soo literally seeing 100B valuation due to illiquid and retard hodl mentality is within reach.
Compare PI charts to UNI or KASPA or LUNC chart. It may actually behave more like XLM/XRP chart. This is a fresh coin at the beginning of it's price history. In this scam market, shapes of patterns will mimic/copy things of similar character.
