Pin Bar

One more time short the ERUUSDToday we got stopped out of our short on the EURUSD. We got faked out, but the mister market is giving us another change :-)
Date Pair Direction Trade Trend Level Signal Entry
2018-12-04 EURUSD Short With trend Down Dynamic Resistance Fakey retrace


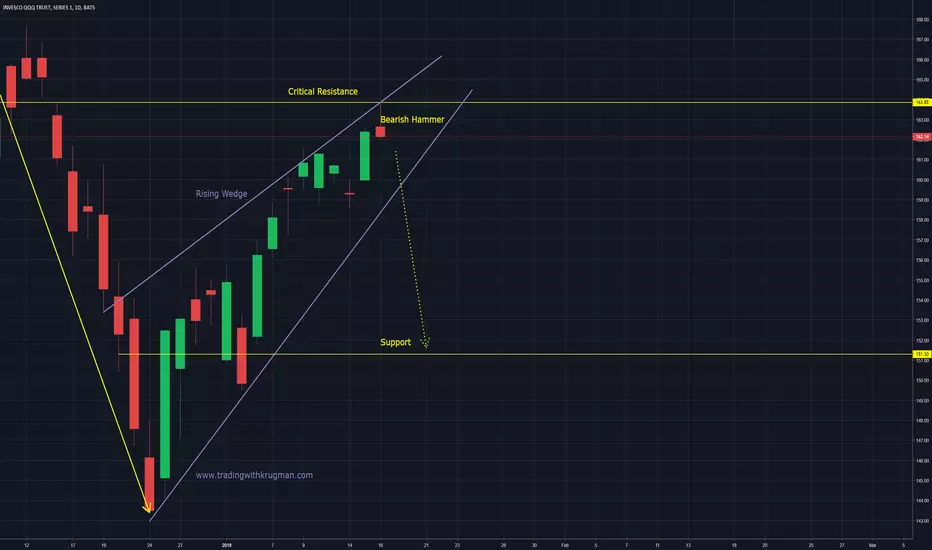
QQQ - Bearish Rising Wedge - Ready to DropThe case for the bearish rising wedge strengthened today as a bearish hammer has now formed off of the upper channel of the rising wedge. This market has been very strong as of late but the overhead resistance, rising wedge, and now bearish hammer should not be discounted. I think risk is to the downside right now (higher probability) unless price as able to push above this rising wedge (lower probability).
To learn more about my trading strategies check out www.tradingwithkrugman.com
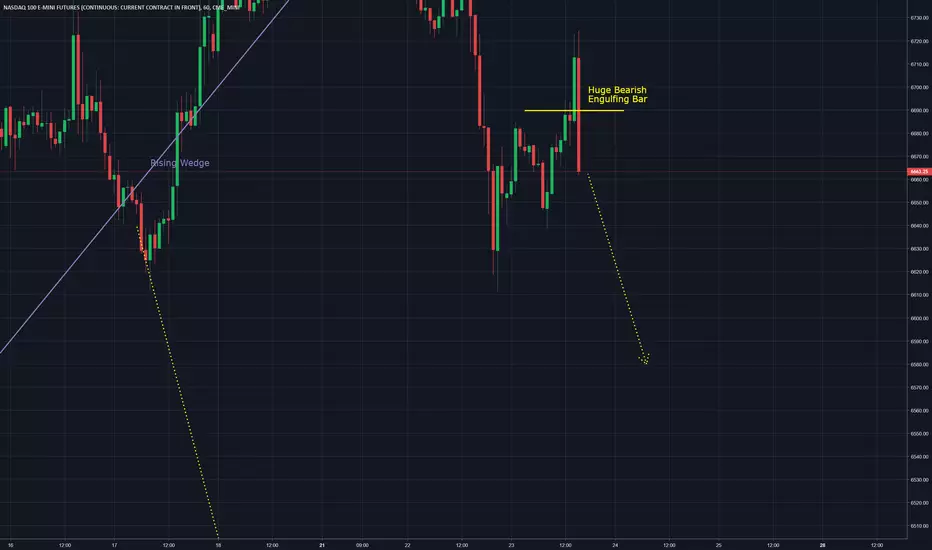
QQQ / NQ - Huge Bearish Engulfing BarA very large bearish engulfing bar has formed on the hourly charts after a failed attempt by bulls to push price higher early in the trading session. This has very bearish implications and near term bias remains bearish.
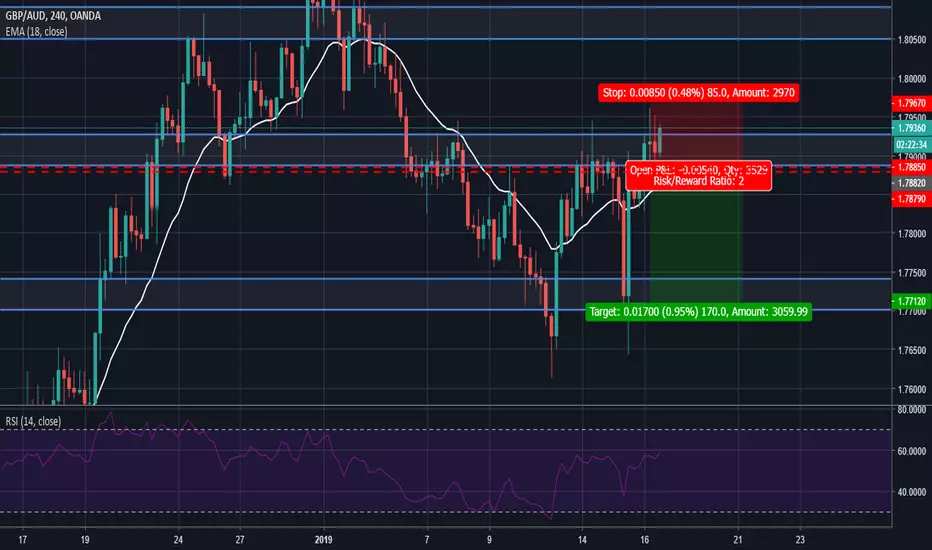
GBPAUD Short SetupAnalysis
-GBPAUD showing signs of reversal after buyers pushed price up into resistance two times but sellers pushed down both times before the 4H candle close.
-This price action resulted in a 4H doji/pinbar setup AT RESISTANCE which is a bearish sign meaning sellers may be stepping in the market.
-There is also RSI divergence on the 1hour chart further suggesting that we may be seeing a selloff soon
Entry, Stops and Targets
-Short Entry: 1.7882
-Stop Loss: 1.7967 (Set stop above the high of the reversal candle with some buffer)
-Take Profit: 1.7712 (Set target 2 times your stop depending on entry)
*Always practice good risk management by risking a maximum of 1% to 2% of your capital on any given trade
QQQ - Ascending Triangle Failure - Bearish BiasAscending triangles tend to be continuation patterns. When an ascending triangle fails that can portend weakness. I have already posted an ascending wedge and overhead resistance that would be downward pressure on the markets. This bullish ascending triangle was the silver lining in that cloud for the bulls but with a failure of that pattern, will it finally be the straw that broke the camels back? Price has pulled back up and is currently testing that ascending triangle. I will be watching for any bearish candlesticks in this area such as bearish pin bars or 2-bar reversals. Otherwise if price rips back up through the pattern then it could push well beyond 6600. For now I maintain a bearish bias to the markets.
To learn more about my trading strategies check out www.tradingwithkrugman.com

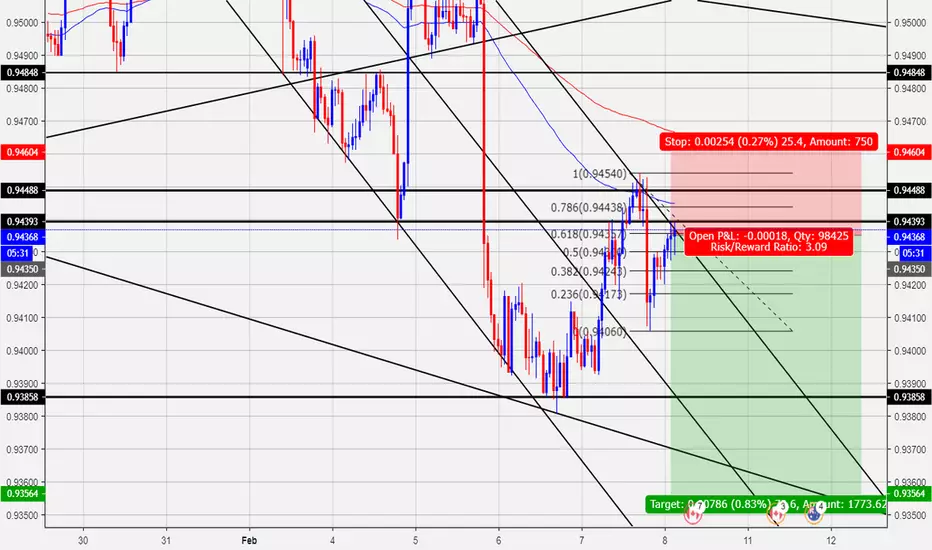
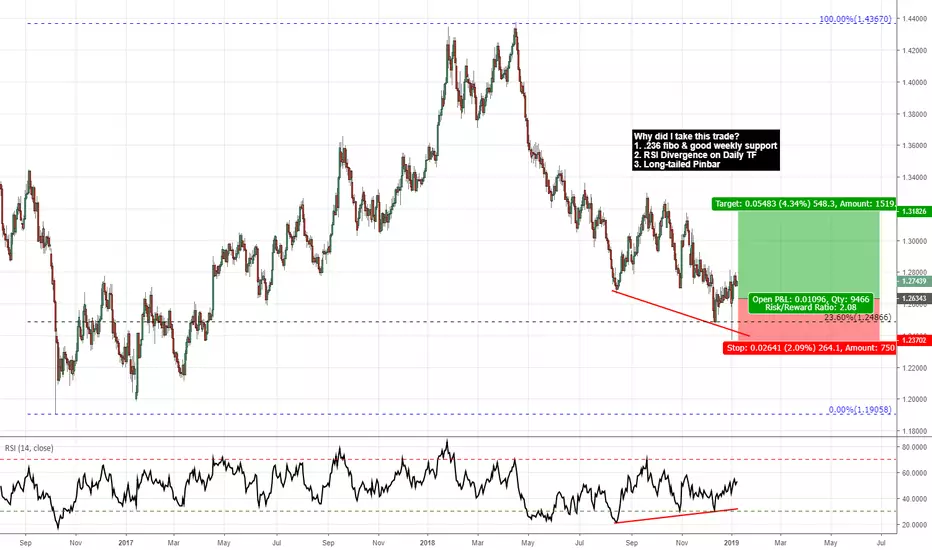
GBPUSD: 2rr long tradeWhy did I take this trade?
1. .236 fibo & good weekly support
2. RSI Divergence on Daily TF
3. Long-tailed Pinbar
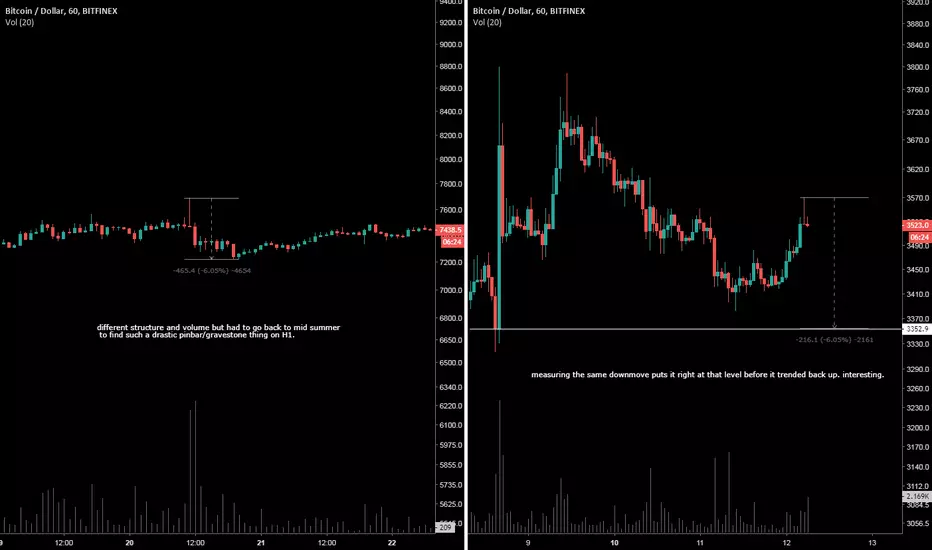
The next BTC SHORT I am taking part in.Greetings guys. It's time to spread my BTC market vision.
First of all my ideas are based on VSA which stays for Volume Spread Analysis.
I have no doubt that Head and Shoulders will work out and we will reach the price of 5k-5.5k-6k.
But before that we should break through many resistance levels meaning that there are some retracements ahead we can try to earn on.
Okay. I see some volume powered sells in past connected with levels of 4080-4170, 4180-4240 and 4315-4395 meaning strong resistance levels.
There is also a 0.786 sells fibonacci level starting from 15 of October. This one is followed by one of the greatest manipulations "BINANCE TETHER SCAM".
There is also a global descending channel with a resistance of 4100-4150.
Collect shorts on 4100-4400 levels and take profits on 4100-3900 levels.
I will open my position after getting candle setup signal of pin bar powered by big volume.
Good luck you are all.

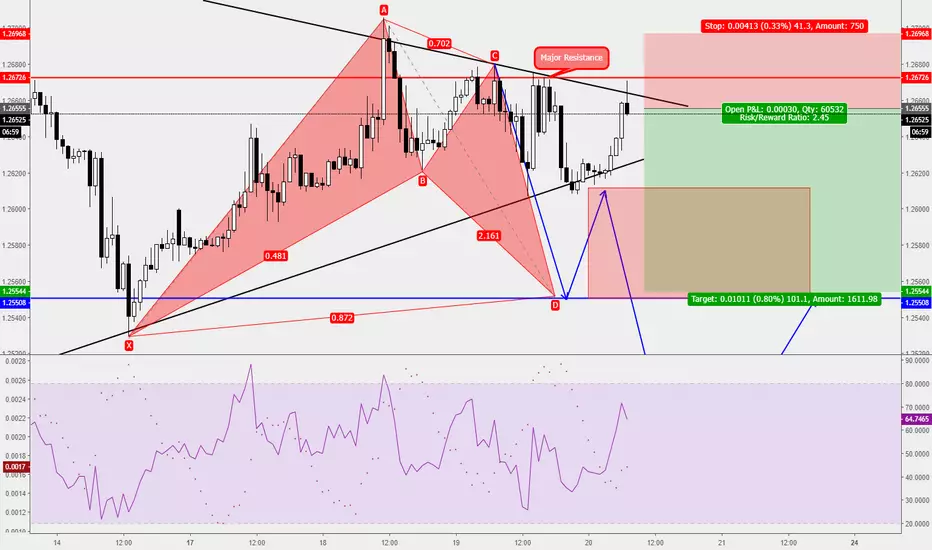
Trade Ideas Analysis: GBPUSD S&RThis is a support and resistance trade, if this candle close on a long shadow candle or better known as a pin-bar, I'm going in on an aggressive short as:
1. Is a Trend Trading Opportunity
2. Market got well resisted by trendline
3. Major Resistance as red line
I've a duo target for this trade, exact level share to my subscribers, check it out on our October 2018 results as we hit a record high of producing 2,333pips of net profit in a Single Month.
forex100academy.com
+2.36RMULTIPLEWedge Pattern + PinBar
Wedge Support Line, Horizontal Support Resistance Line, and EMA 10 EMA 20 are in close proximity to each other.


EurUsd End of Month Trap MoveCheck out 4h, dojis and then 4h bear engulfing closed middle of London
Break and retest of pivot point NY pre open and ran away during NY Friday and last day of month
* Trap false move pre session beginning NY *
* Trap traders long & run away quick short *
More important than pivot point is the psychology behind the banks trap move
Higher TF keeps everything clear

X daily 0.618 and hammer combination long!X had pulled back to the 0.618 of the 6.15-47.6 rally!
Yesterday it had a quite strong bounce off that and formed a daily hammer!
I'll be interesting in taking the long yo
Let's see how it goes!

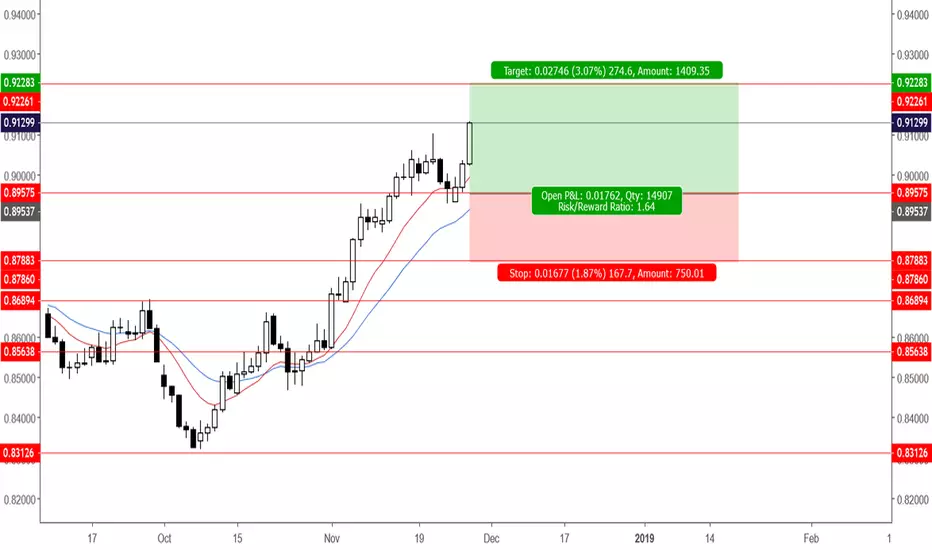
NZDCAD TARGET PRICE 0.92283 | PIN BAR | LONGPin Bar on D1 Chart. This is a "baby" Pin Bar at a Key Level. Pin Bar Tail intersects EMA 10.
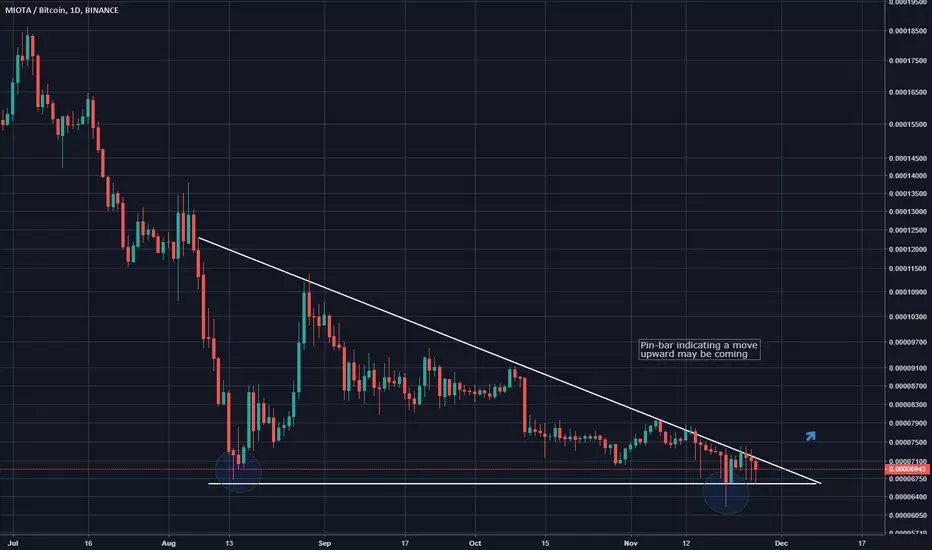
MIOTABTC looking for a move up? End of triangleBINANCE:IOTABTC has held relatively well during the BTC bloodbath of the past days and is reaching the end of the triangle.
The pinbar candle could indicate a move upward is incoming, as seen last time this happened.
Short on AUDCADAfter a pullback over 3 years, now the AUDCAD is on an important resistance line, and those pin-bars over the D1 T/F is a good sign of reversal. there's no fundamentals ahead. so guys!

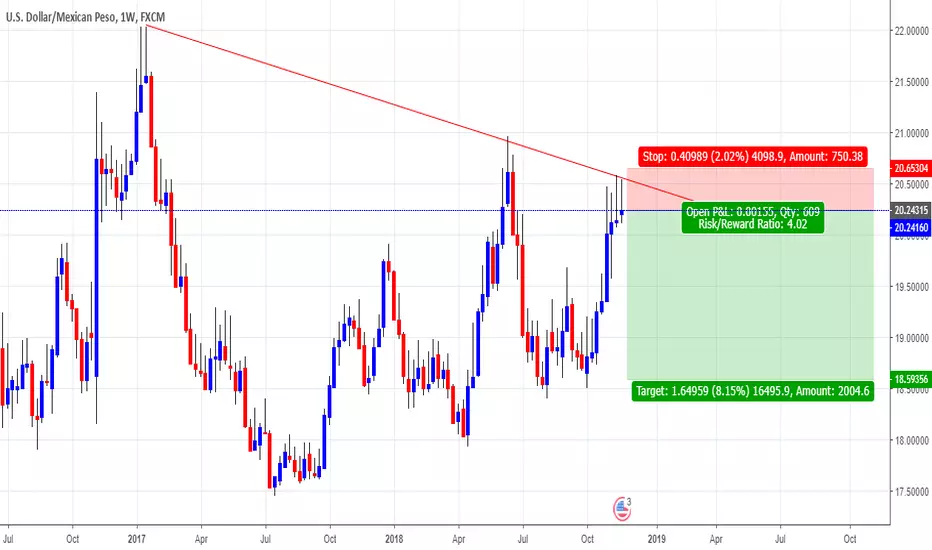
USD/MXN short opportunityHi fellows,
There is an excellent R:R short opportunity on this trade. Price may retest prior week's high so be cautious when opening a position.
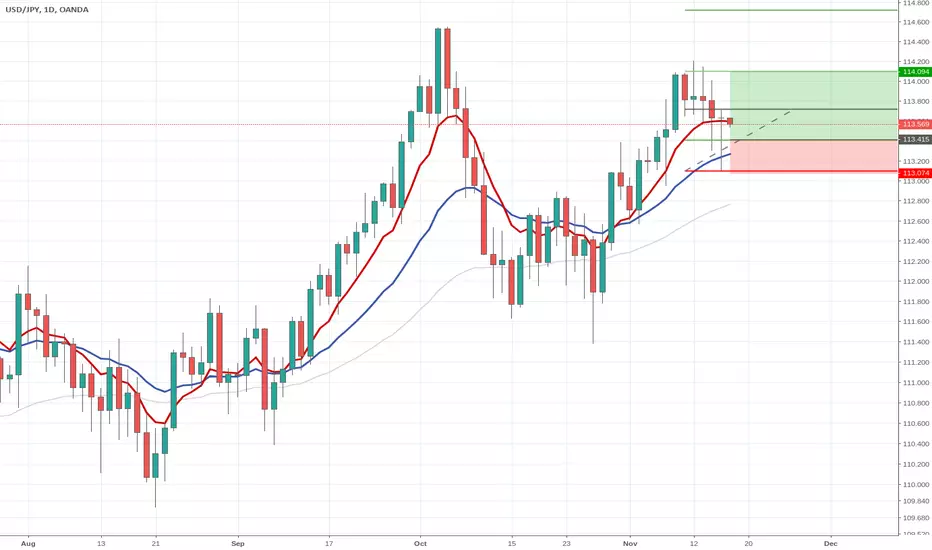
With trend pin barA with trend bullish pin bar formed on the dynamic support by the moving averages.
Trend: Up
Level: Dynamic support
Signal: Bullish pin bar
Trade: Long with trend
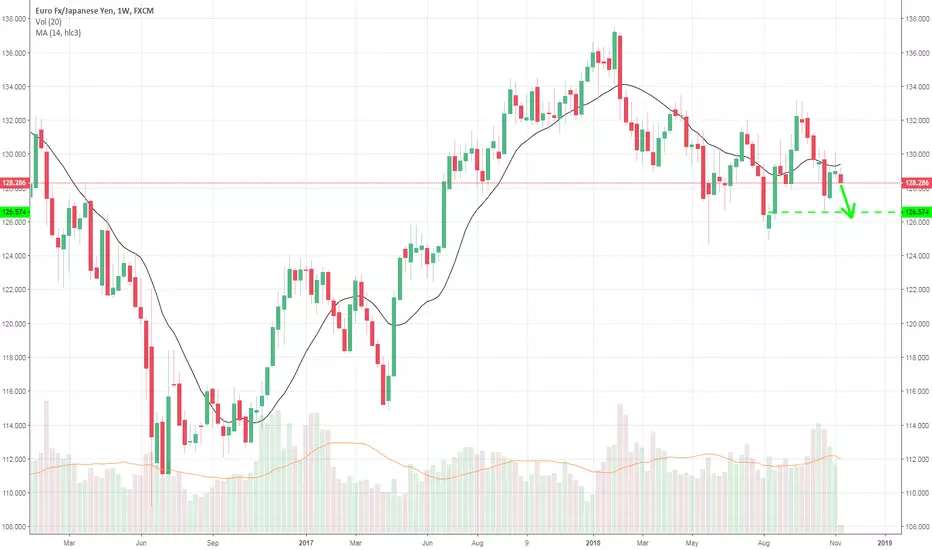
EURJPY - Biggest Yen short covering underwayCFTC data shows YEN bears were at extremes a few weeks back. They have started to unwind their positions and thus accelerating Yen's upside.
Nikkei225 which is in close inverse-correlation with YEN is tracking lower too.
We expect market participants to continue unwinding YEN shorts from over -$12bn short to -$7.5bn, which would transcend into a 2-3 handle move in EURJPY.
Euro bears are currently out in full force and have no reason of squaring positions.
Sugar LongSUGARUSD
Entry
-Above highs of pinbar
Stop
-Below lows of pinbar
Target
-2 times stop
Risk Management
-Risk 1% to 2%
-Ratio: 2:1
