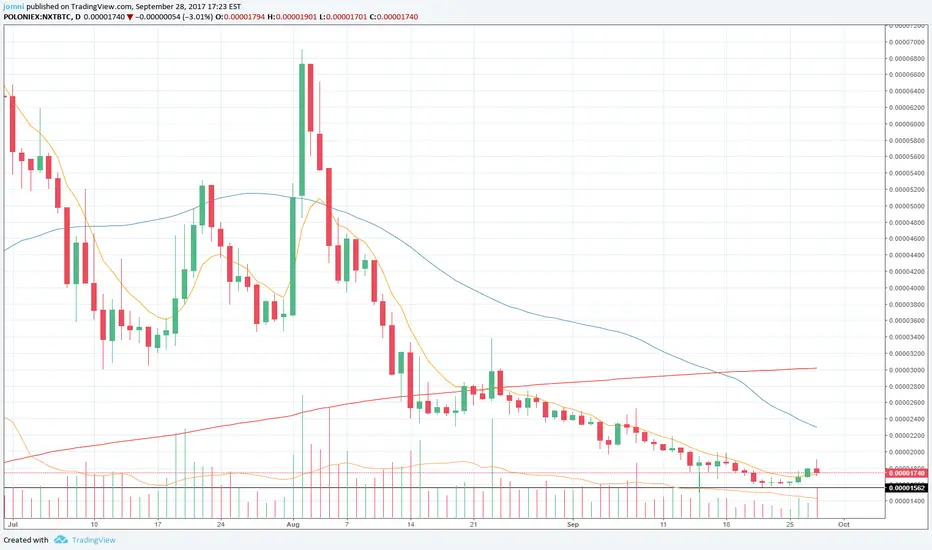
Bearish Pin Bar NXTBTCBearish Pin Bar formed on a general downtrend. Observe price action during the next day.
Pin Bar
Daily Pinbar at Structure: time to retrace?Hi guys,
as you can see on the left hand side of your screen we're up to a previous level of structure. And in doing so, price has formed a nice pinbar showing buying pressure. When i look at the 4 hr chart then, an engulfing pattern appears following a pinbar, and that gives me reasons to believe we could see a reversal at this point. With a little retracement, i'll go long with stops below the lows, and targets as shown.
If you have questions/ideas, please let me know down below.
Otherwise, see you in the next chart!

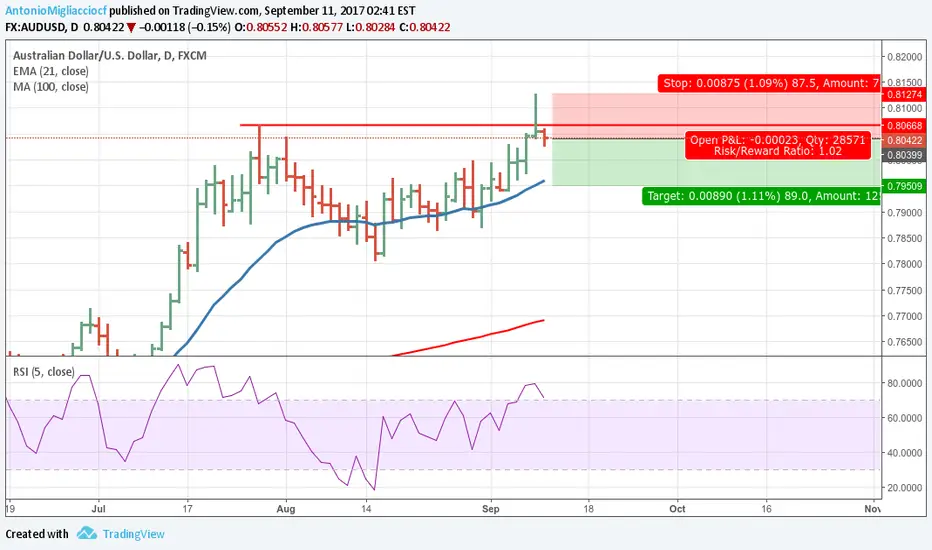
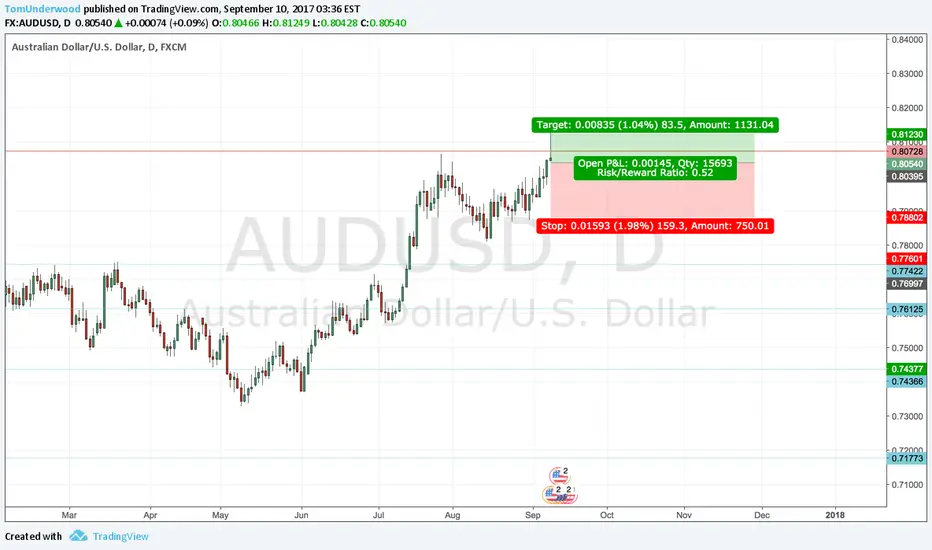
Reversal Pattern at Daily Structure on AUDUSDHi guys,
as you can see on the left hand side of your screen we're up to a previous level of structure. And in doing so, price has formed a nice pinbar showing buying pressure. When i look at the 4 hr chart then, an engulfing pattern appears following a pinbar, and that gives me reasons to believe we could see a reversal at this point. With a little retracement, i'll go long with stops below the lows, and targets as shown.
If you have questions/ideas, please let me know down below.
Otherwise, see you in the next chart!

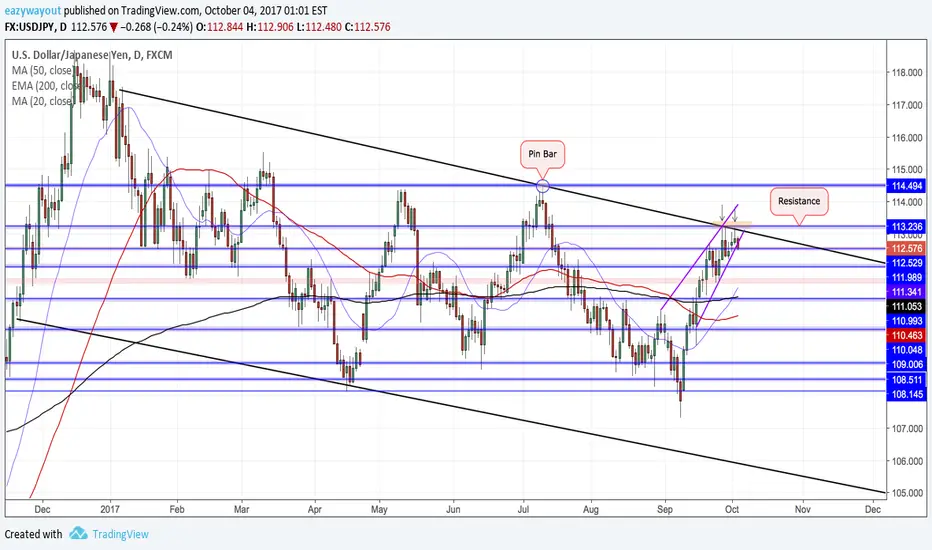
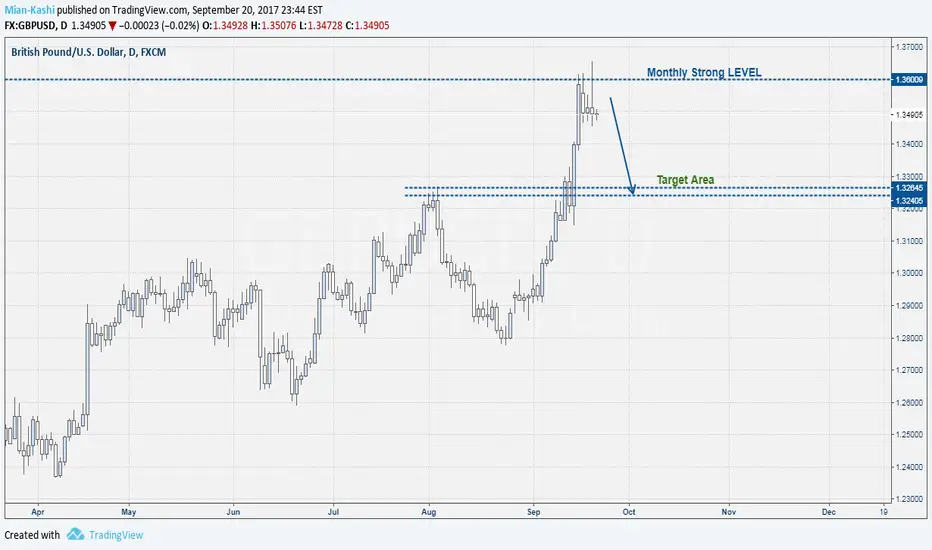
USDJPY DAILY:Price back at the top of its channel, we have multiple rejections to resistance & a pin bar rejecting its downtrend line & strong level as well. I believe it is time for this pair to head down, last time a pin bar rejected at the top of this channel price fell hard. Watching for a break of 112.500 support now.

Trend continuation trade on GBPUSDHi guys,
this time you see a weekly chart side by side with a 4hr chart. I don't usually use the weekly chart but in this case i want to emphasize why am i looking to buy this up: the higher high higher close beyond previous structure is a very strong sign of the strength of the pound right now against the dollar. Therefore, as soon as i get the opportunity, i will consider to buy the sterlin. And here's the chance on the 4hr chart, a reversal candlestick pattern formed by a pinbar+ engulfing candle AT previous daily and weekly structure. All this add togheter and creates the condition for me to take this trade.
With a little retracement, i'll buy with stops below the lows and targets as shown: if we see new highs we could go all the way up to 1,38!
If you want to share your ideas/questions, feel free to comment below.
Otherwise, see you in the next chart!
P.S. Please note this is not an investment advice: this is only the result of my analysis. Be safe!

TCT trade on GBPUSDHi guys,
this time you see a weekly chart side by side with a 4hr chart. I don't usually use the weekly chart but in this case i want to emphasize why am i looking to buy this up: the higher high higher close beyond previous structure is a very strong sign of the strength of the pound right now against the dollar. Therefore, as soon as i get the opportunity, i will consider to buy the sterlin. And here's the chance on the 4hr chart, a reversal candlestick pattern formed by a pinbar+ engulfing candle AT previous daily and weekly structure. All this add togheter and creates the condition for me to take this trade.
With a little retracement, i'll buy with stops below the lows and targets as shown: if we see new highs we could go all the way up to 1,38!
If you want to share your ideas/questions, feel free to comment below.
Otherwise, see you in the next chart!
P.S. Please note this is not an investment advice: this is only the result of my analysis. Be safe!

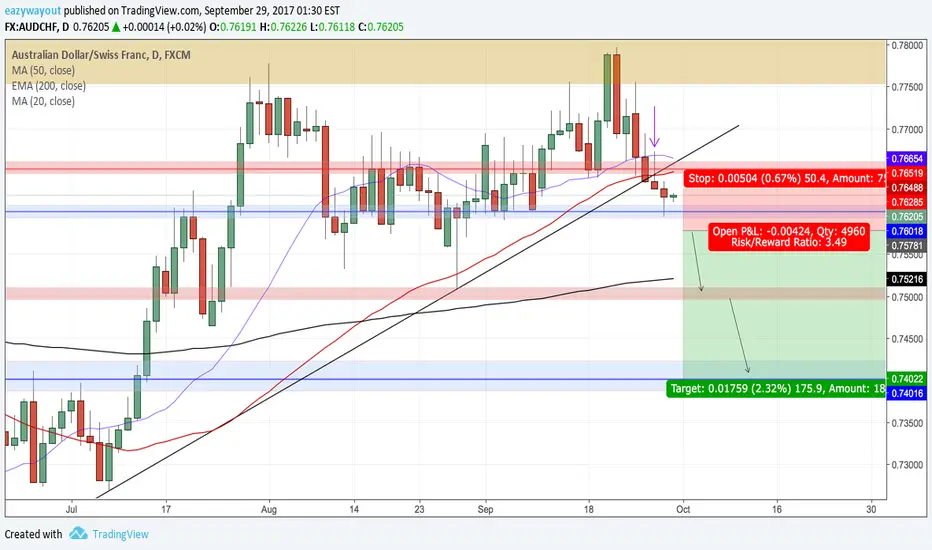
AUDCHF DAILYShort confirmed after break of uptrend line & retest with a pin bar to resistance. Waiting for a break of 0.78000 support to enter as well for extra confirmation.
Trade safe!
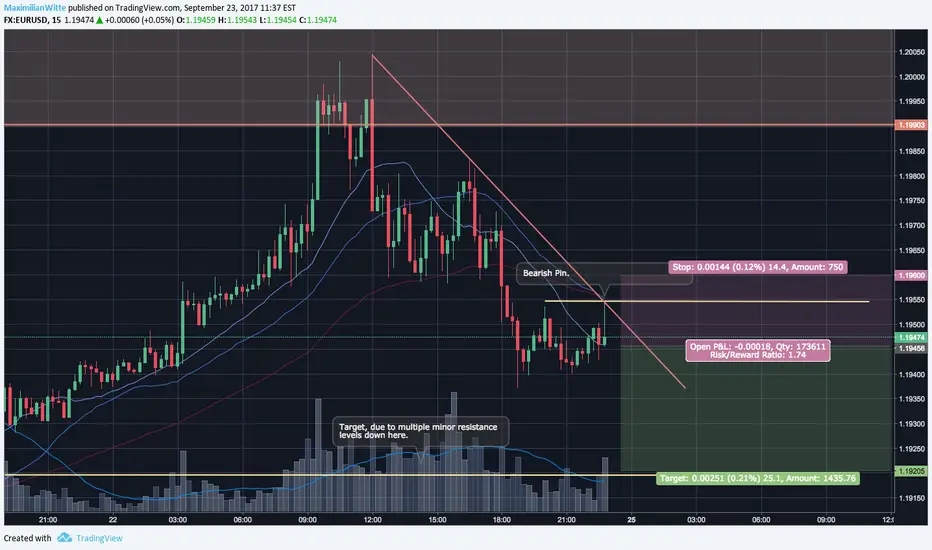
EURUSD 15min Bearish PinbarNice Confluence with the Bearish Pinbar, the Trendline and Moving Averages. Might be a good trade if Market does not Gap too much on Sunday Night.
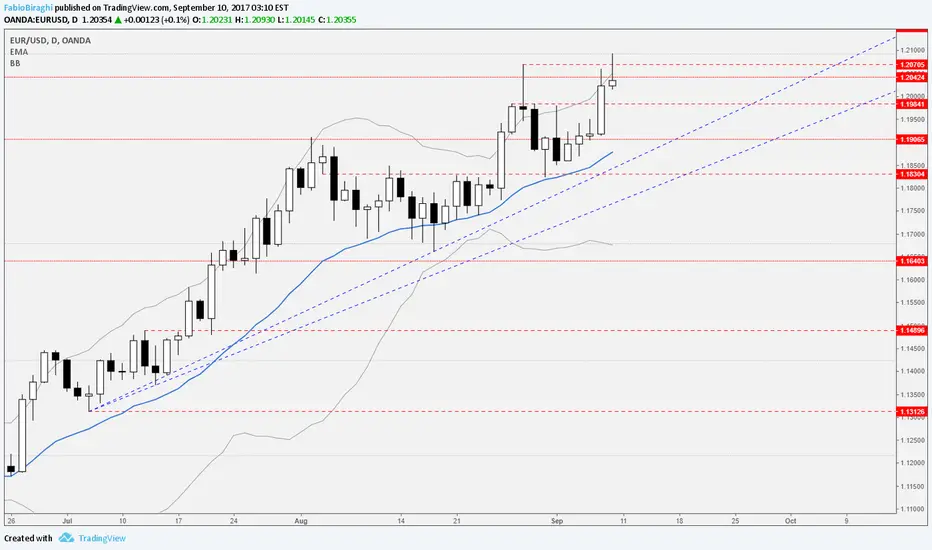
EURUSD ShortLooking at the daily chart is showing us a bullish rejection candle or a pinbar. It has formed just below a major multi-month resistance area.
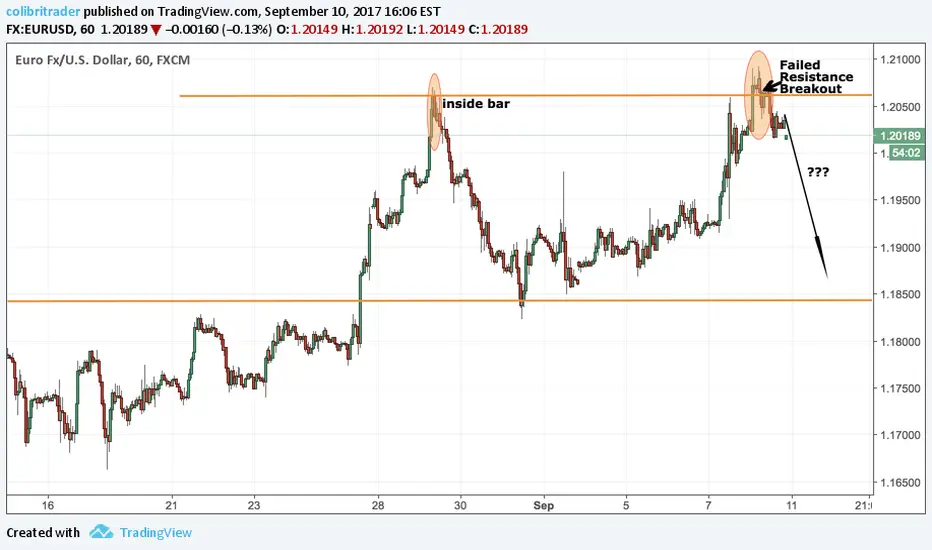
Shooting star EUR/USD @ key level08/09/2017 EUR/USD close below 1.20424 (07/2012 min.)
Candlestick pattern SHOOTING STAR