USDCAD [D] Technical Analysis & Top-Down [BUY]
Good Evening People...
I am FX_HOLE and this is my first published analysis - I have been trading for around 2 years now.
Today, I will be providing a brief Technical Analysis for the USDCAD
I will begin with a ' Top-Down ' Analysis ...
As you can see from the Weekly Timeframe, I have identified a range that has been in place since mid 2015
Over this period of time, we can see that price has tested the resistance and support on a number of occasions
Most recently [ July '21 ] - The support of the range has been tested and following this the market bounced and has been forming higher-highs/lows ever since
Bringing us to today and the section of the chart I will look at more closely on the daily timeframe
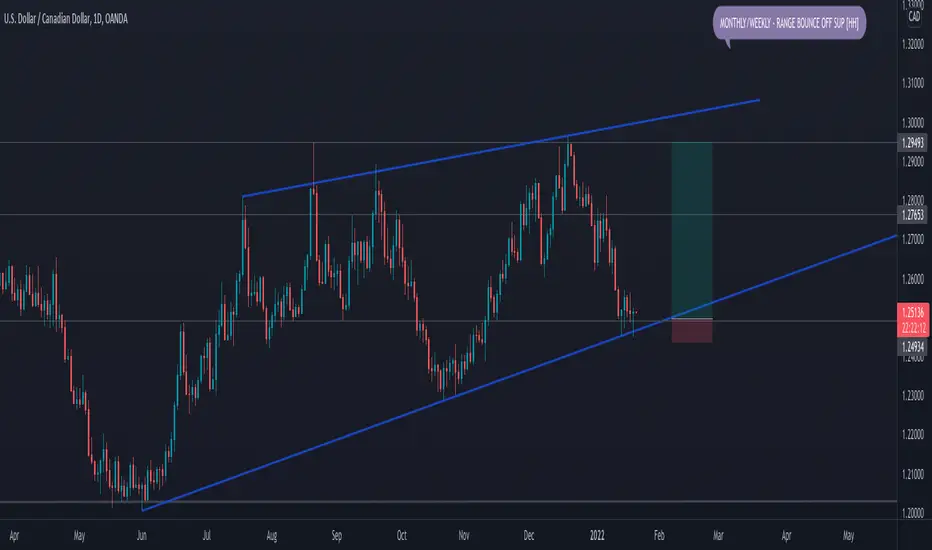
Moving on to the Daily Timeframe...
Using the idea from the Weekly Timeframe of the Higher Highs/Lows - It has been possible to identify an Ascending Wedge Pattern
Upon marking out the wedge pattern, we can see that price has approached the support of the wedge and rejected a further move below
Furthermore, there is additional horizontal support - This providing added confluence to any trade set-up [ @1.2500 ]
Finally, upon todays market close, we can see that the Bullish Pin Bar has been formed - Again, providing further confluence to the trade set-up
So, personally I have set a Buy-Order @50% FIB retracement of the Pin Bar
Additionally, I have marked out initial Profit Targets which are a little adventurous
Although, I may be looking to scale in if we reach my initial target @1.260
NEWS/DATA - There are some orange USD Data Releases coming up tomorrow, but hopefully the order will be triggered throughout the Asian session and make a little progress.
This will be monitored...
Well that's all for today folks - Thanks for tuning in
Enjoy!
Pin Bar
Trade With The TrendIdentify a trend. Draw horizontal key level. Wait for a pin bar to form in a pull back to the horizontal key level. Enter at close price of pin bar.
Trend: Up
Level: Horizontal, EMA 10, EMA 20
Signal: Pin Bar
Charts

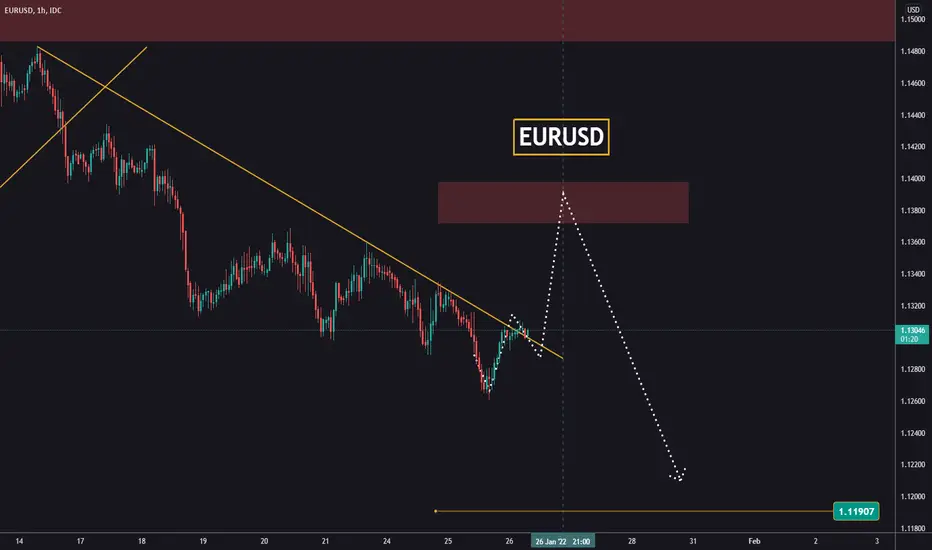
EURUSD before FED Today is the day when we expect the Interest Rate decision for the USD.
It doesn't matter if there will be any changes, we're still expecting some moves.
Because of the news and how risky and unpredictable they are, we suggest looking for an entry only when the news are over!
We think that there is a higher probability that the downtrend will continue.
If, during the news we see price going up to around 1,1400 in the first minutes and then rejecting those higher levels, then that would be a good sell signal.
Quite often, during news you can see how price leaves long wicks in a certain direction to take out the retail traders and it then reverses.
That's exactly what we're expecting to see today, and we have to be patient because we don't know in which direction that wick will occur.
The only thing that's sure is that there will be a lot of volatility and that our analysis tomorrow will look at the potential opportunities after the news.
Good luck!

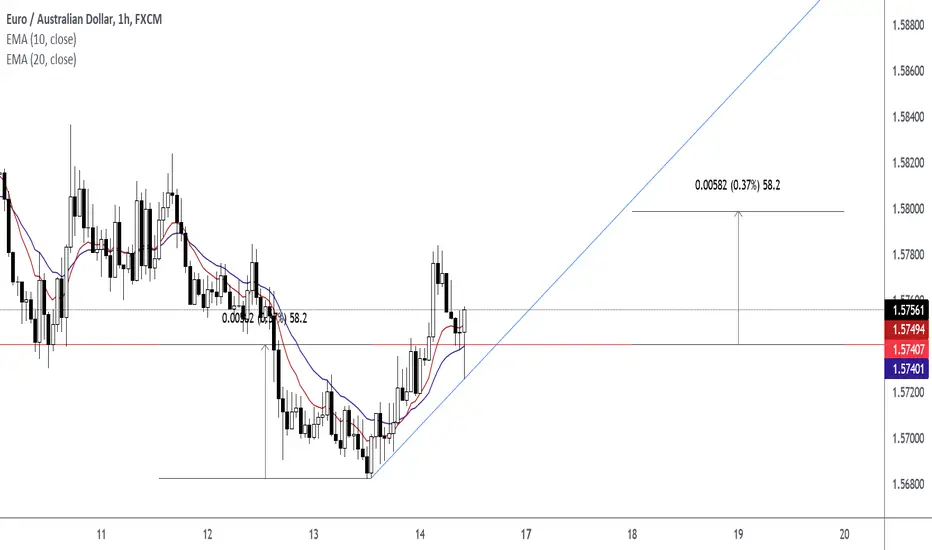
EURAUD Trade Idea From 2022-01-14 at 10:00Ascending Chart Pattern shared on January 14th for GBPAUD and EURAUD currency pairs.
Price closed above level.
Price retested level.
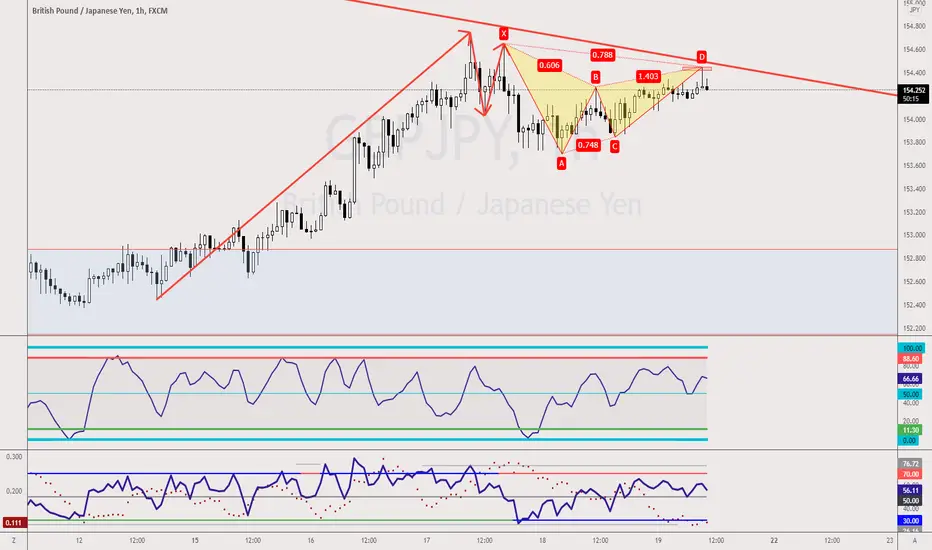
GBPJPY - Deep Gartley Pattern at XDeep Gartley Pattern has formed up on GBPJPY and has retested X. Counter-Trend Traders can head in for a shorting opportunity.

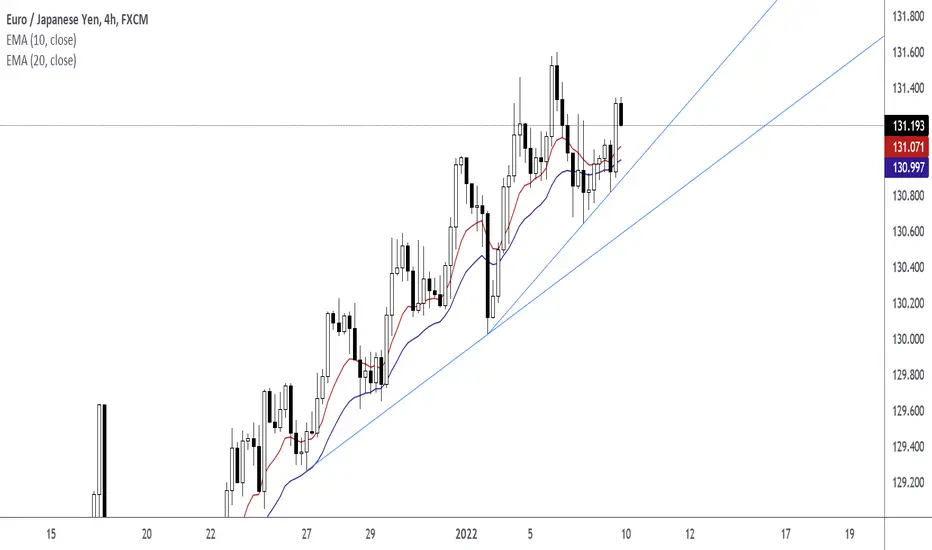
EURJPY Positive Slope Trend LineEURJPY Trend Is Still Intact Since December 29, 2021. Watch for more bullish price action signals in the form of inside bar candlestick, engulfing bar candlestick, pin bar candlestick.
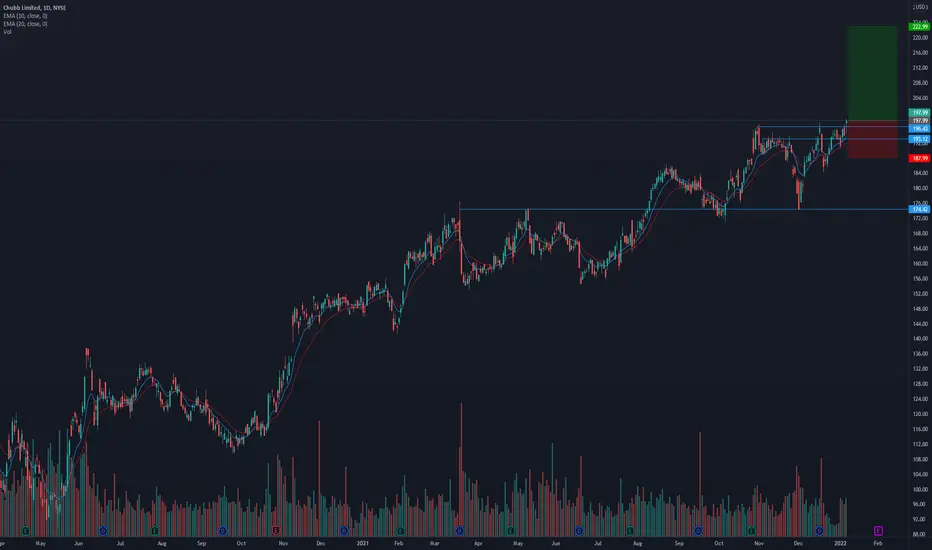
CB looking to reach new highs?* Exceptional earnings
* Very strong up trend
* High 3-month relative strength of 2.43 in the Finance sector
* Pays out quarterly dividends
* Breaking out of a ~5 month base
Trade Idea:
* You can enter now as the price is just breaking out of the base.
* Today's price action printed a bullish pin bar which indicates that there's tonnes of demand around the $196.43 area.
* Offering a great risk to reward ratio
* Given the current market conditions you may want to wait or trade a smaller size
Caution:
* A daily close below the $193.12 area would put this idea in danger.
Neo NEOUSDT - Descending triangle + Expecting lower prices- The situation in the crypto market is not looking good at all.
- Neo is forming and descending triangle - bearish pattern.
- THe price is also below the trendline started in March 2020.

Ethereum ETHBTC - Bearish divergence + PIN BAR!- Looks like the bull market for ETH is over due to bearish pin bar and bearish divergence on the monthly time frame.
- Shooting start candle formed last month.

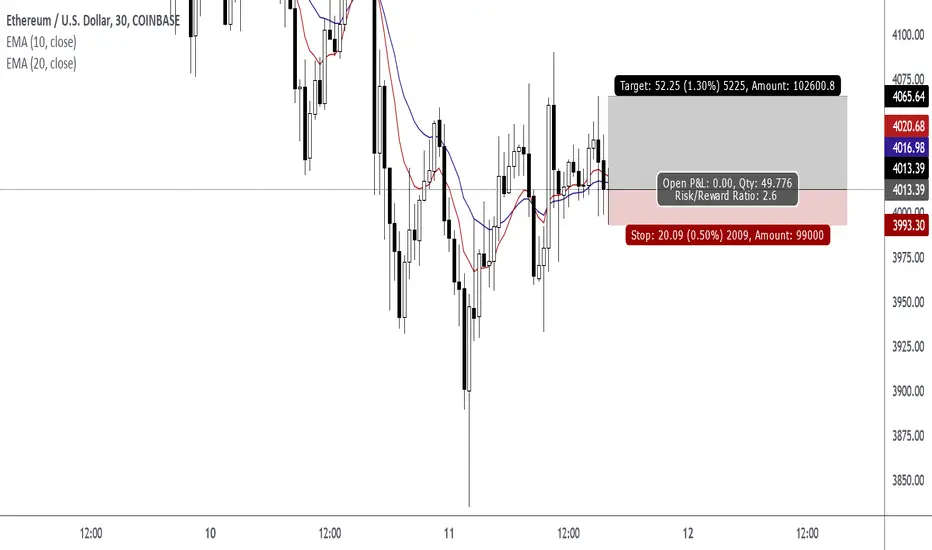
EMA 10 EMA 20 Pin Bar (Rejection Candlestick) StrategyEntry is 4013.39
Exit at 4065.64
Reward:Risk is 2.6R
Reward = 5225 USD
Risk = 2009 USD
Strategy is to enter at closing price of a pin bar (rejection candlestick) when the pin bar wick intersects the EMA 10 and EMA 20 in an uptrend.
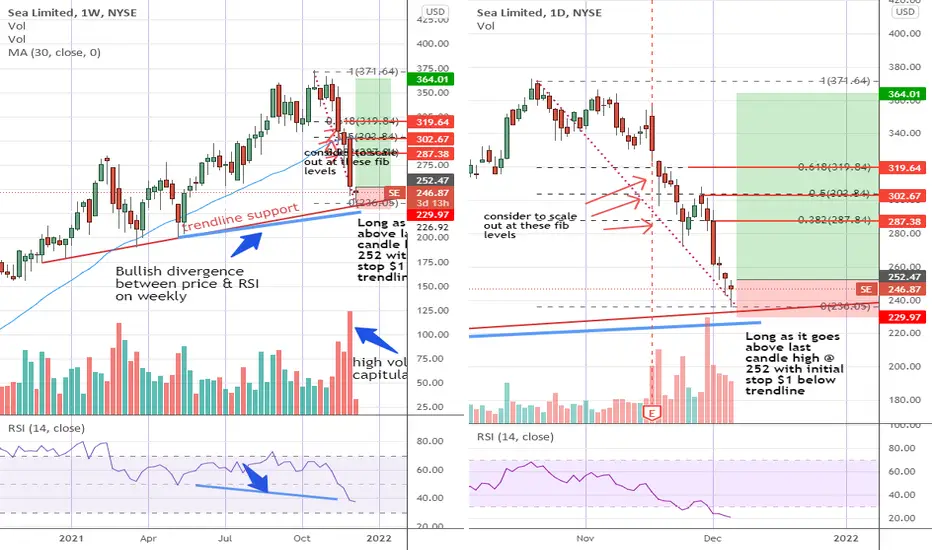
SE - short term rebound in the works?SE has plunged 36% from it's peak on 20 Oct and is now back at a mideterm trendline support. I see a bullish divergence building up on it's weekly and with the high volume sell off last week, it is likely that most of the selling is done now.
The last 3 candles on the daily is interesting. A doji followed by 2 pinbars, each inching lower towards the trendline support. My guess is that the weak bulls have been exiting the stock on each of these days but new bulls kept coming in to push the close off the lows of the day.
I will be looking to long here (preferably as it goes above yesterday's candle high at 252, confirming the momentum) with an initial stop loss about $1 below the trendline support.
Despite the 36% "discount" from recent highs, it's valuation is still rich at current levels and it's anybody's guess whether it could surpass the last high at 372 going forward.
Hence I will be looking to take scale out at the various fib levels on the way up (between 288 to 320).
p/s trade will be scratched if SE breaks below trendline in the near term (though this is looking less likely at the moment).
Disclaimer: TA is about improving our odds of a successful trade (not a guarantee). This is just my own analysis and opinion for discussion and is not a trade advice. Kindly do your own due diligence and trade according to your own risk tolerance and don't forget that money management is important! Thank you. Do give me a thumbs up if you agree. Feel free to let me know what you think! :)
The end of retracement for DOTUSDT ?considering pump of Bitcoin at 53500 level , expecting bullish market in the coming days
DOTUSDT is in a perfect situation to reverse . we are at the bottom of channel with the best reversal strategy based on candlestick pattern called "Pinbar" at supporting levels
we can also see divergence in RSI that could help
we may have a problem with the 38 resistance zone but the market momentum is our leverage
Targets in the chart are based on midline and upperline of channel
Hope you have a profitable trades

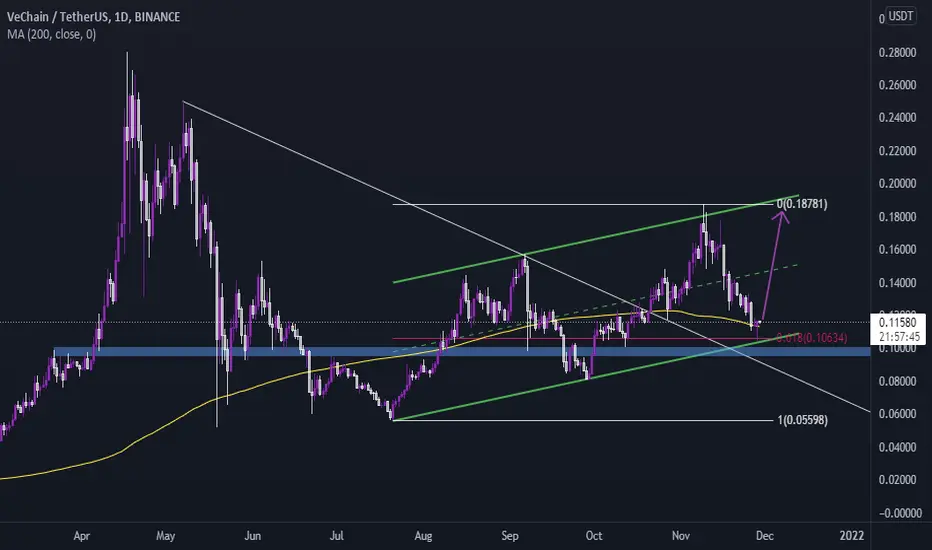
It worth to tryI have bullish mind about bitcoin and how it has been closed on Nov,28.it was very nice just before new week
And on VETUSDT there is pinbar + support zone + MA200 Daily + 0.618 Fibonacci weekly & MA50 weekly at the bottom of the bullish channel
It worth to try and buy
the target would be around 0.1864
and SL at close under the support zone
Do not forget money management
Hope you have a profitable trades
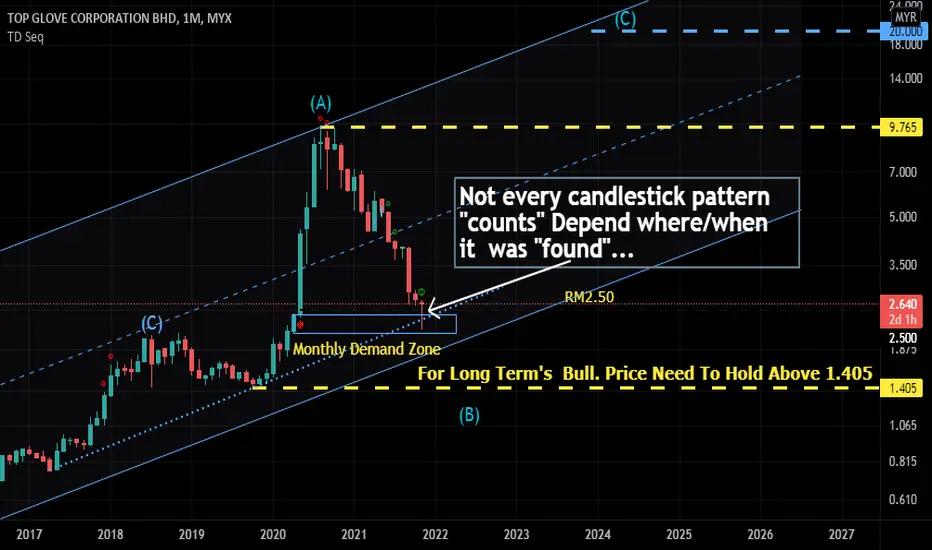
TOPGLOV Not every candlestick pattern "count". where/when.28/11/TopGlove.. Not every candlestick pattern "counts" Depend on where/when it was "found"...Is is a "valid" counts?. A "doji"? A "Pin Bar" A "Good" Morning Star? on not 1 minute but monthly chart..?..( Wait,, Not yet), wait until it closed monthly bar after 30/Nov/21
Trade using EMA, Pin Bars, Trend Lines, Higher Highs Higher LowsPin Bar Is Present On The H2, H3, and H4 Chart. This is a strong indication of a bull market. When this chart pattern occurs, look to enter long positions.
Trend: Up
Level: EMA 10 Level, EMA 20 Level, Horizontal Level
Signal: Pin Bar
Trade with multiple factors in your favor. In a bull market, look for pin bars, rejection candlesticks, EMA 10 above EMA 20, up trend, and higher highs higher lows.

GBPJPY - Bearish GartleyA Bearish Gartley Pattern forms within the double top retracement within the longer-term Bearish Trendline.
To sweeten the deal, the confirmation ends with a long shadow candle/pin-bar completing the Gartley Pattern.
The downside of this is that the RSI has not reach the overbought zone and the closing price of the long shadow candle can throw traders off the scale of Reward:Risk.
The weekly candles are not looking good!So after reaching to the previous high in April ($64,854), Bitcoin has made 2 suspicious pin bars or 2 shooting stars, whatever suits you, and tomorrow it’s about to close under it (I’m not sure)! That can’t be good in short term. I think the price could go for a little vacation to $53,000 (a solid high) and rest. But don’t worry, the weekly uptrend would still be sound. Pleas tell me what you are thinking.

$IOST - Bullish Pinbar formed in Daily. Entering LONG#IOST has formed one of the most beautiful chart formations for me, consisting of a Daily pinbar in a strong support zone plus the MACD forming a twist in its MA’s, indicating a strong exchange in market direction.
ADX is super strong also, indicating the strong power of the current trend.
Placing Long positions from right here.
**WILL BE UPDATING**

$DOT - perfect Bullish pinbar in daily. PLACING LONGSPOLKADOT has formed a very nice daily pin bar here where it is. It looks one of the perfect entries from my point of view, in where the MACD is about to cross from below indicating a bullish movement.
The bounce on the MA55 is just awesome to me.
Anyone trading with stop loss has great opportunity here since the SL is really tight.
**WILL BE UPDATING**

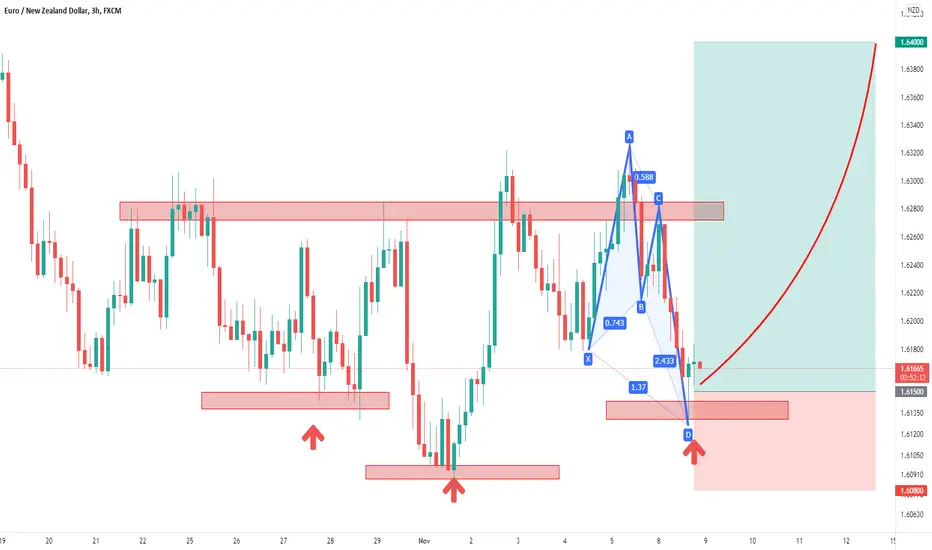
EURNZD to 1.64Good setup with 3 RR ratio
1. Inverse head & shoulders
2. Bullish butterfly
3. Pin bar at support