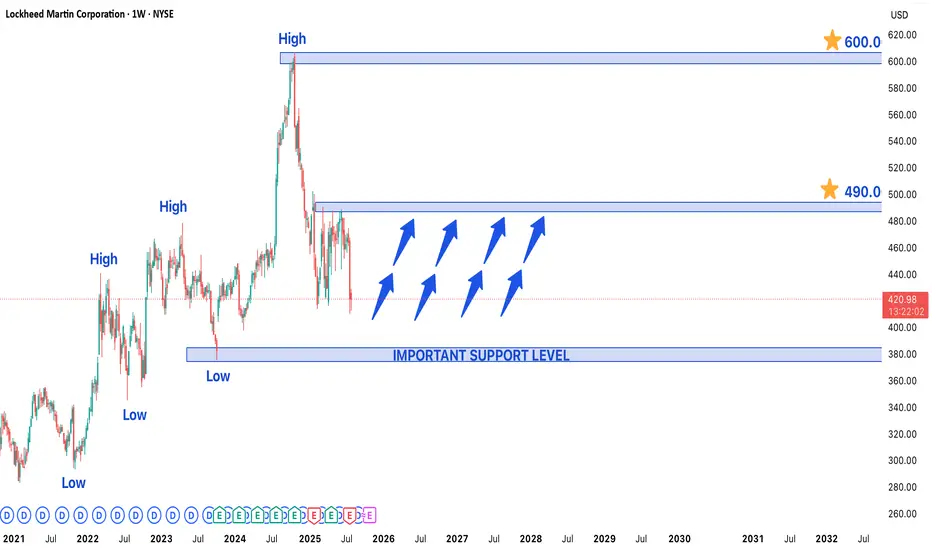
Lockheed Martin Stock in Bullish Trend - Key Levels to watchLockheed Martin (LMT) Stock in Strong Bullish Trend - Key Levels to Watch
Lockheed Martin's (LMT) stock is currently exhibiting a well-defined bullish trend, trading near a recent higher low that may serve as a crucial support level for the next upward move. The defense giant continues to benefit from robust global military spending and a strong contract pipeline, positioning the stock for potential further gains.
Technical Structure & Key Levels
- Higher Low Support: The current price zone represents a critical support area where buyers have previously stepped in, maintaining the upward trajectory
- Upside Targets:
- Near-term: $490 (previous resistance zone)
- Long-term: $600 (potential breakout extension)
- Major Support: $375 would act as strong demand zone if any deeper pullback occurs
Bullish Catalysts Supporting the Trend
1. Defense Sector Strength:
- Record US defense budget allocations for 2024-2025
- Increased NATO military spending amid global tensions
2. Contract Backlog:
- F-35 program continues to drive revenue
- Hypersonic weapons and space systems development
3. Technical Momentum:
- Price trading above key moving averages (50/200 DMA)
- Higher highs and higher lows confirm uptrend structure
Trading Strategy Considerations
- Optimal Entry:
- On bounces from current support level
- On breakout above $460 confirmation
- Risk Management:
- Stop-loss below $375 for longer-term positions
- Partial profit-taking near $490 resistance
- Confirmation Signals:
- Volume increase on upside moves
- Sustained closes above $460
Potential Risks to Monitor
- Geopolitical shifts affecting defense budgets
- Program delays (particularly in F-35 production)
- Broader market corrections impacting defense sector
Long-Term Outlook:
The combination of fundamental strength and technical positioning suggests LMT could progress toward $490 near-term, with $600 as a viable long-term target if the bullish structure holds. Traders should watch price action around current levels for continuation signals while remaining mindful of the $375 support as a critical level for the bullish thesis.
Pivot Points
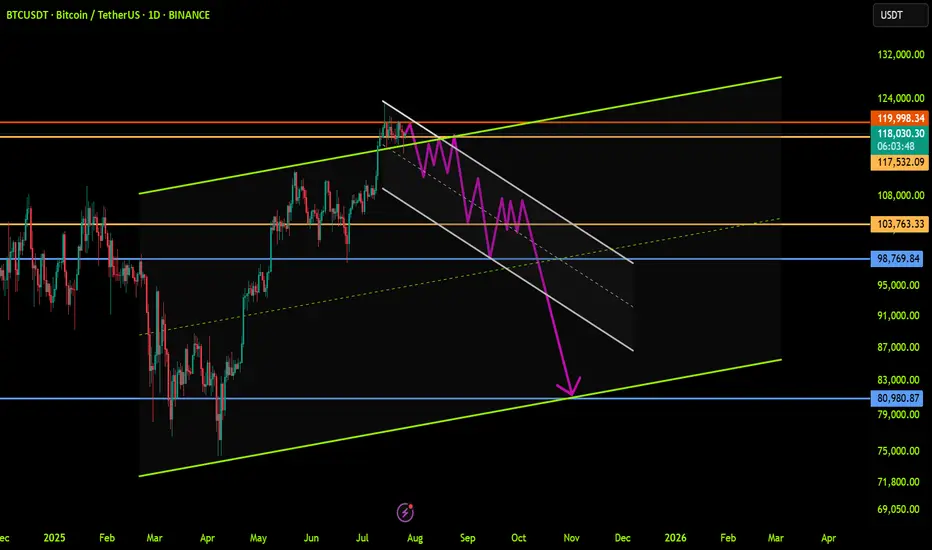
BTCUSDT: Trend in daily time frameThe color levels are very accurate levels of support and resistance in different time frames.
A strong move requires a correction to major support and we have to wait for their reaction in these areas.
So, Please pay special attention to the very accurate trend, colored levels, and you must know that SETUP is very sensitive.
BEST,
MT
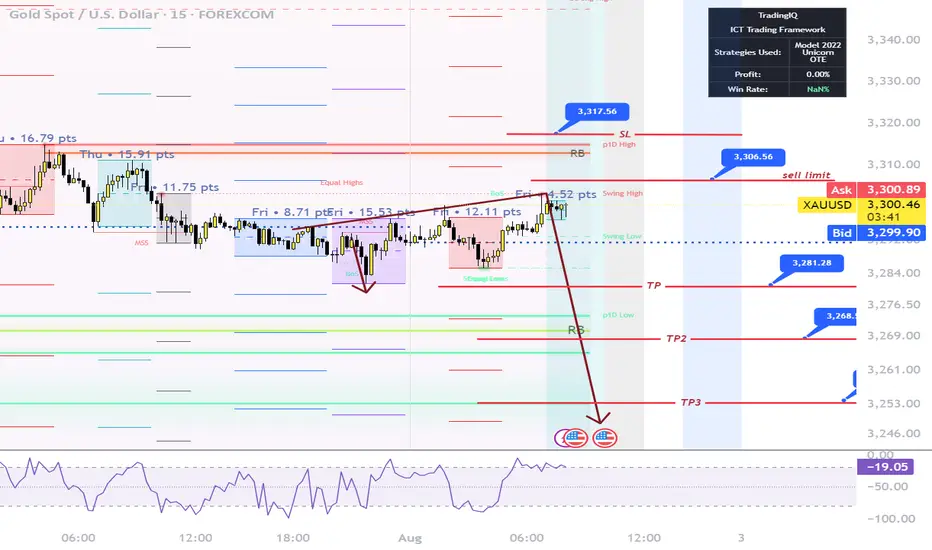
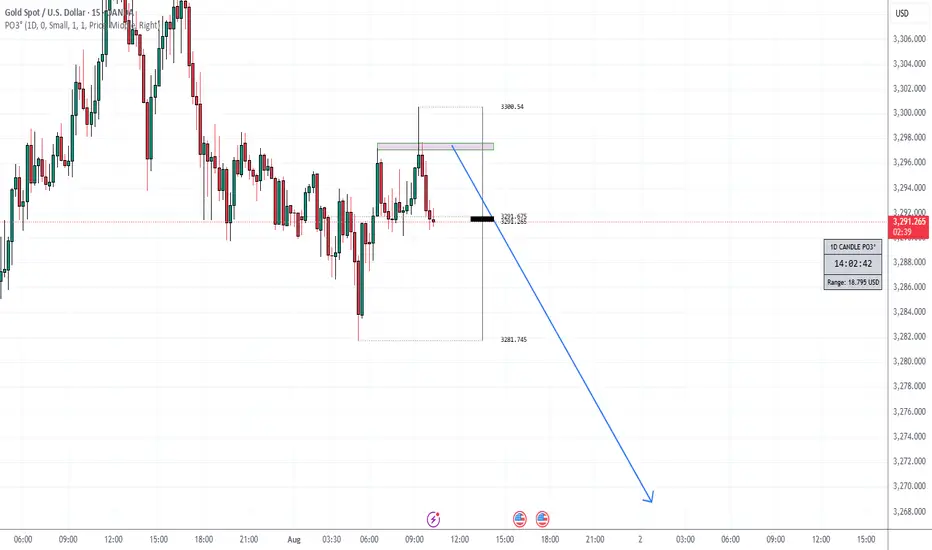
XAUUSD – Smart Money Sell Setup during New York Session | ICT St
Gold (XAUUSD) has just completed a classic liquidity grab above the London session highs, forming a potential Judas Swing as New York begins.
On the 4H timeframe, we clearly have a bearish BOS (Break of Structure), and price has returned to a Premium zone within a bearish FVG and OB (Order Block).
Today is NFP Friday, and after the Fed kept rates steady mid-week, we’re expecting high volatility.
Current price action has swept the overnight liquidity and is now reacting inside a Repricing Block, aligning perfectly with the NY Midnight Open level.
🎯 My Sell Plan (Live Execution):
Sell Limit: 3306.50
SL: 3317.50 (Above OB high)
TP1: 3281.20
TP2: 3268.50
TP3: 3253.90
🧠 Bias: Bearish
🕒 Session: New York
🧮 ADR: 43 pts
📉 Market Structure: Bearish
This setup follows the ICT methodology using time, liquidity, structure, and displacement.
If we break above 3317.50 with strong displacement, the idea becomes invalid.
Let's see if Smart Money takes it down into Friday’s close.
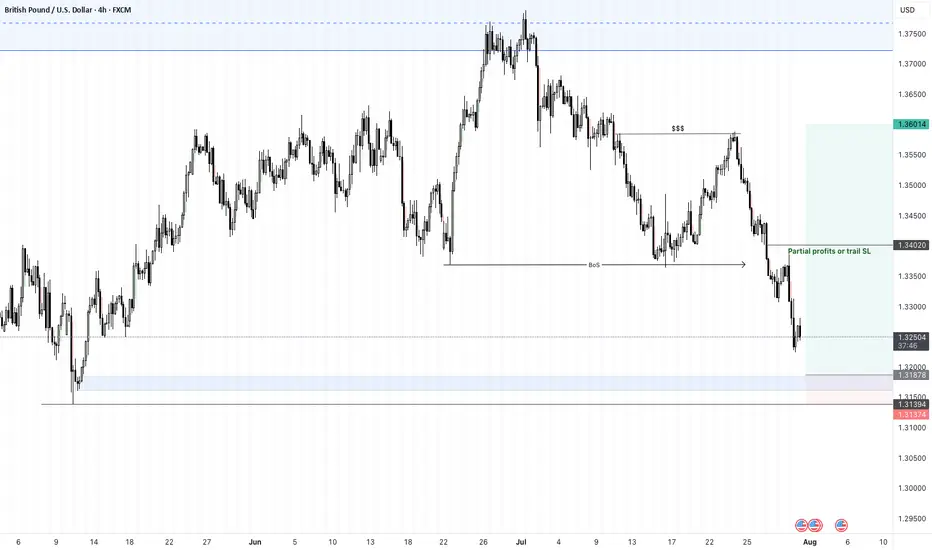
GBPUSD - 31/7/25 - Bullish reversalThe setup is not great, but im expecting a pull back on the dollar which should result in a bullish move on the GBP and EUR.
There is an extreme zone that i would like price to reach to with the possibility of not taking out the previous HL. But lets see.
+ve:
1. Extreme zone that resulted in the bullish move.
2. slight imbalance above the extreme zone
3. Dollar setting up for a pull back that will result in a bullish move on GBP
4. TP is just above the equal high liquidity zone
-ve:
1. close to the higher low and that may be swept
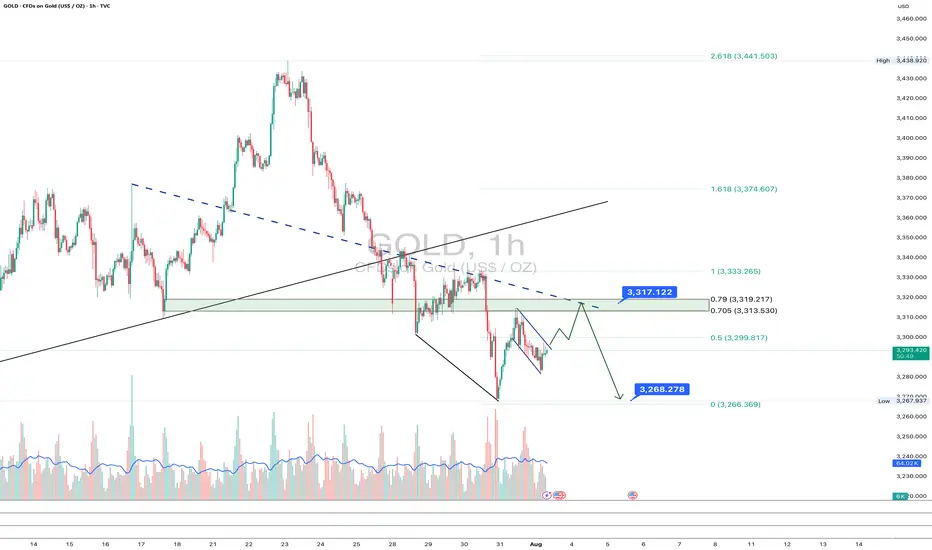
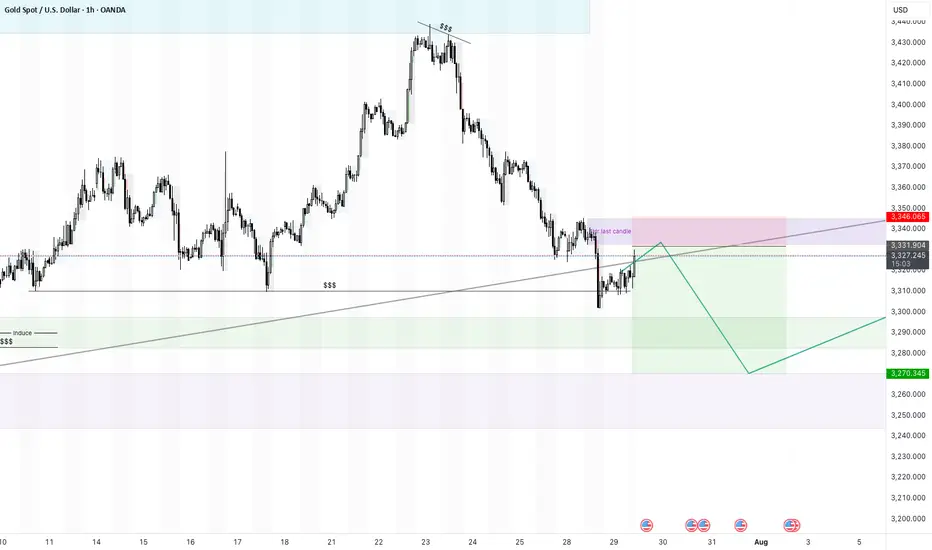
Gold: final pullback or bull trap?On the 1H chart, gold (GOLD) is forming a bullish flag after a sharp decline, which may just be a corrective move within a broader downtrend. The price is now approaching the key resistance zone around $3313–$3317 - this area holds the POC, broken trendline, and the 0.705–0.79 Fibonacci retracement from the last drop. This is the decision-making zone.
If bulls fail to push above it, we expect a move down toward $3268 - the next strong support and potential buy zone, also confirmed by Fibonacci and local demand. Stochastic divergence and slowing volume suggest a possible rebound from that level. However, if the price breaks and holds above $3317, this would indicate a local trend reversal, with targets at $3333 and $3374.
Watch the $3317 zone closely - bulls have yet to prove this is more than just a bounce.
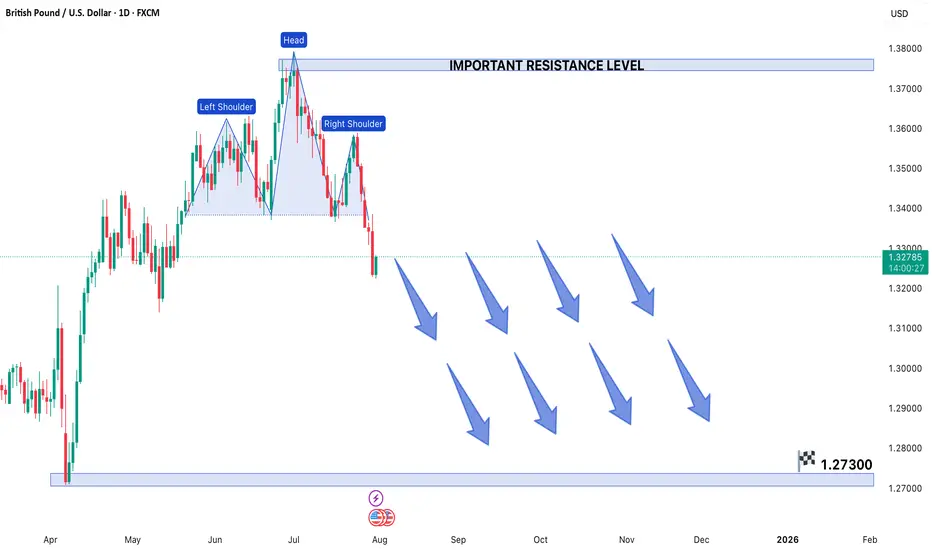
GBPUSD FORMS HEAD & SHOULDER PATTERN IN 1D TIME FRAME CHARTGBP/USD Forms Head and Shoulders Pattern - Bearish Breakdown Expected
The GBP/USD currency pair has developed a clear Head and Shoulders (H&S) reversal pattern on the 1-DAY chart, signaling potential weakness ahead. This technical formation - characterized by a central peak (head) flanked by two lower highs (shoulders) - suggests the recent uptrend may be exhausting as sellers gain control.
Current Market Structure
Price action remains confined within a bearish framework, making consistent lower highs and lower lows since failing at the pattern's right shoulder. The pair now tests critical support near the neckline of the H&S formation. A confirmed break below this level would validate the pattern and likely accelerate downward momentum.
Key Levels to Watch
- *Downside Target*: 1.27300 emerges as the next major support if bearish momentum sustains
- Resistance Zone: The 1.37900 level now acts as formidable overhead resistance
- Neckline Break: A daily close below current support would confirm the H&S pattern
Trading Implications
The technical setup favors:
1) Maintaining short positions while price holds below the right shoulder high
2) Watching for increased volume on breakdown moves to confirm bearish conviction
3) Considering long positions only if buyers reclaim 1.37900 resistance
Risk Factors
Traders should monitor:
- UK inflation data and BoE policy signals
- Fed interest rate expectations
- General USD strength across currency markets
This pattern projects approximately 900 pips of potential downside if fully realized. However, traders should wait for confirmed breakout momentum rather than anticipating the move, as false breakdowns remain possible in current market conditions. Proper position sizing and stop-loss placement above recent swing highs remains essential for risk management.
Note: Forex trading involves substantial risk. Always conduct your own analysis before entering positions.
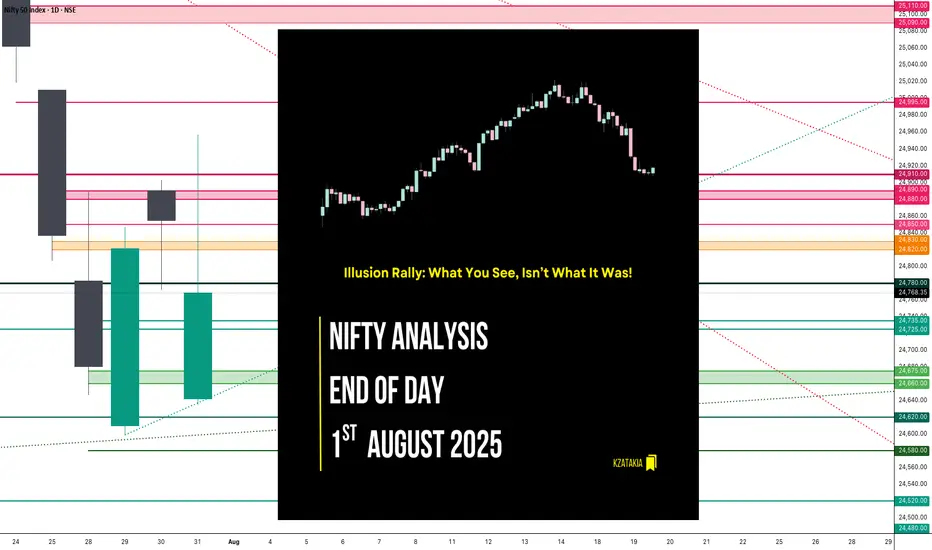
Nifty Analysis EOD – August 1, 2025 – Thursday🟢 Nifty Analysis EOD – August 1, 2025 – Thursday 🔴
🎢 Illusion Rally: What You See, Isn’t What It Was!
🧾 Nifty Summary
As we all expected, a negative gap-down opening occurred due to external news. Nifty opened 183 points lower, tested the 24,660–24,675 support zone, then rebounded sharply after a symmetrical triangle + VWAP breakout. The rally pierced through all key levels like a hot knife through butter, topping at 24,950, only to reverse with equal intensity. Closed at 24,765.
📌 Despite the technical structure, today’s move had no clear technical reasoning — more likely triggered by a mix of tariff news, confidence in Modi, weekly + monthly expiry, and manipulation.
📌 in spite of a bullish candle, strong upper rejection from 24,950 hints weakness. Candle appears bullish on colour, but bears dominated intraday close — forming a bearish Moboroshi Candle (illusion of strength).
📌 Bearish Moboroshi Candle Structure : close > open and close < Previous Close
🔍 Intraday Walk
📉 Gap down of 183 pts
🟢 Support held at 24,660–24,675
🔺 Symmetrical triangle + VWAP breakout
🚀 Sharp upmove to 24,950 zone
🔁 Reversal with same intensity
📉 Closed at 24,765 — below prior close
🖼 5 Min Time Frame Chart with Intraday Levels
📉 Daily Time Frame Chart with Intraday Levels
🕯 Daily Candle Breakdown
Open: 24,642.25
High: 24,956.50
Low: 24,635.00
Close: 24,768.35
Change: −86.70 (−0.35%)
Candle Structure:
✅ Green Candle (Close > Open) → +126.10 pts real body
⬆️ Upper Wick → 188.15 pts (Very Long)
⬇️ Lower Wick → 7.25 pts (Tiny)
Interpretation:
Opened near yesterday's low
Intraday sharp rally towards 24,950+
Faced strong selling at highs
Closed above open, but way below high — signals clear rejection
Candle Type:
📌 Bearish Moboroshi Candle — Appears bullish but hides weakness
🧠 Buyers strong initially, but sellers took control at the top
Key Insight:
Bulls need decisive close above 24,880–24,910
Else, expect drift back toward 24,660–24,675
🛡 5 Min Intraday Chart
⚔️ Gladiator Strategy Update
ATR: 208.29
IB Range: 93.95 → Medium
Market Structure: Unbalanced
Trades Triggered:
✅ 10:40 AM – Long Entry → Trailing Target Hit (R:R – 1:6.25)
📌 Trade Summary: Big R:R win today on breakout with trailing logic execution!
🧱 Support & Resistance Levels
🔺 Resistance Zones:
24,820 ~ 24,830
24,850
24,880 ~ 24,890
24,910
🔻 Support Zones:
24,780
24,725 ~ 24,715
24,660 ~ 24,650
24,620 ~ 24,600
💭 Final Thoughts
"When the move can’t be explained, the best position is caution."
Today's market behavior reinforces the idea that not all moves are technical. Keep your tools sharp, but don’t ignore contextual chaos.
✏️ Disclaimer
This is just my personal viewpoint. Always consult your financial advisor before taking any action.
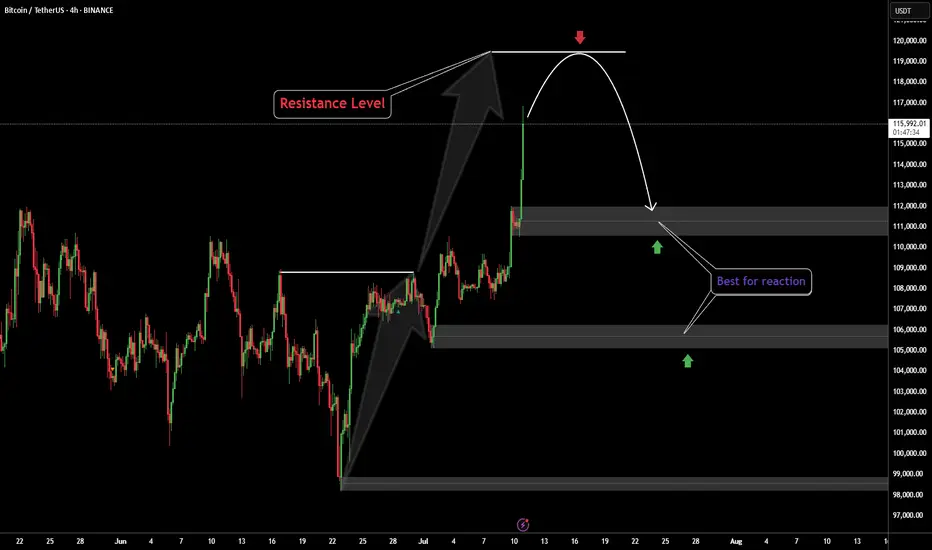
Bitcoin ATHBINANCE:BTCUSDT This is amazing for crypto community because this level-up all of lover crypto currencies.
Next target: 120.000K
Best for pollback levels: 111.000K & 105.500K
👓We are this time keep calms emotional in buy or sell.
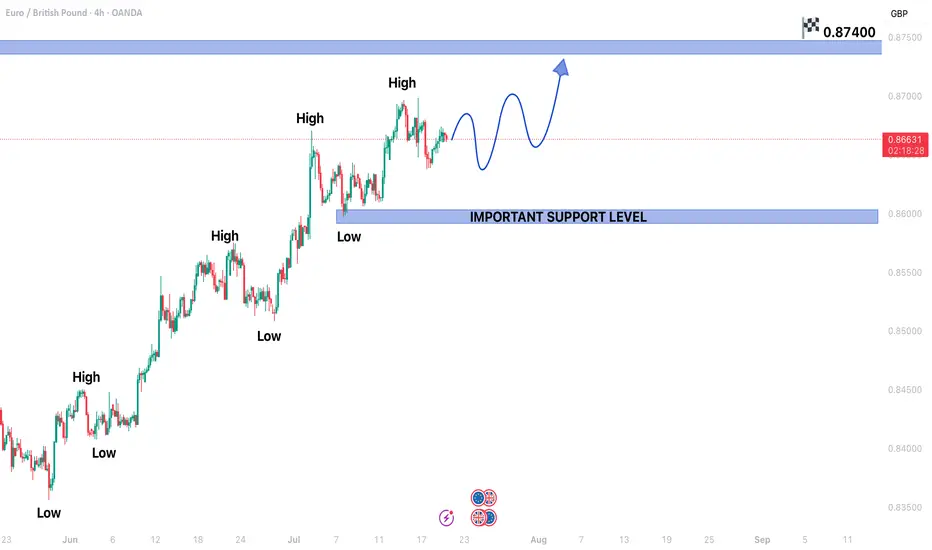
EURGBP CONTINUING BULLISH TREND STRUCTUREEURGBP CONTINUING BULLISH TREND STRUCTURE IN 4H TIME FRAME.
Price is currently in a secondary trend.
Price is expected to end the secondary trend and start primary trend again.
On higher side market may hit the targets of 0.87400
On lower side 0.85950 may act as a key support level.
HEAD & SHOULDER PATTERN SPOTTED IN EUR/CADHEAD & SHOULDER PATTERN SPOTTED IN EUR/CAD.
Price is expected to remain bearish in upcoming trading sessions.
On higher side 1.61100 level may act as a key resistance level.
On lower side market may hit the target of 1.58150.

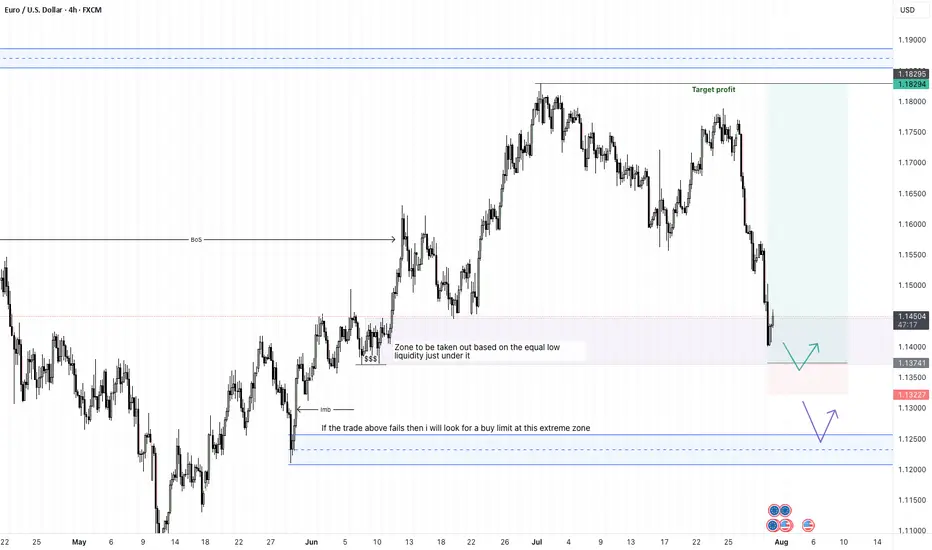
EURUSD - 31/7/25Price has reached a zone that broke the structure - see BoS on the left. Now that price is here in the zone, im not comfortable entering a buy order yet. The full bearish candle into the zone, leaves me with an indication that price may go lower.
+ve:
1. Big bearish candle in to the BoS zone - price may drop lower
2. There is equal low liquidity on the left which sits just below the zone which is expected to be taken out
4. HTF direction is still bullish
-ve:
1. below the equal low liquidity is an efficient zone before some imbalance
2. that imbalance may draw price to it and stop me out
Second trade idea:
Assuming that the first trade does not hold, then my focus will be the extreme zone where i will place a buy limit.
TP: 8.86R
XAUUSD - 29/7/25 - continued bearish There was quite strong bearish momentum yesterday during the US session. Going into Asian session and London session today there is a consolidation bullish. There is a 4 hour zone marked out where i am looking for a retest and continuation bearish to a key zone below where a reversal pivot is expected and then continuing bullish with the larger trend.
RITCO LOGISTICSRitco Logistics Ltd. – Full Report
Ritco Logistics Ltd. (currently trading at ₹314.85) is a mid-cap logistics and transport services provider, with operational hubs across India. The company focuses on multi-modal freight movement, contract logistics, and integrated warehousing solutions. It caters to clients in FMCG, automotive, and heavy industries. Ritco has been expanding fleet infrastructure and digitizing supply chain management to enhance delivery efficiency and customer responsiveness.
Ritco Logistics Ltd. – FY22–FY25 Snapshot
Sales – ₹500 Cr → ₹560 Cr → ₹625 Cr → ₹695 Cr Organic growth through fleet expansion and segment penetration
Net Profit – ₹32 Cr → ₹37 Cr → ₹42 Cr → ₹48 Cr Margin lift through route optimization and tech adoption
Operating Performance – Moderate → Strong → Strong → Strong Efficiency gains from digitized logistics management
Dividend Yield (%) – 0.00% → 0.00% → 0.30% → 0.35% Introduction of modest payouts as profitability improves
Equity Capital – ₹20.25 Cr (constant) Conservative structure with minimal dilution
Total Debt – ₹98 Cr → ₹90 Cr → ₹82 Cr → ₹74 Cr Gradual deleveraging from operating cash flows
Fixed Assets – ₹85 Cr → ₹90 Cr → ₹95 Cr → ₹102 Cr Fleet additions and warehouse infra development
Institutional Interest & Ownership Trends
Promoter holding is stable at 66.47% with no pledging. FII interest remains low given the mid-cap profile, while HNI participation has increased following breakout patterns. Institutional exposure is selective, focused on logistics-oriented strategies and small-cap momentum plays.
Business Growth Verdict
Ritco is growing steadily across freight, contract logistics, and digital enablement Margins are improving due to operational leverage and fleet efficiency Debt is being reduced gradually, supported by growing cash flows Digitization initiatives are likely to support scale and client retention
Management Con Call
Management highlighted ongoing fleet capacity additions and increased client onboarding in logistics-as-a-service vertical. Backward integrations in warehousing and last-mile delivery have begun to support margin improvements. The company remains focused on Tier-2 and Tier-3 freight growth. FY26 guidance suggests mid-teen revenue growth and margin consistency, with stronger tech enablement and route-level profitability.
Final Investment Verdict
Ritco Logistics Ltd. presents an efficient and scalable logistics story backed by disciplined operations and tech-driven optimization. With expanding fleet, improving capital structure, and a clear management roadmap, it remains a tactical pick among transport-driven mid-caps. Ideal for gradual accumulation by investors exploring scalable logistics and supply chain opportunities within India's growing infrastructure and consumption space.
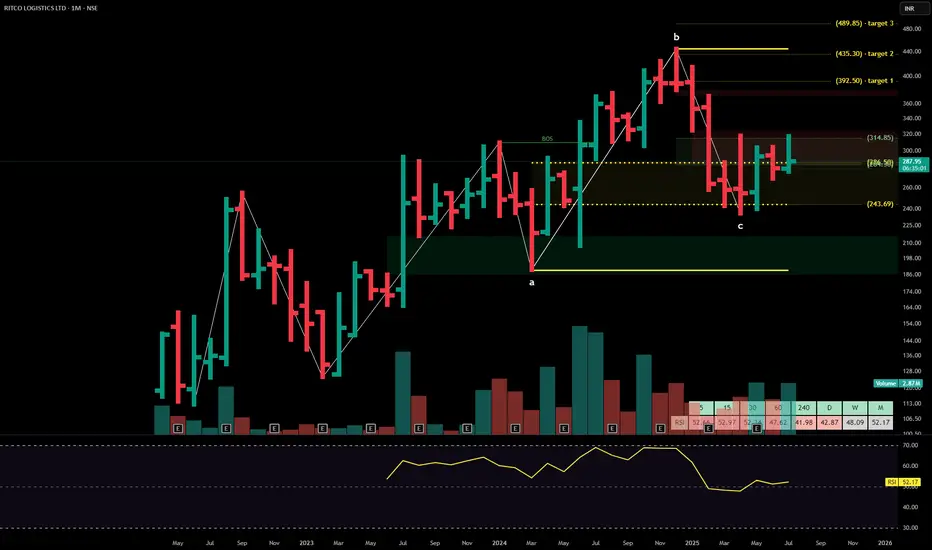
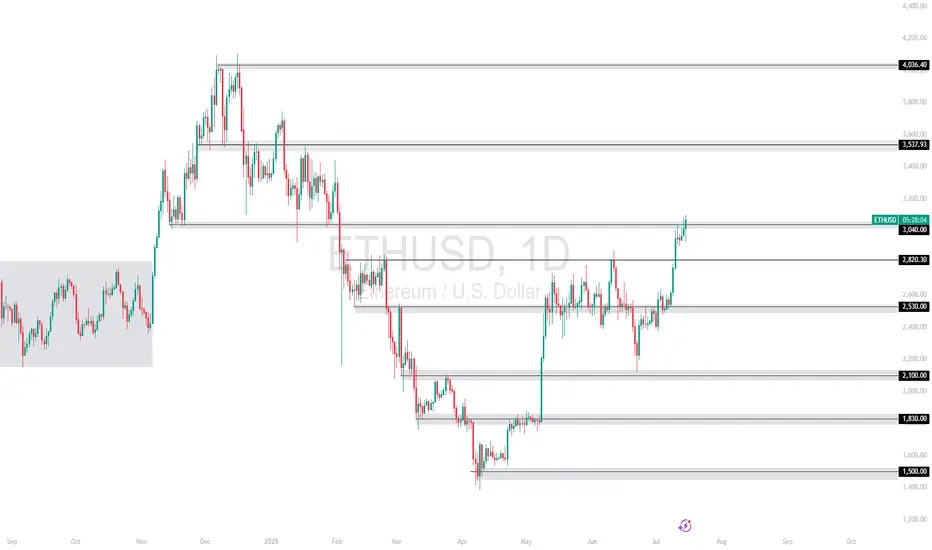
ETHUSD | Breakout Watch Above $3,040Ethereum has surged above the critical $2,530 resistance zone and is now challenging $3,040, a key structure level. A daily close above this could open the path toward $3,537 and even $4,056 in the mid-term.
Support at: 2,530 / 2,100 / 1,830 🔽
Resistance at: 3,537.93 / 4,056.40 🔼
🔎 Bias:
🔼 Bullish: Holding above 2,530 confirms breakout structure; a clean break above 3,040 targets higher zones.
🔽 Bearish: Failure to stay above 3,040 may invite a retest of 2,530.
📛 Disclaimer: This is not financial advice. Trade at your own risk.
Reddit breaks out for bullish run I have been watching Reddit for a couple of weeks and identified that we had put in the .786 low from the correction since February and then formed a range that was well respected for the past 4 months .
In this video I highlight zones where i expect price to gravitate too and where a nice entry will be if you are looking to long reddit.
Tools used Fib suite , trend based fib , tr pocket , 0.786 + 0.382 and fixed range .

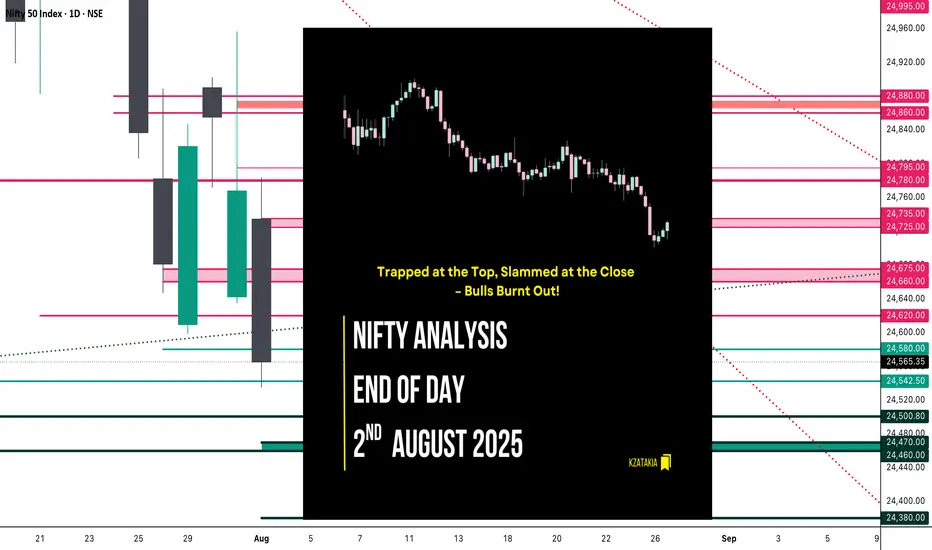
Nifty Analysis EOD – August 2, 2025 – Friday🟢 Nifty Analysis EOD – August 2, 2025 – Friday 🔴
Trapped at the Top, Slammed at the Close – Bulls Burnt Out!
🗓️ Nifty Summary
With the continuation of yesterday's hidden weakness, today's session gave early hope but ended with a bearish surprise. Nifty opened near the key support zone of 24,735 ~ 24,725, hovered indecisively, then suddenly rallied to 24,780, trapping bulls just under resistance.
But the trap was set.
A sharp reversal followed as Nifty broke not just the day’s low, but also the previous day’s support zone of 24,660 ~ 24,675, pulling the index lower into the 24,565.35 close — the second lowest close since May 12.
A fierce 2–3 hour tug-of-war between bulls and bears took place in a tight 40–50 point range until 2:50 PM, when bulls gave up—leading to a 100+ point fall in the last half-hour. shocked many traders, especially those fatigued from the earlier choppy action.
Much like yesterday, both sides of the trade were available today.
Did you catch them?
Zoom Out View :
Today’s close is just 23 points above the June 3 close, wiping out nearly 59 sessions (81 days) of gain.
Will the zone of 24460 ~ 24542 provide support again, or are we headed for a retest of the 24000 ~ 23800 and 23200 ~ 22800 (Pattern Target and Virgin) range?
Yes, you read correctly 23200 ~ 22800…!
Not so soon…but eventually…!
wish you tell me crazy and hope I am wrong…!
📈 5 Min Time Frame Chart with Intraday Levels
📉 Daily Time Frame Chart with Intraday Levels
🕯️ Daily Candle Breakdown
Open: 24,734.90
High: 24,784.15
Low: 24,535.05
Close: 24,565.35
Change: −203.00 (−0.82%)
Candle Structure
🔴 Large bearish body (169.55 pts)
☁️ Moderate upper wick (49.25 pts)
⬇️ Short lower wick (30.30 pts)
Interpretation
Opened lower, climbed early but failed at 24,780+.
Selling dominated the rest of the session, closing near lows.
Moderate upper wick shows early bullish attempt was rejected.
Candle Type
Bearish Marubozu-like – clear seller dominance.
Key Insight
Sellers defended 24,780–24,800 zone.
Closing near 24,560 keeps the short-term bias bearish.
Next support: 24,500, 24,470 ~ 24460
⚠️ Bulls must reclaim 24,735+ on closing basis to neutralize sentiment.
🛡 5 Min Intraday Chart
⚔️ Gladiator Strategy Update
ATR: 212.37
IB Range: 87.55 → Medium
Market Structure: Balanced
Trades Triggered
🕙 10:05 AM – Long Entry → 🎯 Target Hit (R:R – 1:1)
🕚 11:09 AM – Short Entry → 🎯 Target Hit (R:R – 1:2)
🔍 Trade Summary
Both sides were offered—clean hit on long and solid breakdown on short. A Gladiator’s delight.
📊 Support & Resistance Levels
🔼 Resistance Zones
24620
24660 ~ 24675
24725 ~ 24735
24780 ~ 24795
24860 ~ 24880
🔽 Support Zones
24,542 ~ 24,535
24,500
24,470 ~ 24,460
24,380
💬 Final Thoughts
"Traps are laid where confidence is highest. Stay alert, stay flexible."
A textbook day where patience paid off — those who didn’t force trades were rewarded with clean moves in both directions.
✏️ Disclaimer
This is just my personal viewpoint. Always consult your financial advisor before taking any action.
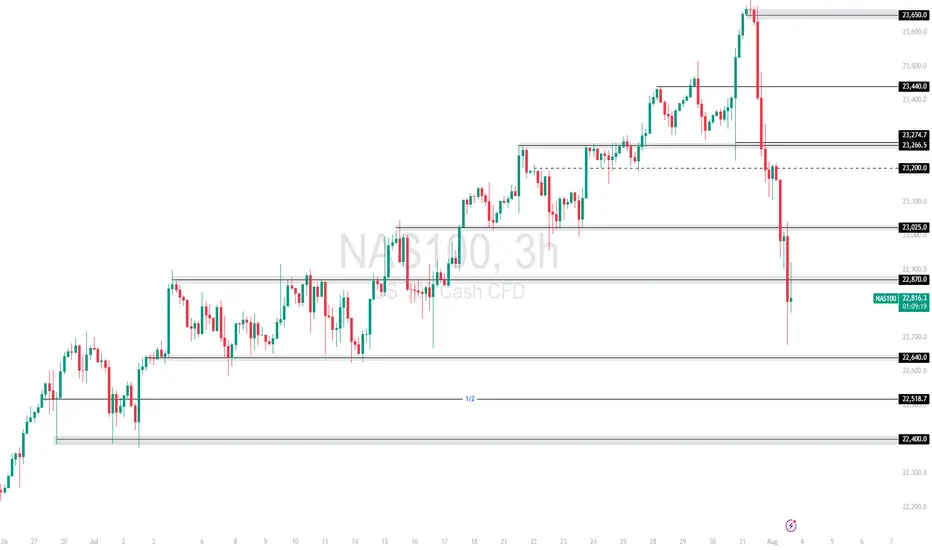
NAS100 – Sharp Breakdown After Tariffs & Jobs Data MissAfter a macro-driven selloff, NAS100 broke decisively below 23,025.0, taking out prior structure and confirming bearish pressure. The drop followed two key catalysts:
📉 Jobs Report Miss: Only 73K jobs added in July vs 200K+ expected — signals a slowing economy.
📛 Tariff Shock: President Trump imposed new tariffs on 90+ countries, up to 41%, rattling global sentiment.
Support at: 22,870.0 🔽 & 22,640.0
Resistance at: 23,025.0 🔼 & 23,200.0
🔎 Bias:
🔼 Bullish: Sustained strength above 22,870 with momentum could aim for 23,025 retest.
🔽 Bearish: Rejection below 23,025 or break under 22,870 opens space to 22,640 and possibly 22,518.
🎯 Let the dust settle – market could still be digesting the shock.
📛 Disclaimer: Not financial advice. Trade responsibly.
Understanding SMT Divergence In Trading1. Definition and Importance
SMT (Smart Money Technique) Divergence refers to a trading concept that involves identifying discrepancies between the price movement of correlated markets or instruments.
These discrepancies can signal potential market reversals or price manipulation. Specifically, it focuses on the divergence between price movements and indicators (like volume, momentum, or oscillators) in markets that typically move in sync.
In SMT Divergence, traders look for situations where two or more correlated instruments (like
Forex pairs, indices, or bonds) are moving in opposite directions. This "divergence" signals that
there may be a shift in market sentiment, liquidity manipulation, or an opportunity for price
correction.
The importance of SMT Divergence lies in its ability to detect hidden market dynamics that are
often manipulated by institutional players. By understanding these divergences, traders can
gain insights into potential market moves and position themselves accordingly.
2. The Relationship Between Correlated Markets
Understanding these relationships is crucial for identifying SMT Divergence:
Forex Pairs : Many Forex pairs have direct correlations. For example, EUR/USD and USD/JPY are often correlated in the sense that when the USD strengthens, both pairs may exhibit price movement in the same direction (EUR/USD decreases, USD/JPY increases). SMT
Divergence occurs when these pairs move in opposite directions, indicating that something
unusual is happening in the market (e.g., liquidity manipulation or market anticipation).
Indices : Stock market indices (like the S&P 500 or Dow Jones) and related instruments like futures or ETFs can show correlation. A divergence in these indices might indicate potential
trends or reversals, signaling that institutions are positioning themselves for a move in one
direction, and the market is showing resistance.
Bonds : The relationship between bond yields and currency pairs, for instance, can also show correlations. When bond yields move in one direction, certain currency pairs should
generally follow suit. Divergence in this relationship can reveal clues about market
intentions, such as shifts in interest rates or macroeconomic sentiment.
Commodities and Stocks : Commodities like oil and gold can often correlate with indices or specific stocks. For example, if oil prices rise and an energy sector index doesn’t move in the
same direction, this could be a sign of market inefficiencies or institutional positioning.
3. SMT Types
3.1. Bullish SMT Divergence
Bullish SMT (Smart Money Technique) Divergence occurs when one correlated asset forms a
higher low while another makes a lower low. This indicates that one market is showing hidden
strength, suggesting a potential reversal to the upside.
How to Spot Higher Lows in One Asset While the Other Makes Lower Lows:
1. Identify Two Correlated Markets – Choose two assets that typically move together, such as EUR/USD and GBP/USD or NASDAQ and S&P 500.
2. Look for Divergence – Observe when one asset makes a new lower low, while the other fails to do so, instead of forming a higher low.
3. Volume & Price Action Confirmation – Institutions may absorb liquidity in the weaker asset while the stronger one holds its ground.
4. Validate with Market Context – Look at macroeconomic conditions, liquidity pools, and institutional activity to confirm the setup.
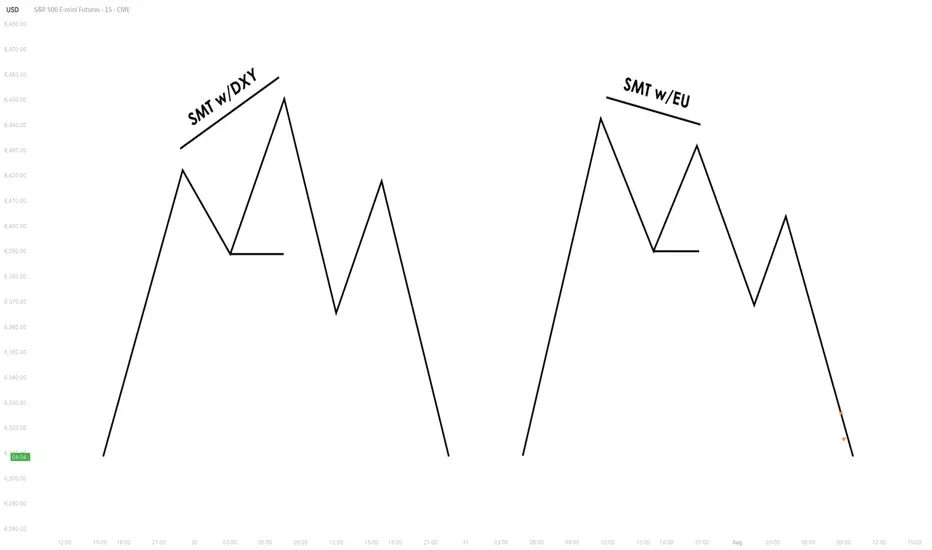
3.2. Bearish SMT Divergence
Bearish SMT Divergence occurs when one correlated asset forms a lower high while another
makes a higher high. This signals hidden weakness, indicating that the market may be setting
up for a bearish reversal.
How to Spot Lower Highs in One Asset While the Other Makes Higher Highs:
1. Find Two Correlated Markets – Common pairs include NASDAQ vs. S&P 500 or EUR/USD vs. GBP/USD.
2. Identify the Divergence – One asset makes a higher high, while the other fails to follow and forms a lower high instead.
3. Liquidity & Volume Analysis – Smart money may be using the stronger asset to attract buyers before reversing.
4. Confirm with Institutional Order Flow – Watch for liquidity grabs and imbalance zones.
3.3. Intermarket SMT
Definition : Divergence between assets from different markets, such as Forex vs. Commodities, Stocks vs. Bonds, or Indices vs. the U.S. Dollar.
Examples :
EUR/USD vs. DXY (U.S. Dollar Index) – If EUR/USD forms a higher low while DXY makes a
higher high, this suggests USD weakness and potential EUR/USD strength.
NASDAQ vs. S&P 500 – If NASDAQ makes a higher high but S&P 500 doesn’t, it can indicate
a weakening stock market rally.
Strength & Validity :
High validity because institutions hedge positions across different markets.
3.4. Intramarket SMT
Definition : Divergence within the same market (e.g., multiple Forex pairs or stock indices).
Examples :
EUR/USD vs. GBP/USD – If EUR/USD makes a lower low but GBP/USD doesn’t, it could
indicate bullish strength.
Dow Jones vs. S&P 500 vs. NASDAQ – If NASDAQ is making new highs while the Dow lags, it
may signal weakness in the broader stock market.
Strength & Validity :
Still valid but needs additional confirmation (liquidity sweeps, volume analysis).
4. SMT Divergence vs. RSI Divergence
Why SMT Is Superior to Traditional RSI Divergences
1. RSI Measures Momentum, Not Liquidity – RSI divergence is based on momentum shifts,
which institutions can easily manipulate with fake breakouts or engineered price moves.
2. SMT Focuses on Market Structure & Liquidity – SMT divergence detects institutional
positioning by comparing correlated assets, making it harder to manipulate.
3. RSI Can Remain Overbought/Oversold for Long Periods – Markets can continue trending
despite RSI divergence, while SMT divergence often provides stronger reversal signals.
How Smart Money Manipulates Classic Divergence Traders
Liquidity Sweeps – Institutions use RSI divergence to lure retail traders into premature
reversals before executing stop hunts.
False RSI Signals – In trending markets, RSI divergences often fail, while SMT divergence
provides a more contextual view of smart money positioning.
5. Using TradingView for SMT Analysis
To effectively analyze SMT divergence, traders should monitor at least two correlated assets
simultaneously.
TradingView makes this easy by allowing multiple chart layouts. Steps to Set Up Multiple Charts in TradingView:
a. Open TradingView and click on the “Select Layout” button.
b. Choose a two-chart or four-chart layout to compare correlated assets.
c. Sync timeframes across all charts for consistency.
d. Adjust scaling to ensure price action is easily comparable.
Best Pairs to Compare for SMT Analysis:
Forex : EUR/USD vs. GBP/USD, USD/JPY vs. DXY
Indices : NASDAQ vs. S&P 500, Dow Jones vs. S&P 500
Commodities & FX : Gold (XAU/USD) vs. USD/JPY
Bonds & Equities : 10-Year Treasury Yield vs. S&P 500
6. Key Takeaways
SMT divergence reveals institutional intent by showing liquidity accumulation or
distribution through correlated assets.
Bullish SMT occurs when one asset makes a lower low while the other does not, signaling a
potential reversal up.
Bearish SMT occurs when one asset makes a higher high while the other does not, signaling
a potential reversal down.
Best markets for SMT analysis include Forex pairs, indices, commodities, and bonds, where
correlations are strongest.
SMT is most effective near key liquidity levels, such as session highs/lows, order blocks, and
fair value gaps.
SMT is more reliable during high-impact news events, London & New York sessions, and
quarterly shifts, where institutional activity is highest.
SMT is superior to RSI divergence because it reflects real liquidity dynamics, whereas RSI
can produce false signals.
Combining SMT with market structure shifts like BOS and CHoCH increases trade accuracy
and reliability.
Risk management in SMT trading requires stop-loss placement beyond liquidity grabs and a
minimum 2:1 risk-reward ratio.
Mastering SMT helps traders avoid liquidity traps, improve precision, and align with smart
money moves.
SMT divergence is the footprint of smart money—where one market whispers the truth while the other follows the herd.
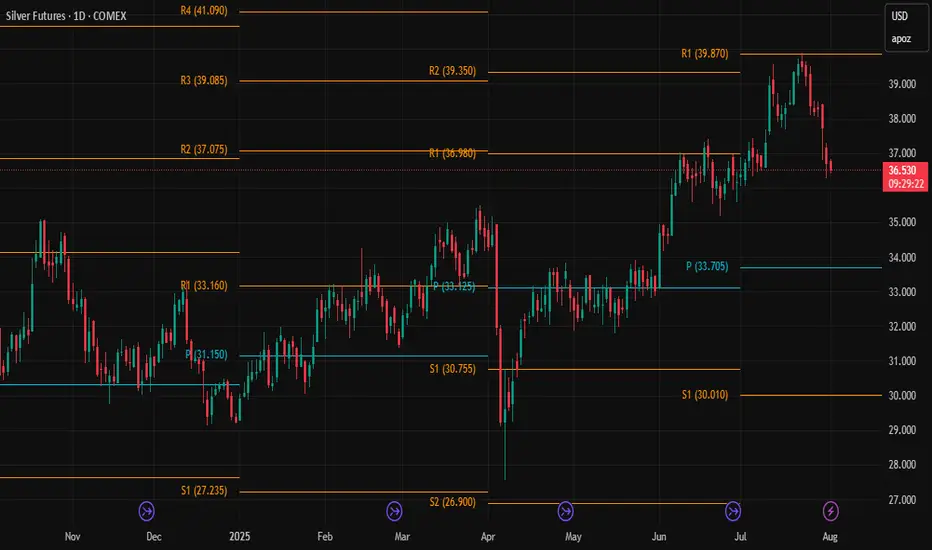
It would be nice to see Silver drop towards the Pivot for a buy.There is no prediction, just looking at the pivots. It would be nice to see silver drop down under 35.00 into the quarterly pivot point to add to positions.
Corning Inc. Quote | Chart & Forecast SummaryKey Indicators On Trade Set Up In General
1. Push Set Up
2. Range Set Up
3. Break & Retest Set Up
Notes On Session
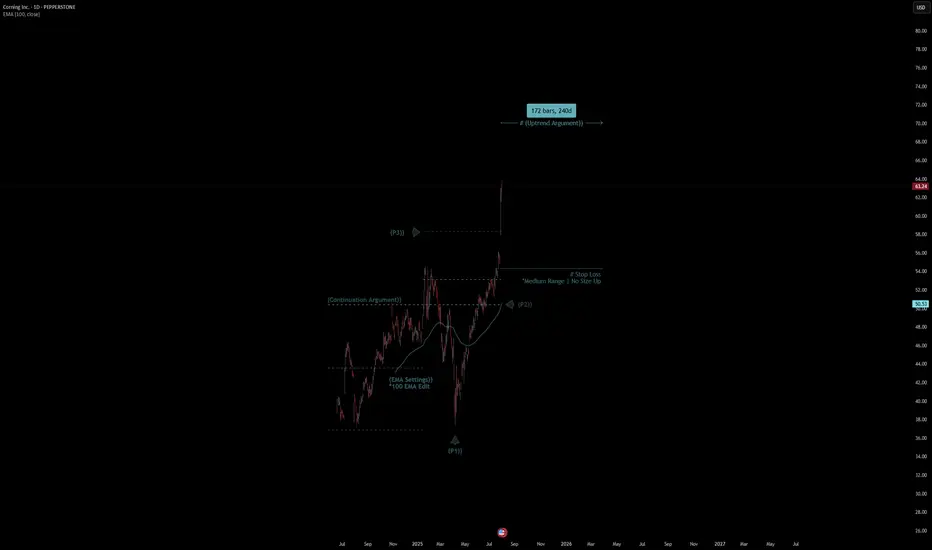
# Corning Inc. Quote
- Double Formation
* (EMA Settings)) - *100 EMA Edit | Subdivision 1
* (Uptrend Argument)) | Completed Survey
- 172 bars, 240d | Date Range
- Triple Formation
* (P1)) / (P2)) & (P3)) | Subdivision 2
* Daily Time Frame | Trend Settings Condition | Subdivision 3
- (Hypothesis On Entry Bias)) | Regular Settings
* Stop Loss Feature Varies Regarding To Main Entry And Can Occur Unevenly
- Position On A 1.5RR
* Stop Loss At 58.00 USD
* Entry At 63.00 USD
* Take Profit At 71.00 USD
* (Uptrend Argument)) & No Pattern Confirmation
- Continuation Pattern | Not Valid
- Reversal Pattern | Not Valid
* Ongoing Entry & (Neutral Area))
Active Sessions On Relevant Range & Elemented Probabilities;
European-Session(Upwards) - East Coast-Session(Downwards) - Asian-Session(Ranging)
Conclusion | Trade Plan Execution & Risk Management On Demand;
Overall Consensus | Buy
short XAU USD If the price returns to the 3296 area in the next hour or two, you can enter with a stop of 3301 with a target of 150 to 200 pips. It is only valid for the next hour or two.
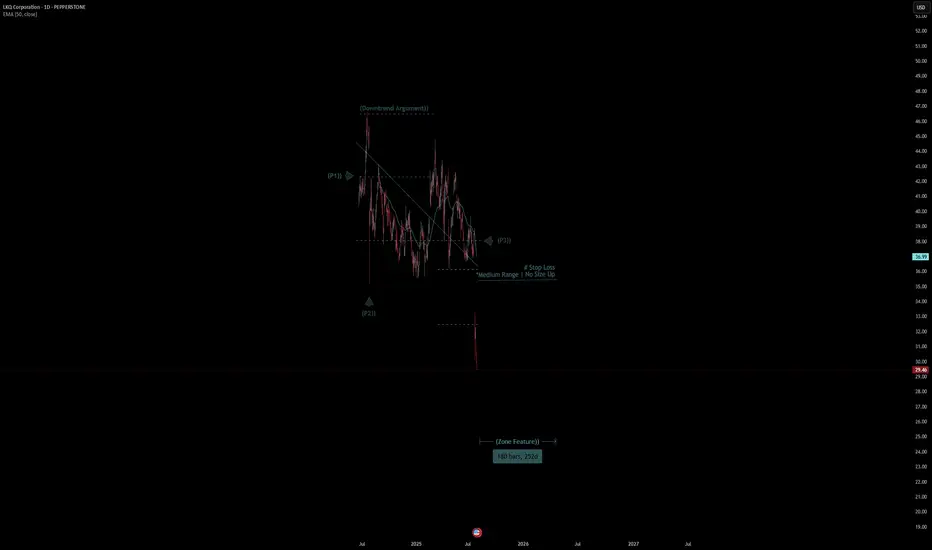
LKQ Corporation Quote | Chart & Forecast SummaryKey Indicators On Trade Set Up In General
1. Push Set Up
2. Range Set Up
3. Break & Retest Set Up
Notes On Session
# LKQ Corporation Quote
- Double Formation
* (Downtrend Argument)) At 45.00 USD | Subdivision 1
* (Diagonal Shift)) | Completed Survey
- Lower Band & Upper Band
- Triple Formation
* (P1)) / (P2)) & (P3)) | Subdivision 2
* Daily Time Frame | Trend Settings Condition | Subdivision 3
- (Hypothesis On Entry Bias)) | Regular Settings
* Stop Loss Feature Varies Regarding To Main Entry And Can Occur Unevenly
- Position On A 1.5RR
* Stop Loss At 32.00 USD
* Entry At 30.00 USD
* Take Profit At 24.00 USD
* (Downtrend Argument)) & No Pattern Confirmation
- Continuation Pattern | Not Valid
- Reversal Pattern | Not Valid
* Ongoing Entry & (Neutral Area))
Active Sessions On Relevant Range & Elemented Probabilities;
European-Session(Upwards) - East Coast-Session(Downwards) - Asian-Session(Ranging)
Conclusion | Trade Plan Execution & Risk Management On Demand;
Overall Consensus | Sell
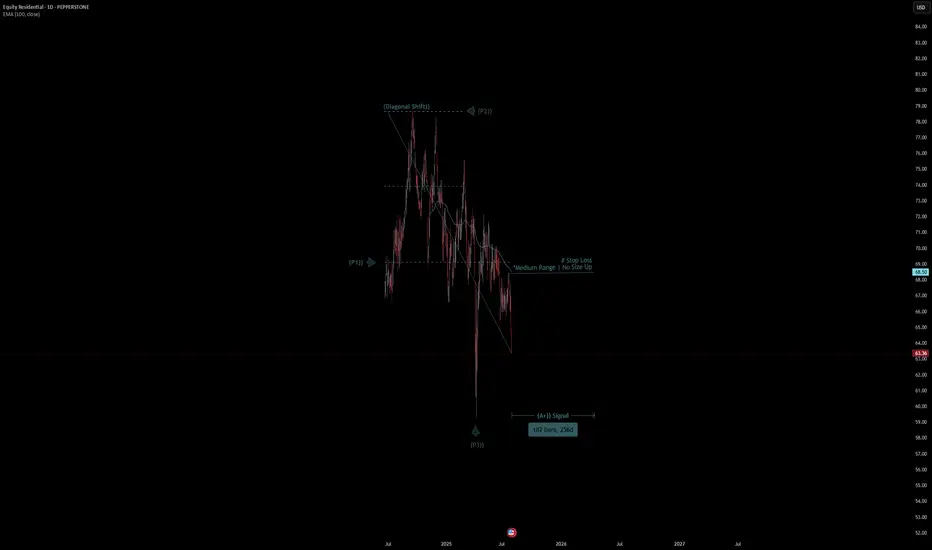
Equity Residential Quote | Chart & Forecast SummaryKey Indicators On Trade Set Up In General
1. Push Set Up
2. Range Set Up
3. Break & Retest Set Up
Notes On Session
# Equity Residential Quote
- Double Formation
* Stop Loss - *Medium Range | No Size Up | Subdivision 1
* 182 bars, 256d | Date Range Method | Completed Survey
- Triple Formation
* (P1)) / (P2)) & (P3)) | Subdivision 2
* Daily Time Frame | Trend Settings Condition | Subdivision 3
- (Hypothesis On Entry Bias)) | Regular Settings
* Stop Loss Feature Varies Regarding To Main Entry And Can Occur Unevenly
- Position On A 1.5RR
* Stop Loss At 68.00 USD
* Entry At 63.00 USD
* Take Profit At 56.00 USD
* (Downtrend Argument)) & No Pattern Confirmation
- Continuation Pattern | Not Valid
- Reversal Pattern | Not Valid
* Ongoing Entry & (Neutral Area))
Active Sessions On Relevant Range & Elemented Probabilities;
European-Session(Upwards) - East Coast-Session(Downwards) - Asian-Session(Ranging)
Conclusion | Trade Plan Execution & Risk Management On Demand;
Overall Consensus | Sell