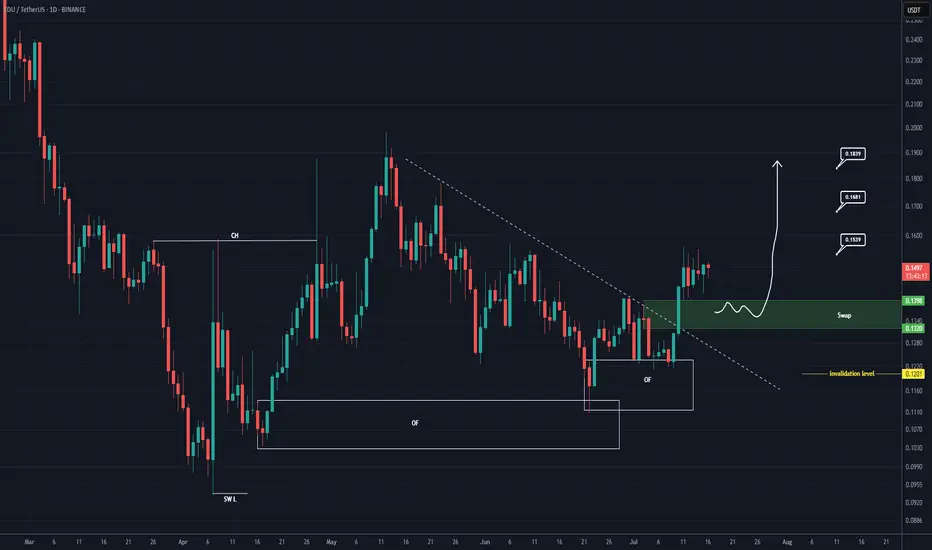
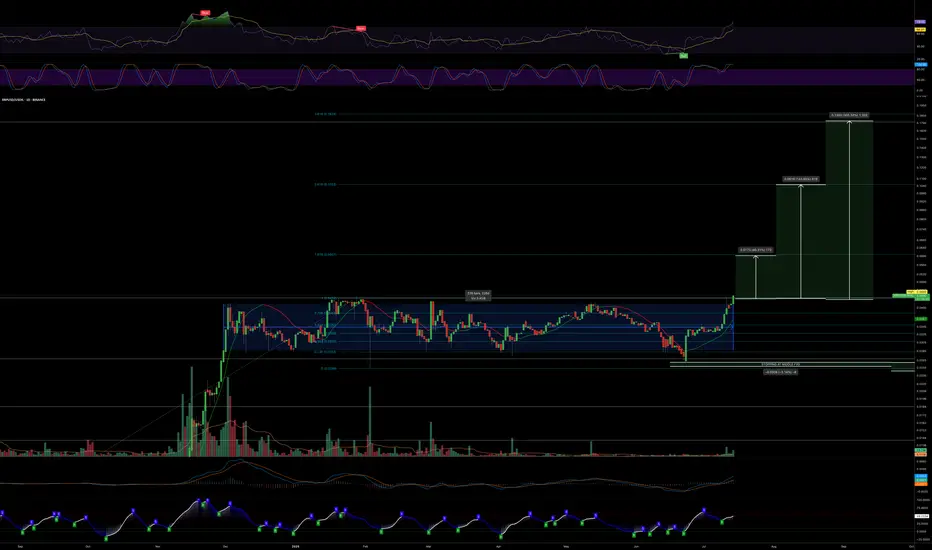
EDU Buy/Long Setup (1D)After forming a swing low, the price has created a bullish Change of Character (CH), and it has flowed well from the origin order blocks.
The trigger line has been broken, and the price has formed a SWAP zone.
Given the bullish signs on the chart, we can consider entering a buy position within the SWAP zone.
The targets are marked on the chart.
A daily candle closing below the invalidation level will invalidate this analysis.
For risk management, please don't forget stop loss and capital management
When we reach the first target, save some profit and then change the stop to entry
Comment if you have any questions
Thank You
Pivot Points
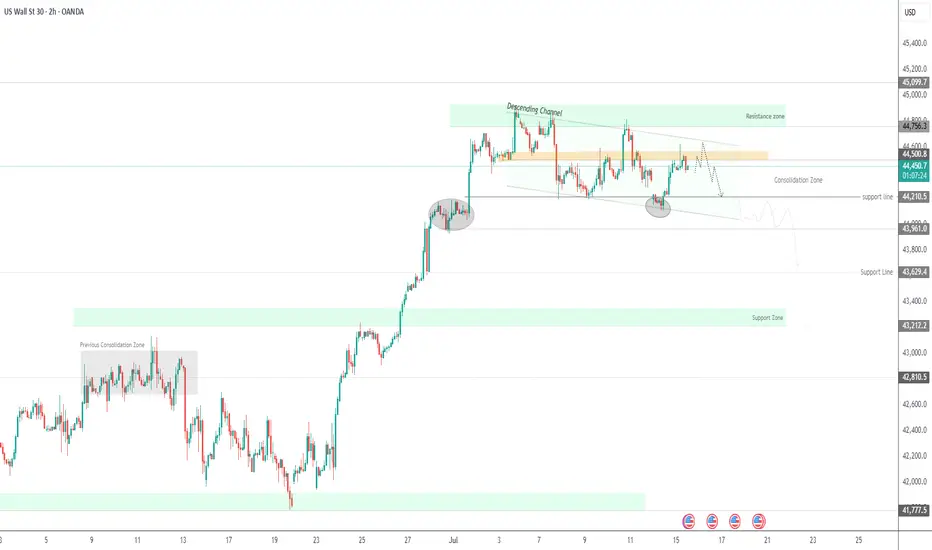
US30 – Bearish Outlook Below 44,500 as CPI Looms US30 – Bearish Outlook Below 44,500 as CPI Looms
US30 rallied and successfully reached our resistance target, as expected in the previous analysis.
However, with today’s CPI release, the market is likely to see increased volatility. As long as the index trades below 44,500–44,570, the bias remains bearish, with downside targets at 44,210 and 43,960.
• If CPI prints below 2.6%, we may see a bullish breakout toward 45,100
• Above or equal to 2.6% supports continuation of the bearish move
However, we expect a 2.7% reading, driven by tariff-related price increases, which would support the bearish scenario.
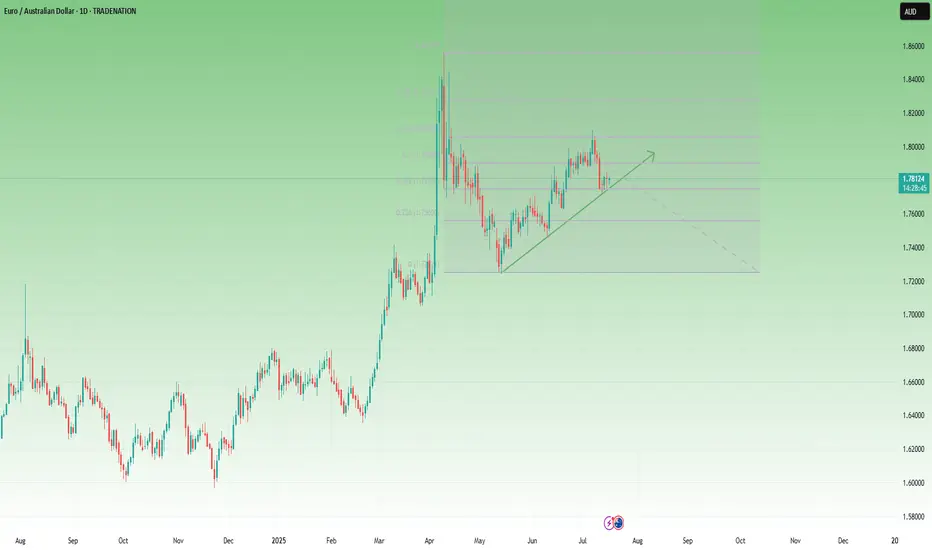
EURAUD Flag Forming Below 1.80 – Time to Sell the Rally?📈 The Big Picture
In mid-February, EURAUD exploded to the upside, gaining over 2000 pips in just two weeks. After peaking near 1.85, the pair corrected sharply, returning to more balanced levels around 1.72.
🕰️ What’s happened since?
The market has resumed its climb and just recently made a new local high at 1.81. On the surface, it looks like bulls are still in control – but a closer look reveals warning signs.
🔍 Key structure observations:
• The current rally appears to be a measured move, topping out near the 61.8% Fibonacci retracement of the previous drop
• Price structure is overlapping, suggesting weak momentum
• A large flag pattern is developing – typically bearish in this context
• The pair still trades above the ascending trendline, but a breakdown is looming
📍 Current price: 1.7805
🎯 Swing Trade Plan
From a swing trading perspective, I’m looking to sell rallies near the 1.80 zone, with:
• Negation: if the price breaks clearly above the recent high
• Target: the recent low around 1.7250 – where the last correction ended
________________________________________
📌 Conclusion:
EURAUD may have exhausted its bullish energy. The technical picture suggests we are in the late stage of the rally, with bearish patterns stacking up. Unless bulls manage a clean breakout above 1.80, this looks like a great place to position for a medium-term reversal. 🚀
Disclosure: I am part of TradeNation's Influencer program and receive a monthly fee for using their TradingView charts in my analyses and educational articles.
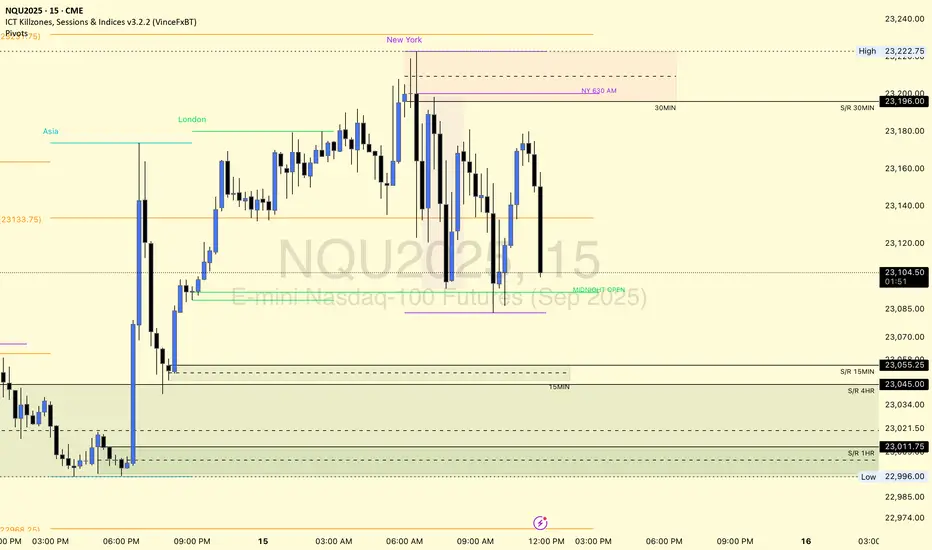
$NQ Supply and Demand Zones 7/15/25This for sharing my S/D zones for SEED_ALEXDRAYM_SHORTINTEREST2:NQ specifically.
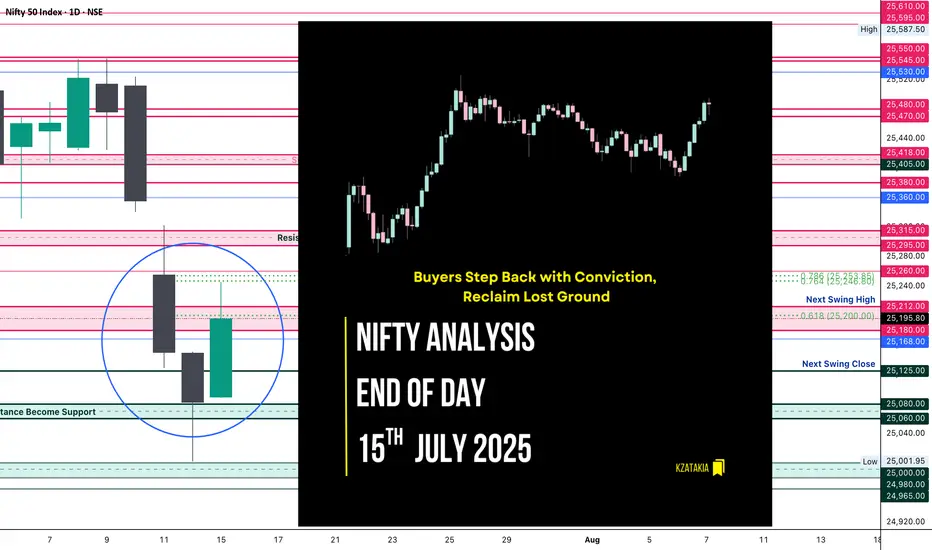
Nifty Analysis EOD – July 15, 2025 – Tuesday🟢 Nifty Analysis EOD – July 15, 2025 – Tuesday 🔴
"Buyers Step Back with Conviction, Reclaim Lost Ground"
Nifty began the session with a flat-to-positive tone, and the first 5-minute candle confidently added 60 points, pushing the index toward 25,150 – aligning with the Previous Day High (PDH). However, the level couldn't hold on the first attempt and Nifty slipped back to the day's open. After a brief consolidation, bulls made a strong comeback.
The second push broke through the PDH, Day High, and the resistance zone of 25,180–25,212, and extended the move up to mark the day’s high at 25,245.20. Post that, the index hovered above the breakout zone and closed solidly at 25,195.80, showing strength and follow-through.
📈 The day’s structure was clean and directional — a healthy bounce and hold above critical levels, reinforcing the idea that buyers are regaining control after last week’s consolidation and weakness.
🕯 5 Min Time Frame Chart with Intraday Levels
🕯 Daily Time Frame Chart with Intraday Levels
🕯 Daily Candle Breakdown
Open: 25,089.50
High: 25,245.20
Low: 25,088.45
Close: 25,195.80
Change: +113.50 (+0.45%)
📊 Candle Structure Breakdown
Real Body: 106.30 points – strong green bullish body
Upper Wick: 49.40 points – profit-taking or resistance at highs
Lower Wick: 1.05 points – negligible dip from open
🔍 Interpretation
Opened flat and quickly built momentum.
Temporary pullback in first 15 minutes was bought into strongly.
Closed with a clean green body, showing clear intraday bullish intent.
Holding above the 25,180–25,212 zone is a big win for bulls.
🕯 Candle Type
Bullish Marubozu-like (strong green body with minimal lower wick) — shows conviction and potential start of a new upswing post recent chop.
📌 Key Insight
25,080–25,100 is now a key base and must be protected.
If Nifty can break and hold above 25,240–25,250, a move toward 25,295–25,315 looks likely.
Failure to hold above 25,180 would be first sign of hesitation.
🛡 5 Min Intraday Chart
⚔️ Gladiator Strategy Update
ATR: 186.18
IB Range: 67.35 → Medium IB
Market Structure: 🟢 Balanced
Trades Triggered
10:30 AM – Long Trade → ✅ Target Achieved, Trailed SL (R:R 1:2.48)
📌 Support & Resistance Zones
Resistance Levels
25,168
25,180 ~ 25,212
25,260
25,295 ~ 25,315
Support Levels
25,125
25,080 ~ 25,060
25,000 ~ 24,980
24,965
💭 Final Thoughts
"Trend is nothing without follow-through — today buyers showed up, but tomorrow they must push past 25,250 to prove it wasn't just a bounce."
✏️ Disclaimer
This is just my personal viewpoint. Always consult your financial advisor before taking any action.
buy jg from pivotgood RR buy from pivot
pre NY open
this is my trading strategy, trade on pivots point
ETH/USDTETH is showing a similar structure to BTC, with a visible gap in play. A partial or full fill of the gap, followed by a bullish structure break on lower timeframes, would be a strong signal of buyer strength.
Waiting for confirmation before acting.

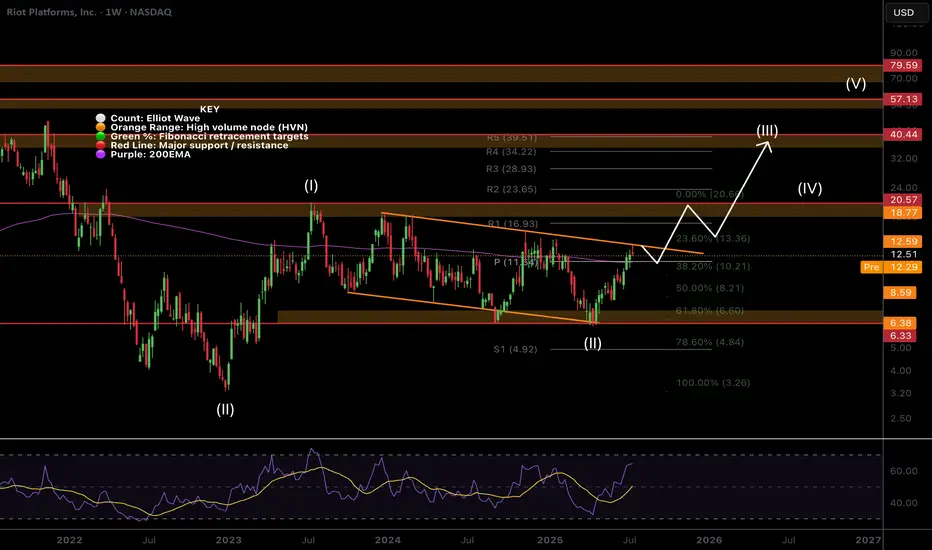
$RIOT Hit The Target Whats Next?NASDAQ:RIOT hit the descending orange resistance were I took partial take profits on my trade this week and it was immediately rejected as expected.
Price is now above the weekly pivot so that is the next support. This level also matches the weekly 200EMA.
Wave (II) hit the 'alt-coin' golden pocket of 0.618-0.786 Fibonacci retracement at the High Volume Node (HVN) support and descending support line which kicked off wave (III).
A breakout above the descending resistance line bring up the the next target of the HVN and previous swing high at $18-20 and $40 following a breakout above that.
Safe trading
$MARA Hits the Weekly PivotNASDAQ:MARA path has been grinding higher clearing the High Volume Node (HVN) resistance where it is sat as support.
The weekly pivot rejected price perfectly so far but if the count is correct and Bitcoin doesn't dump I expect this continue strongly towards the descending orange line resistance as my partial take profit target.
Once that line is broken i am looking at terminal bull market targets of $80 but will of course take profit at key areas along the way.
Wave 2 swung below the descending support and recovered at 0.5 Fibonacci retracement potentially kicking off wave 3.
Safe trading

SPX500 Outlook – CPI Data in Focus, Key Pivot at 6282SPX500 – Market Outlook
U.S. futures are climbing as Nvidia plans to resume chip sales to China, fueling positive momentum across tech and growth sectors.
However, investor caution remains ahead of key events:
Major banks ( NYSE:JPM , NYSE:WFC Wells Fargo, NYSE:C Citigroup) will report earnings, offering insights into the financial sector.
All eyes are on the June CPI report, expected at 2.6%. A higher reading could reinforce bearish pressure, while a softer print would support continued bullish momentum.
Technical Outlook:
SPX500 has bounced from the demand zone and is now trading above the pivot at 6282, which keeps the bullish trend in play.
As long as the price holds above this level, we expect continuation toward 6341, and if broken, extended upside toward 6394.
To shift bearish, price must break and close below 6223, which would open the path toward 6142.
Pivot: 6282
Resistance: 6341 – 6394
Support: 6225 – 6191 – 6142
Event Watch : CPI data release today – anything above 2.6% may trigger downside; below 2.6% could support further upside.
Previous idea:
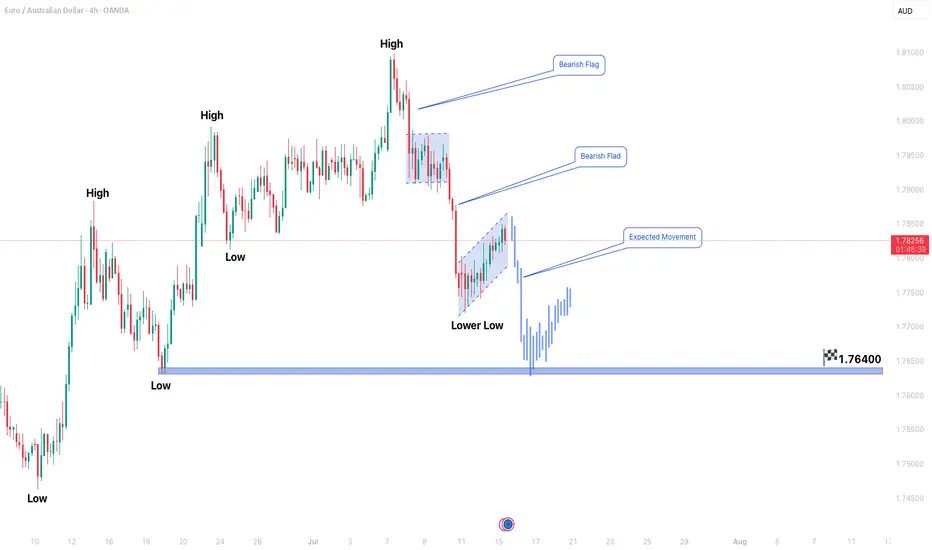
EURAUD FORMING BEARISH FLAG PATTERN IN 4H TIME FRAMEEURAUD Bearish Flag Pattern Suggests Further Downside Ahead
The EURAUD pair is currently exhibiting a bearish flag pattern on the 4-hour chart, indicating a potential continuation of the downtrend. Price action remains confined within a secondary corrective phase, but the primary bearish trend is expected to resume soon. Traders should watch for another bearish flag formation in the upcoming sessions, reinforcing the likelihood of further declines.
Key Observations:
1. Bearish Trend Structure: The pair has been moving in a clear downtrend, with lower highs and lower lows confirming seller dominance.
2. Secondary Trend Phase: The current consolidation represents a temporary pause before the next leg down.
3. Bearish Flag Formation: The flag pattern suggests a continuation signal, with a potential downside target near 1.76400.
Trading Strategy:
- Entry: Consider short positions only after a confirmed breakdown below the flag’s support with strong bearish momentum.
- Target: The measured move projection points toward 1.76400, but partial profits can be taken along the way.
- Stop Loss: A conservative stop should be placed above the recent swing high to limit risk in case of a false breakout.
Risk Management:
- Maintain a disciplined risk-reward ratio (at least 1:2).
- Avoid aggressive entries; wait for clear confirmation (e.g., a strong bearish candle closing below support).
Conclusion:
EURAUD remains bearish, and the formation of another bearish flag reinforces the possibility of further downside. Traders should remain patient for a confirmed breakdown before entering short positions while adhering to strict risk management rules.
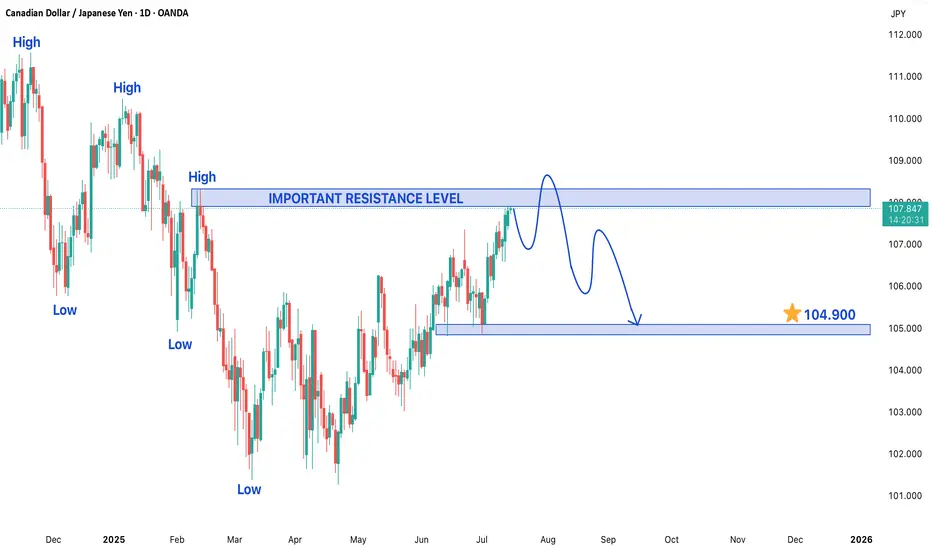
CADJPY TRADING IN A BEARISH TREND STRUCTUREThe CAD/JPY currency pair is currently exhibiting a bearish trend structure, indicating a prevailing downward momentum in its price action. At present, the pair is trading within a secondary trend near a significant resistance level, which is a critical point that could determine its next directional move. Traders and investors are closely monitoring this level as a breakout or rejection here could set the tone for future price movements.
On the lower side, if the bearish momentum continues, the price may decline toward the target of 104.900. This level could act as a key support zone, where buyers might step in to halt further losses. A break below this support could intensify selling pressure, potentially pushing the pair toward lower levels. Conversely, if the price finds stability near this support, a short-term rebound could occur, providing traders with potential buying opportunities in a corrective phase.
On the higher side, if the pair manages to overcome the current resistance, it may attempt to test the next key resistance level at 108.300. A successful breakout above this level could signal a shift in market sentiment, possibly leading to a trend reversal or a stronger corrective rally. However, given the prevailing bearish structure, any upward movement may face strong selling pressure near resistance zones, limiting upside potential.
Traders should remain cautious and watch for confirmation signals before entering positions. Key indicators such as moving averages, RSI, and MACD can provide additional insights into momentum and potential reversals. Risk management strategies, including stop-loss orders, should be employed to mitigate downside risks in case the market moves against expectations. Overall, the CAD/JPY pair remains in a bearish phase, and its next major move will depend on how it reacts to the critical resistance and support levels mentioned.
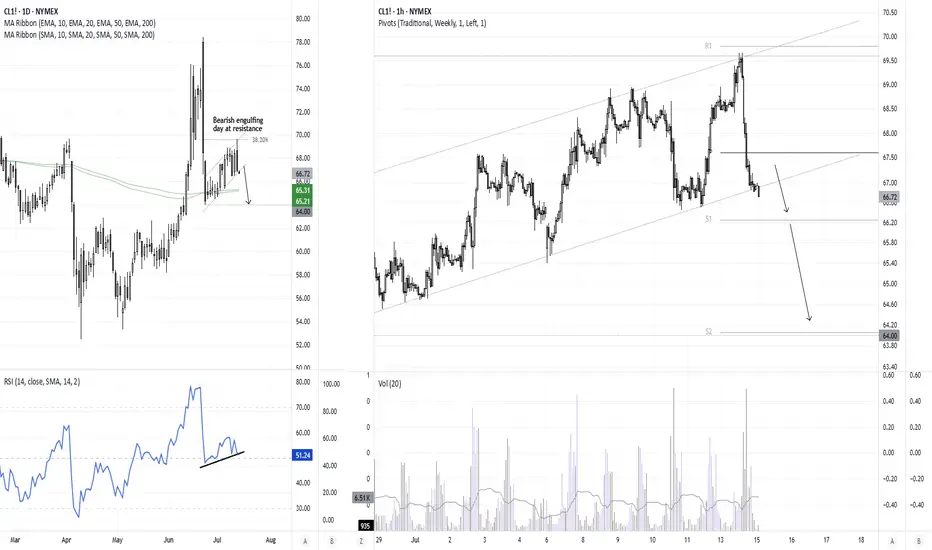
WTI Crude Oil Reverses Lower Near $70 ResistanceA bearish engulfing candle has formed on the daily WTI crude oil chart, with its high perfectly respecting the 38.2% Fibonacci retracement just beneath the $70 handle. Given that the bounce from the June low has been relatively weak compared to the sharp decline from $78, I’m now on alert for a potential break beneath the $64 support level.
That said, the 200-day SMA and EMA currently sit between $65.21 and $65.31, which could offer near-term support. Should oil prices attempt to grind higher within the 1-hour bullish channel, bears may look to fade rallies into the weekly pivot (67.59) or the $68.00 handle, positioning for a potential rollover. A clean break below the 200-day averages would shift focus firmly back to $64, near the June low.
Matt Simpson, Market Analyst at City Index and Forex.com
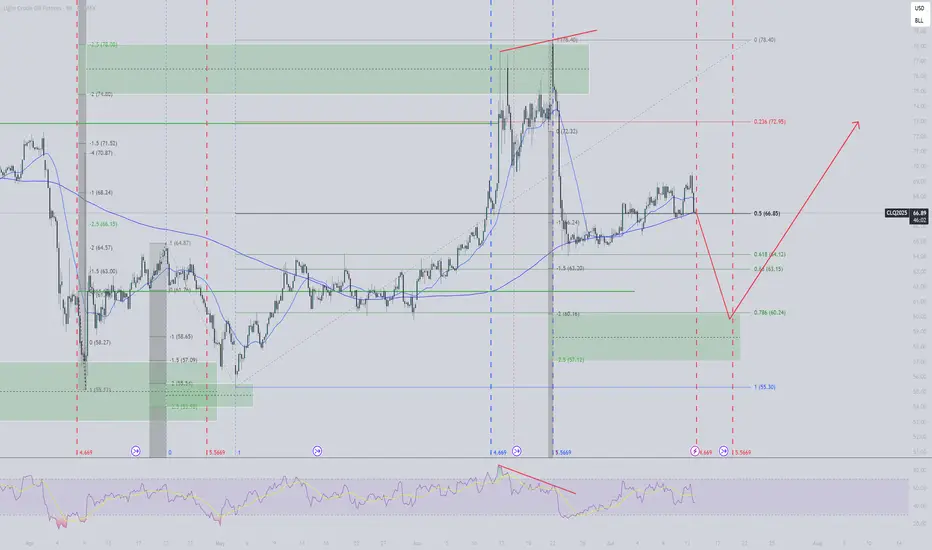
CL down sub $60 before moving up above $73Expected support or reversal zone based on last swing high for CL is at $60. This matches with 0.786 fib level of last move up, suggesting a standard SBS structure forming. Expecting a move up to at least $73 (fib 0.236), possibly also well beyond this.
Based on time fib of last swing high I expect the bottom to occur before July 20th.
#AUDUSD: +1100 Pips Possible Swing Bullish Move! AUDUSD a strong sign of bullish behaviour has appeared alongside bullish momentum. As we have NFP tomorrow, we expect market to remain volatile; what we think now is to have market settled down before we can have any confirmation. We recommend to remain extra cautious tomorrow, once market get settled we can then enter with accurate risk management.
Like, comment and Share for more!
Team Setupsfx_
#ETHUSDT: Currently On The Way Towards Filling The FVG?ETCUSDT is currently experiencing a significant correction as the price approaches a pivotal juncture where a substantial bullish price reversal is anticipated, potentially propelling it to new all-time highs or even surpassing them. It is imperative to exercise meticulous risk management and conduct your own thorough analysis before engaging in any cryptocurrency trading or investment activities.
Should the price indeed undergo a major correction, it is likely to decline to our second designated area, where it is anticipated to fill the liquidity gap and subsequently reverse course, continuing its trajectory towards our established targets.
Please consider this analysis as a secondary influence only, or even solely for educational purposes. It is crucial to conduct your own independent analysis and risk management prior to engaging in any cryptocurrency trading or investment endeavours, as they inherently carry substantial financial risks.
We extend our best wishes and encourage you to trade safely and responsibly.
Should you wish to demonstrate your support, you are welcome to express your appreciation through likes, comments, or sharing this information.
Thank you for your consideration.
Have a pleasant weekend.
Team Setupsfx_

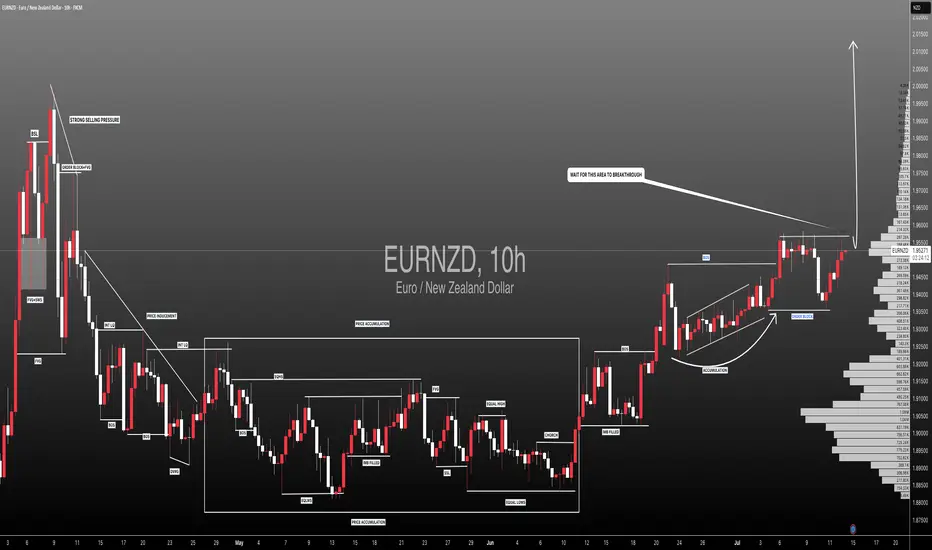
#EURNZD: Wait For Price Breakthrough,Swing Buy With ConfirmationEURNZD is trading at a critical level where the price has previously rejected multiple times. If the price breaks through this region, we could see a swing move and touch the previous higher high. The main question is to wait for a proper breakthrough. When the price does that, we can enter with confirmation. Remember, patience is key!
Good luck and trade safely. Do your own due diligence.
Team Setupsfx_
8 Year XRP / US OIL Range Break out?Not to get ahead of myself, but... The 8 year range XRP has been in is about to give, too.
The fibonaccis on that point to (at current oil prices):
- $110 (also in range of a number I'd called for)
- $165 (also in range of a number I'd called for)
- $1035 (w/ full global adoption and swift - not out of the question, but I hadn't been able to substantiate this high with my current model. But I am over solving in the model and have a lot of conservative assumptions, basic math could support it - but alot of unknowns getting there.)

$XRP / $USOIL is breaking out of the 7.5 month range. It's time.CRYPTOCAP:XRP / TVC:USOIL is breaking out of the 7.5 month range. It's time.
Fibonacci says it's a 4x from here, $12 at current oil prices, within the $8-12 range I'd been calling for.
Other potential pivots (at current oil prices).
- $4.2
- $7.2
If Oil goes up and the chart structure holds - that effectively would be compounding in USD terms.
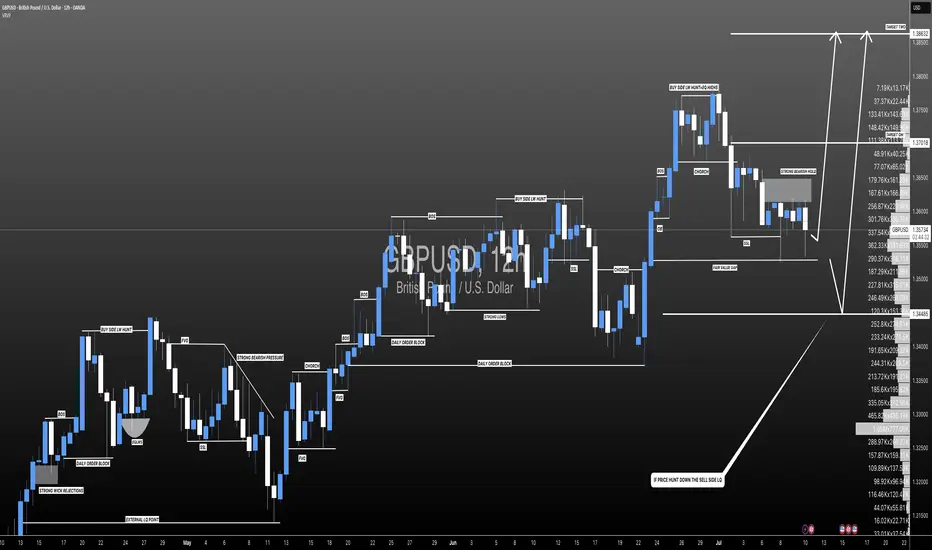
GBPUSD: Two Strong Bullish Area To Buy From ?GU is currently in a bullish trend when examined on a daily time frame. There are two potential areas for purchase. The first area is currently active, as we anticipate a price reversal from this point. There is a significant possibility that price could decline to the second area and subsequently reverse from there directly. The sole reason we believe price could drop to the second area is if the US Dollar experiences corrections, which could cause GU to drop to our second area and subsequently rebound.
If you appreciate our analysis, we kindly request that you consider the following actions:
-Liking the Ideas
-Commenting on the Ideas
-Sharing the Ideas
We extend our sincere gratitude for your continuous support. We trust that our insights have provided even a modicum of assistance.
Team Setupsfx_
❤️🚀
Nifty Analysis EOD – July 14, 2025 – Monday🟢 Nifty Analysis EOD – July 14, 2025 – Monday 🔴
"Broken Support, Fought Resistance – Tug of War in Play"
Nifty began the day with a classic Open = High (OH) setup, instantly rejecting any bullish intent. The crucial support zone of 25,080–25,060 was taken out early, and the market went on to mark the day's low at 25,001.95, a level that quickly turned into a decisive battleground.
After a bounce from the low, 25,125 emerged as a stiff resistance that pushed the index back below the broken support zone. For most of the session, the same support zone turned into resistance — a textbook polarity flip. However, in the final hour, Nifty showed resilience and finally closed back above 25,080, ending the session at 25,082.30.
🔄 The structure was full of failed intraday breakouts, signaling confusion and conflict — likely fueled by a wider CPR, imbalanced market structure, and medium IB of 109 pts. It was a low-volatility session, but packed with psychological tests.
🕯 5 Min Time Frame Chart with Intraday Levels
🕯 Daily Time Frame Chart with Intraday Levels
🕯 Daily Candle Breakdown
Open: 25,149.50
High: 25,151.10
Low: 25,001.95
Close: 25,082.30
Change: −67.55 (−0.27%)
📊 Candle Structure Breakdown
Real Body: 67.20 points – small to moderate bearish body
Upper Wick: 1.60 points – negligible upside attempt
Lower Wick: 80.35 points – strong defense from day’s low
🔍 Interpretation
Opened higher but got instantly rejected (OH formation).
Sellers took charge early but failed to hold momentum all the way.
The long lower wick reflects buyer presence at key 25,000 zone.
The close below open but above reclaimed support suggests tug of war — with bulls slightly redeeming themselves by EOD.
🕯 Candle Type
Hammer-like red candle — while bearish on close, the long lower shadow indicates potential exhaustion of selling and hints at reversal if follow-through buying emerges next session.
📌 Key Insight
25,000–25,020 has emerged as crucial near-term support.
A strong open or close above 25,150–25,180 may confirm a bullish reversal setup.
Breakdown below 25,000 opens the door for a fall toward 24,950 or lower.
🛡 5 Min Intraday Chart
⚔️ Gladiator Strategy Update
ATR: 188.77
IB Range: 109.20 → Medium IB
Market Structure: 🔴 Imbalanced
Trades Triggered
09:50 AM – Long Trade → ❌ SL Hit
01:05 PM – Short Trade → ❌ SL Hit
📉 Tough day for directional trades — false breakouts dominated.
📌 Support & Resistance Zones
Resistance Levels
25,125
25,168
25,180 ~ 25,212
25,260
25,295 ~ 25,315
Support Levels
25,080 ~ 25,060
25,000 ~ 24,980
24,965
💭 Final Thoughts
“Reclaimed ground doesn’t mean victory – yet. Watch the next move. Rejection below 25,000 ends the bulls' narrative; a strong move above 25,180 rewrites it.”
✏️ Disclaimer
This is just my personal viewpoint. Always consult your financial advisor before taking any action.

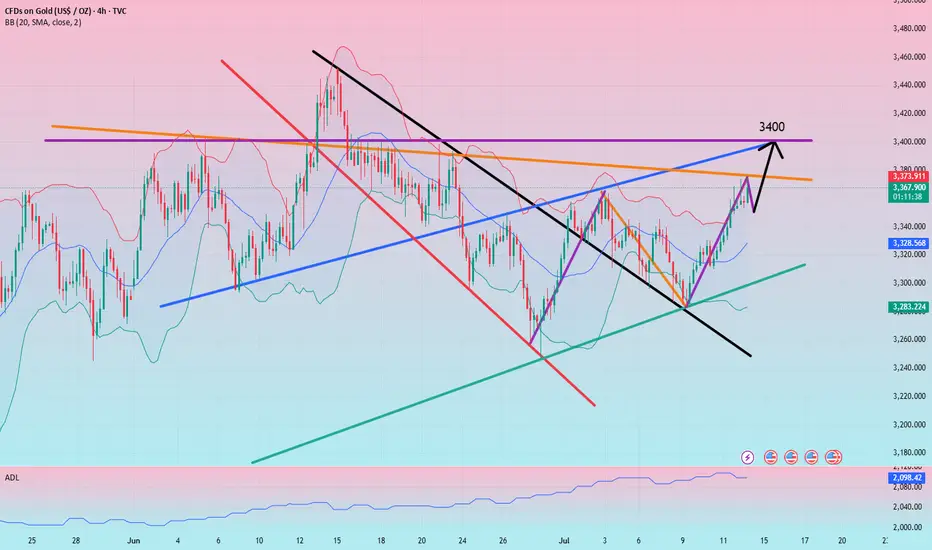
Gold continues to rise after keeping low and breaking high
Last Thursday and Friday, I repeatedly mentioned the position of 3344 to my members. As a strong resistance position in the early stage, every time the price falls below the low point, the pressure to find the bottom and rebound is this area, and then continue to break the low under pressure. This time, we emphasize that breaking through and standing firmly on 3344 is the key. If it can break through and stand firmly, the next resistance is 3358, followed by 3373.
Now the price has broken upward as expected, completing the qualitative change. The next step is to look at the switching of space. Keep low and break high to see acceleration. After breaking the low point, consider sweeping.
Specific key points are expanded:
1. The daily line pattern is still closing and flat. The lifeline is the space switching point in the past one or two months, which will determine the subsequent market space rhythm. At present, the price has successfully broken through the lifeline and switched upward to enter the lifeline to the upper track. 3339-3396
Then, in the case of subsequent market holding the lifeline, maintain the upper range sweep, yes, it is still the rhythm of sweeping, just change the space
2. The four-hour pattern opens slightly upward, pointing to the upward direction
Starting from the lower track 3283 of the squat probe pattern, it has risen steadily. After repeatedly determining the lifeline position 3310 area, it will start to rise further and the pattern will open upward
The lifeline position coincides with the support 3330-3328 area repeatedly determined last Friday, and together they become the last defensive dividing line for the bulls to rise
3. The double-line interval 3330-3325 of the hourly chart has become a space switching area, which previously suppressed the price from falling further, and now it has turned into support, and will rely on the price to further rise Step up, pay attention to the role of the dividing line
4. Maintain the idea of switching with the same profit space, start from 3283 and calculate 3313, then 3328, then 3343, then 3358, and finally 3373, and then 3388, and 3403 (here needs to be highlighted)
5. As shown in the figure, the purple large channel range is swept, the space range is about 100-150 US dollars, this wave of increase is about 100 US dollars, and there is still room to pay attention to. The upper track of the channel overlaps with the upper track of the daily line pattern in the 3396-3400 area, and the 3403 position mentioned above together become the next space dividing line area
In summary, for the current gold, it is still in the rising stage, and the idea remains low and bullish. Pay attention to the process The intensity and amplitude of the adjustment can be squatted to gain leverage, or sideways for a period of time to gain space. Both are ways of correction. After the correction is completed, continue to be bullish and break through.
Referring to this idea, we gave a long position from 3358-3356 in the afternoon. As expected, it sprinted to 3375 as of press time. Those who keep positions should pay attention to the upward loss point, and then pay attention to further rise.
Of course, today's trend will be more tiring, so there is still an opportunity to step back and buy low. Pay attention to the 3364-3362 position to continue to buy low (aggressive 3366 can start), stop loss 3355, target 3380-3388
Another extreme sweep needs to pay attention to the 3342-3339 and 3330-3328 areas. This needs to be determined according to the situation. Pay attention to 3388 and 3396-3403 when switching upward.