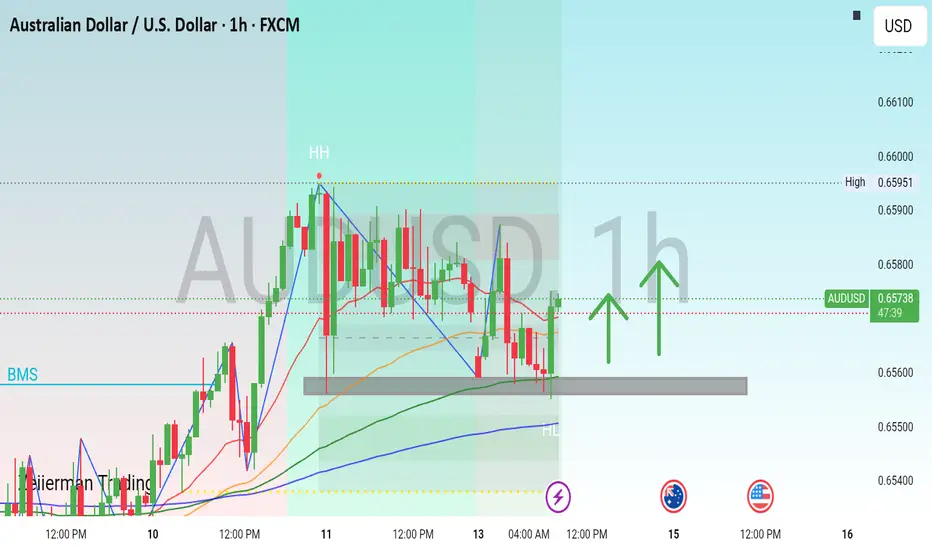
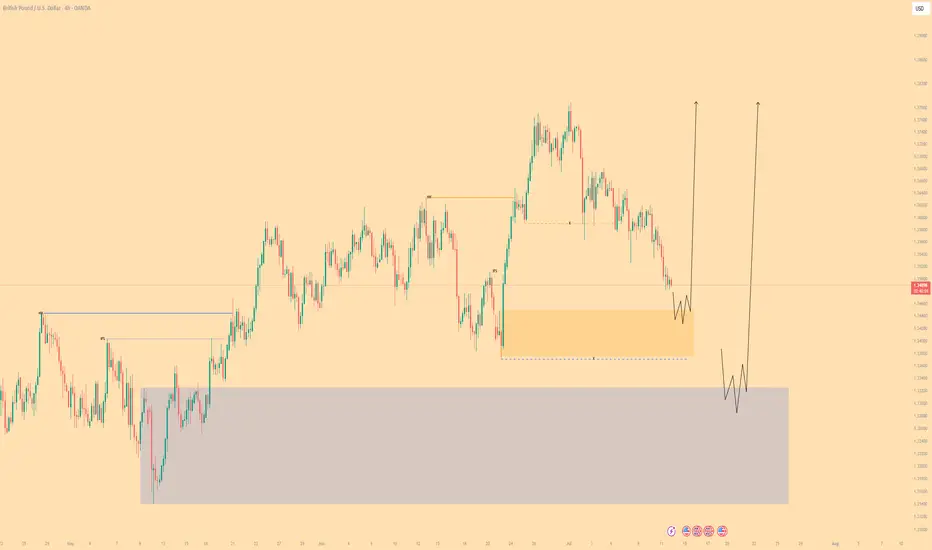
FULL BACK SUPPORT LEVEL 📉 AUDUSD – Potential Rebound from Key Support
Price is currently responding to a well-established horizontal support level, indicating a possible short-term bullish retracement.
The appearance of a bullish imbalance candle on the 1-hour timeframe further strengthens the case for a recovery move.
🎯 Target: 0.658
🕐 Timeframe: 1H
📌 Outlook: Short-term Bullish
Pivot Points
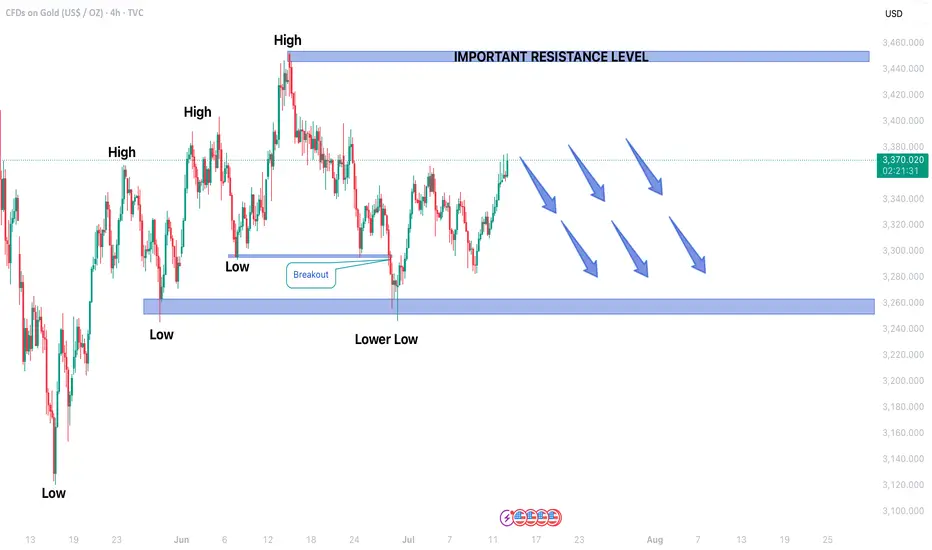
WTI Crude Oil Analysis – 4-Hour TimeframeWTI Crude Oil Analysis – 4-Hour Timeframe
At the moment, the price is trading below a key resistance zone (marked in red), which has previously triggered multiple pullbacks. The current price behavior near this area reflects market hesitation to break through this level.
🔴 Bullish Scenario:
If the price manages to break above this resistance zone and holds above it, we can expect the upward movement to continue toward higher resistance levels. This move may unfold in a step-by-step trend, accompanied by intermediate pullbacks. The next resistance zones could act as potential targets for the bullish wave.
🔴 Bearish Scenario:
If the price reacts negatively to the current resistance area and fails to break through, a bearish correction may follow. In this case, the nearby short-term support levels could be the first targets for sellers. If those supports are also broken, the likelihood of a deeper decline and continuation of the downward trend increases.

GOLD TRADING IN BEARISH TREND IN 4H TIME FRAMEGold price forming Lower lows which indicated Bearish trend movement.
Price is currently moving in Secondary Trend.
In upcoming sessions secondary trend may end and price may start forming Primary trend.
After a candlestick reversal pattern, Gold may continue to fall.
Price may hit the support level of 3250$ in upcoming sessions.
On higher side 3450$ may act as an important resistance level.
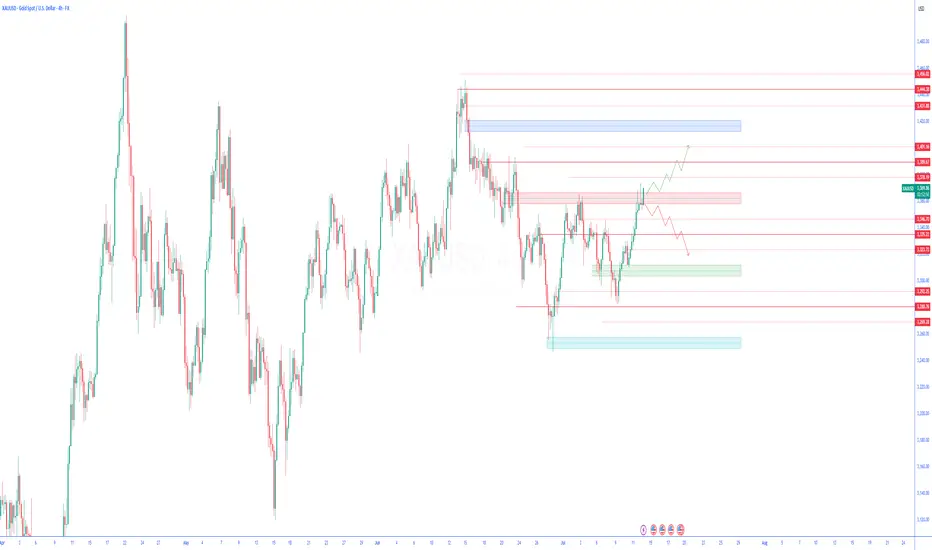
Gold (XAUUSD) Analysis – 4-Hour TimeframeGold (XAUUSD) Analysis – 4-Hour Timeframe
Currently, the price is moving in an upward trend and approaching a key resistance area. Recent volatility suggests that buyers have shown enough strength to break through previous resistance zones and are now attempting to overcome the next significant barrier ahead.
🔴 Bullish Scenario:
If the price manages to break above the current resistance and hold above it, we can expect a continuation of the upward move toward higher zones. In this case, the bullish wave could extend toward the next resistance levels (marked in blue).
🔴 Bearish Scenario:
If the price reacts negatively to the current resistance area and fails to break above it, a corrective decline may follow. The nearest support zone below could play a crucial role in maintaining the bullish structure. However, if this support is also broken, the path could open for a deeper pullback toward lower support levels.
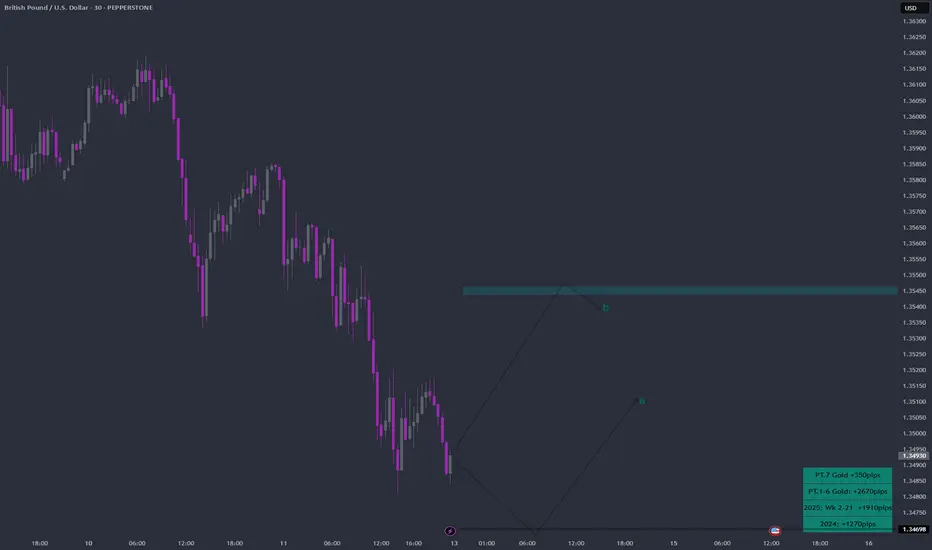
GBPUSD Week 29 Swing Zone/LevelsAfter 7 straight weeks of profitable gold trading, we’re shifting gears to GBPUSD.
Why this pair? It’s offering a classic low-risk, high-reward setup that many traders appreciate:
🔒 Stop Loss: 10–15 pips
🎯 Take Profit: 50–100 pips
We’re analyzing price action using a simple but powerful concept:
Each zone is drawn based on how the high and low of one day compares with the next. For example:
Monday’s high/low vs Tuesday’s range
Tuesday’s vs Wednesday’s, and so on
This method helps spot potential continuation zones as market structure unfolds across the week.
👉 The key? Patience, and letting the levels tell the story.
As always price action determines trades
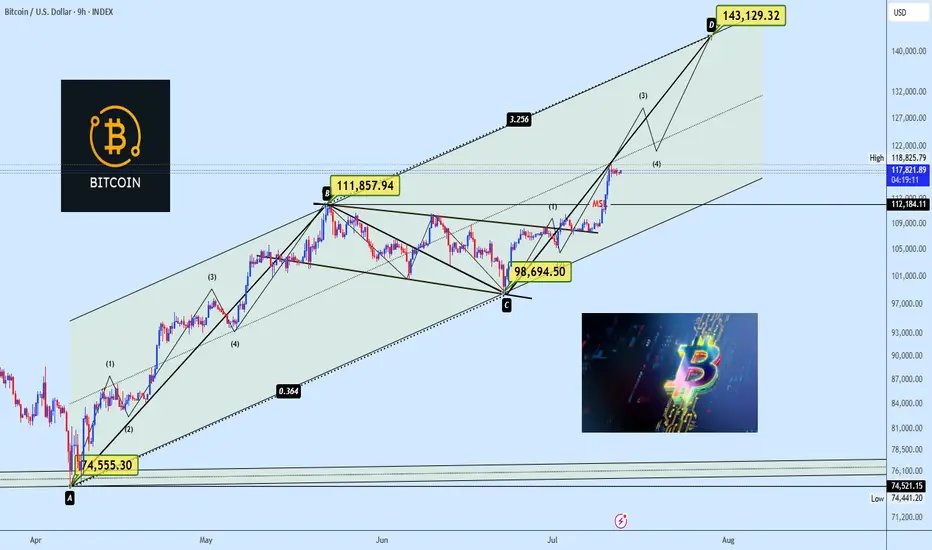
BTC Breakout is Real Flag Playing Out with Wave 3 MomentumBitcoin is looking really clean here. After weeks of sideways grind inside what looked like a consolidation trap, the structure has finally matured into something meaningful, a classic bullish flag breakout layered inside a broader Elliott Wave count.
What really stands out is how the flag structure (B → C) formed a smooth pullback after the strong A → B impulse. That was the pole. Now we’ve broken out of the flag, and momentum is picking up again, likely heading into wave (3) of the new leg pointing towards D.
This isn’t just about a flag the entire move is developing inside a wide ascending channel, and price is following it almost perfectly. The bullish momentum coming off the breakout zone is clean, no choppiness just strong candles and impulsive drive.
We might get a short-term breather (sub-wave 4 of current wave 3), but structure suggests more upside is likely as long as price holds above that $113K–$115K zone.
What I'm Watching Right now:
Support zone: $113K – $115K
Short-term target: $123-$127K
Final projection (if channel holds): $140K–$145K
Measured move from the flag and wave count both point up there, so I’ll be watching for minor pullbacks as entry opportunities.
Personal Take
I like when patterns align naturally not forced. This one’s got that nice blend of momentum, structure, and price behavior. I’m not rushing entries here, but will scale into dips if price holds support and volume confirms.
Have you spotted this setup on your end too? Drop your view in the comments always keen to see how others are reading this.
Follow for clean, no hype market breakdowns.
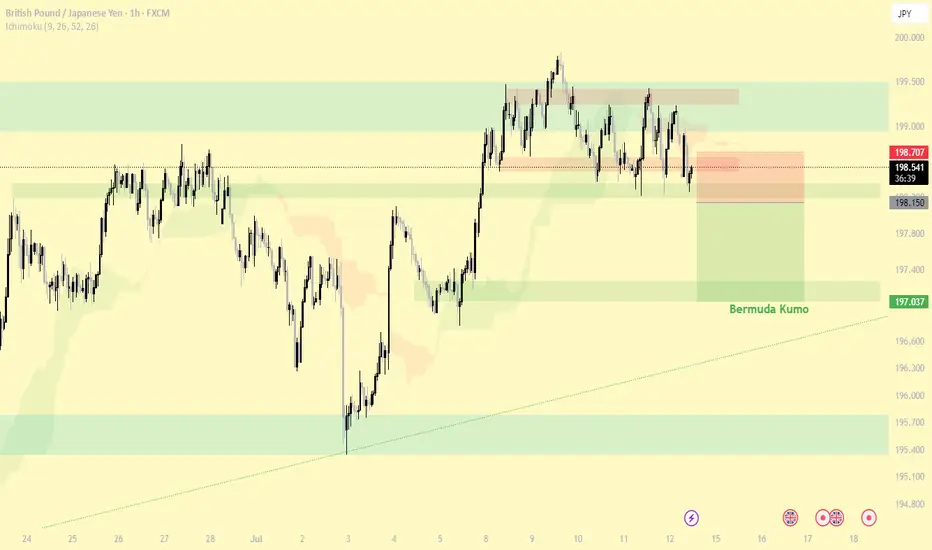
#GBP/JPY Monday 14 Jul 2025Reasons for entering the trade:
1- Breaking the last low of the high and the range area
2- Breaking the 4H support
3- Bermuda Kumo (4H)
Entry: 198.150
TP: 197.037
SL: 198.218
GBPUSD| - Bullish BiasHTF Overview (4H): Strong bullish structure in play, with multiple highs being broken and momentum firmly to the upside. Price is clearly respecting bullish order flow, suggesting continuation.
MTF Refinement (30M): Identified a 30M OB aligned with the trend. Waiting for price to mitigate this zone, as it could serve as the springboard for the next impulsive leg up.
Execution Plan: Once the 30M OB is mitigated, I’ll drop to LTF (1M/5M) to watch for confirmation — CHoCH, BOS, or microstructure shift — before executing longs.
Mindset: Bull momentum is intact — patience and confirmation are key to riding it with precision.
Bless Trading!
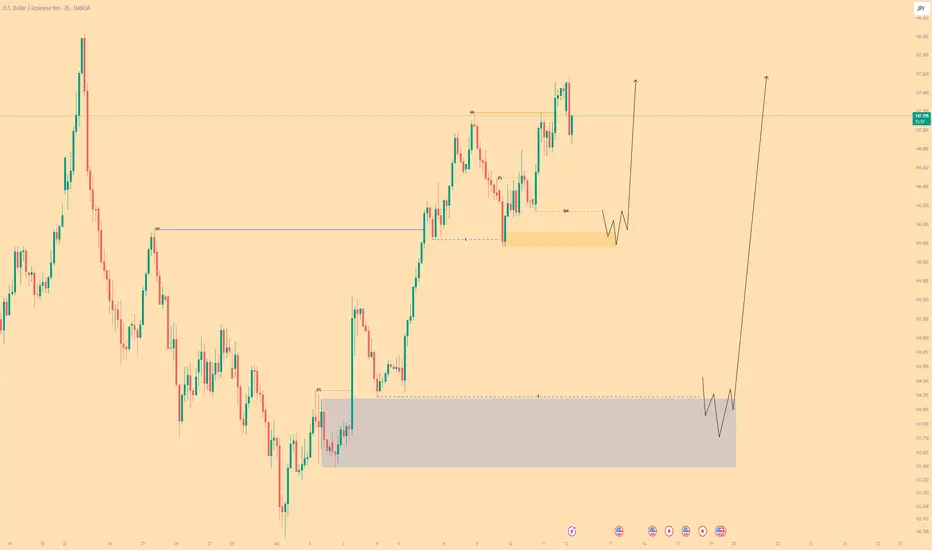
USDJPY| - Bullish Play Within Bearish HTF ContextHTF Overview (4H): Structure is still technically bearish, with buy-side liquidity (BSL) untouched and a major 4H supply OB unmitigated above. Expecting price to seek out that zone before any full reversal.
MTF Refinement (30M): Refined structure shows a potential bullish leg forming to push toward the 4H supply. Price is reaching for nearby sell-side liquidity (SSL), acting as inducement.
Execution Plan: Waiting for a clean sweep of SSL. Once that occurs and the 30M OB is mitigated, I’ll drop to LTF (1M/5M) to confirm bullish intent with CHoCH or BOS before executing a long.
Mindset: Playing the internal bullish wave with precision while respecting higher timeframe narrative. Quick to react if the HTF bias reasserts itself.
Bless Trading!
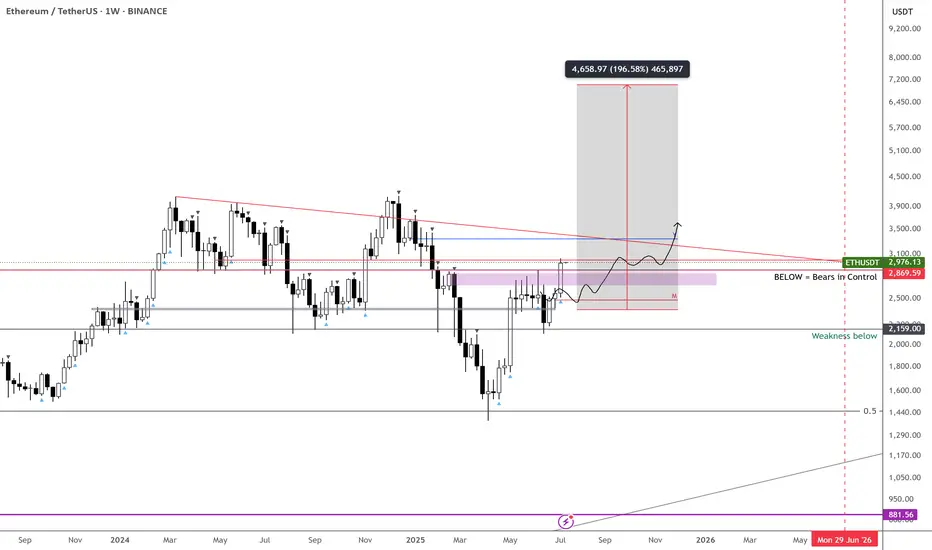
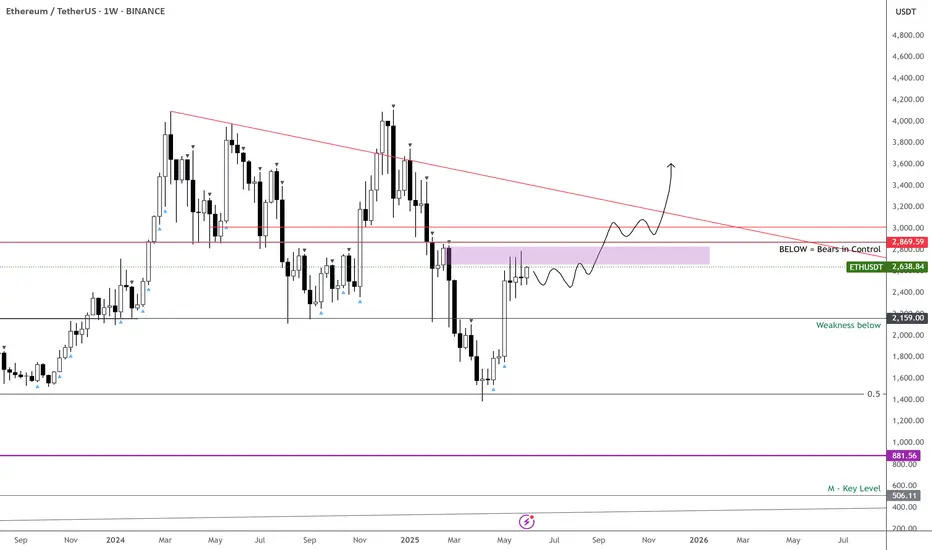
ETH – $7k Target in Sight
7k incoming on CRYPTOCAP:ETH —timing is up in the air, but the chart looks stellar.
A decisive break above $3,500 should kick off aggressive expansion.
Meanwhile, ETHBTC has been rallying hard off its lows; I’m eyeing a 50% gain against BTC over the next 2–3 months.
Holding through this strength makes sense—it’s been a long time since we’ve seen these setups.
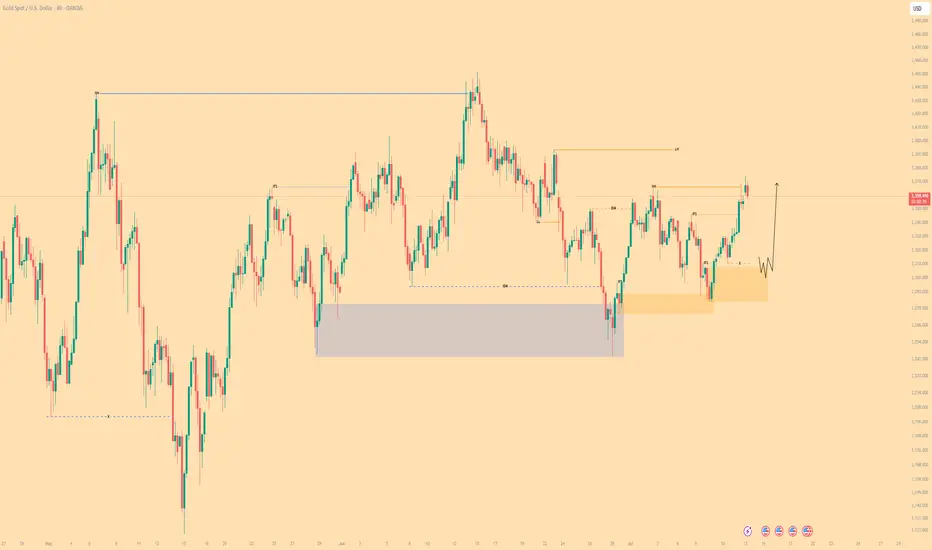
XAUUSD (GOLD) - Bullish BiasHTF Overview (4H): Structure remains bullish after a recent break of highs. Liquidity above was taken, followed by a clean mitigation of a 4H OB — signaling strength and smart money continuation.
MTF Refinement (30M): Aligned with the bullish narrative, 30M shows price is likely reaching for nearby sell-side liquidity before resuming the upward move. Watching for price to sweep that liquidity zone next.
Execution Plan: Once the 30M OB is mitigated, I’ll drop to the 1M/5M for internal structure shifts — CHoCH or BOS — to confirm long entry.
Mindset: Not chasing — letting liquidity play its role and waiting for the OB + confirmation confluence before executing.
Bless Trading!
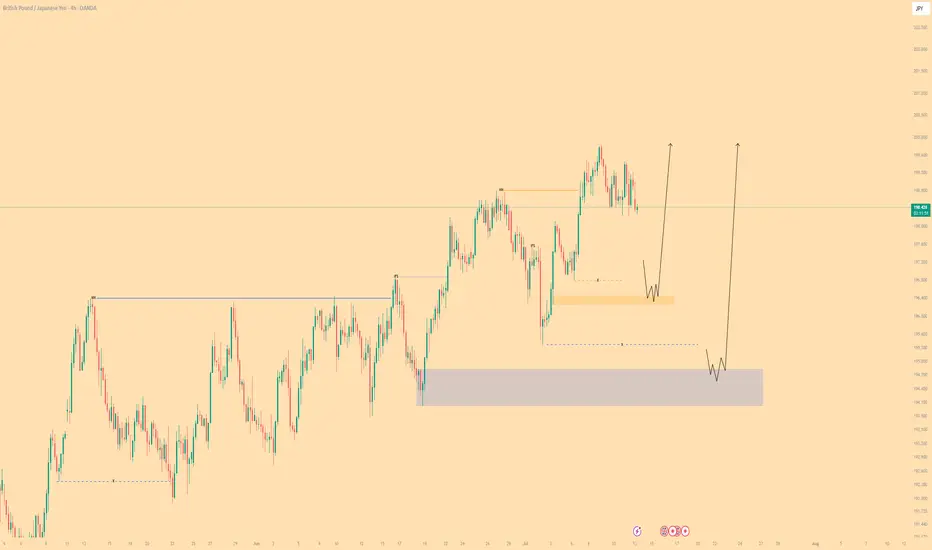
GBPJPY - Bullish BiasHTF Overview (4H): Price broke bullish structure with clean directional intent. Order flow remains aligned to the upside with no immediate signs of weakness.
MTF Refinement (30M): Zoomed into 30M for deeper structure clarity. Observing price actively reaching for sell-side liquidity (SSL) below a key low — a classic inducement setup forming.
Execution Plan: Waiting for a liquidity sweep below the SSL. Once swept, I’ll monitor the nearby 30M OB for mitigation. LTF confirmations (1M/5M CHoCH or BOS) will be needed before committing to a long entry.
Mindset: Patience over prediction — let liquidity do its job, then ride with smart money.
Bless Trading!
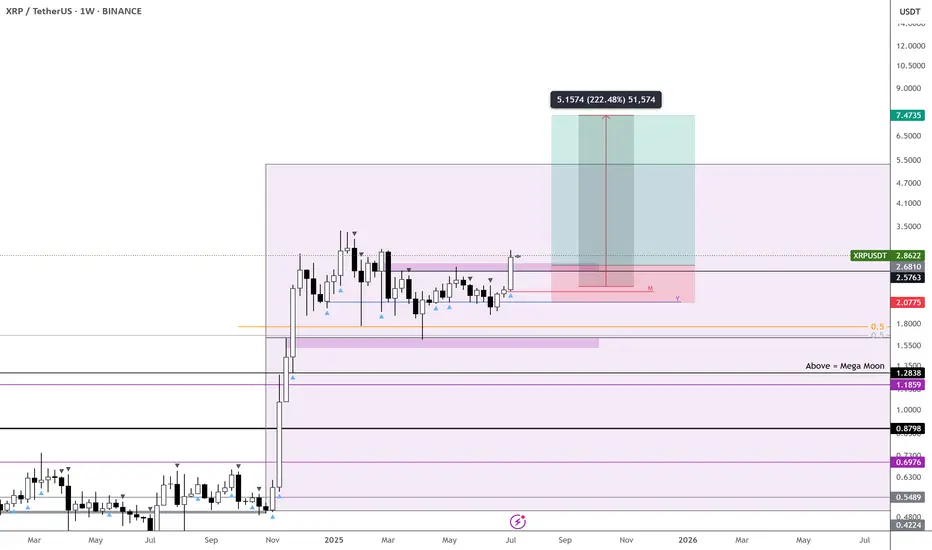
XRP – Dual Trends Active, Ready to Outperform - $7 Incoming
Two active trends on CRYPTOCAP:XRP right now—monthly and weekly confirmations are in, which significantly boosts the probability of hitting the first target.
Honestly, I see this outperforming CRYPTOCAP:ETH , though both are worth holding.
With both timeframes aligned, I’m expecting a strong move.
Targeting $7 on CRYPTOCAP:XRP and over $7k on $ETH.
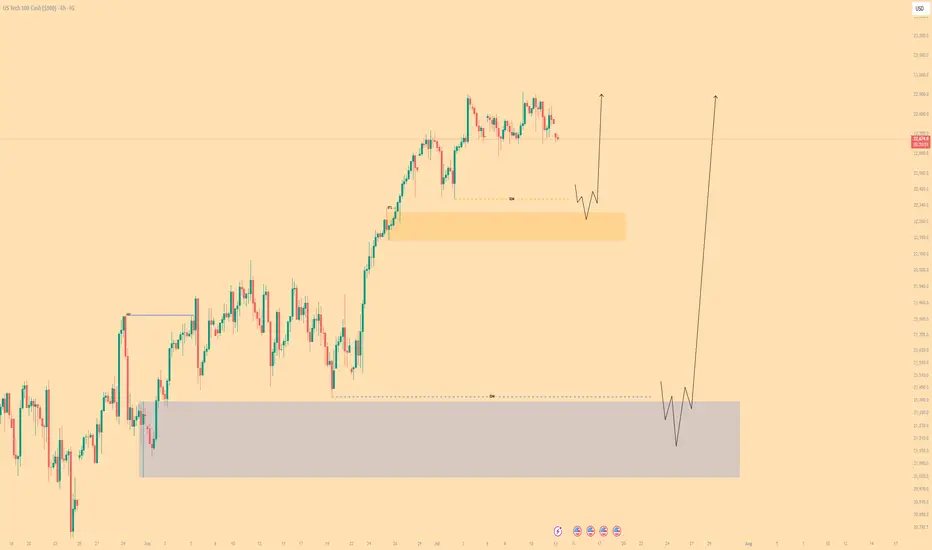
NASDAQ - Bullish BiasHTF Overview: 4H shows strong bullish intent with momentum driving price higher. Clear upside direction supported by sustained breaks in structure.
Liquidity Note: Noticed a key liquidity zone beneath current price (marked in blue). Although deeper mitigation was possible, price remained bullish.
MTF Refinement (30M): Dropped to the 30M for structural clarity and saw an earlier reaction. A bullish OB was formed and respected — now monitoring it for a potential mitigation.
LTF Execution Plan: If the 30M OB is revisited, I’ll be looking to the 1M/5M for confirmation (CHoCH or BOS) before executing long positions.
Mindset: Momentum is with the bulls — just waiting for smart money to confirm their next move.
Bless Trading!
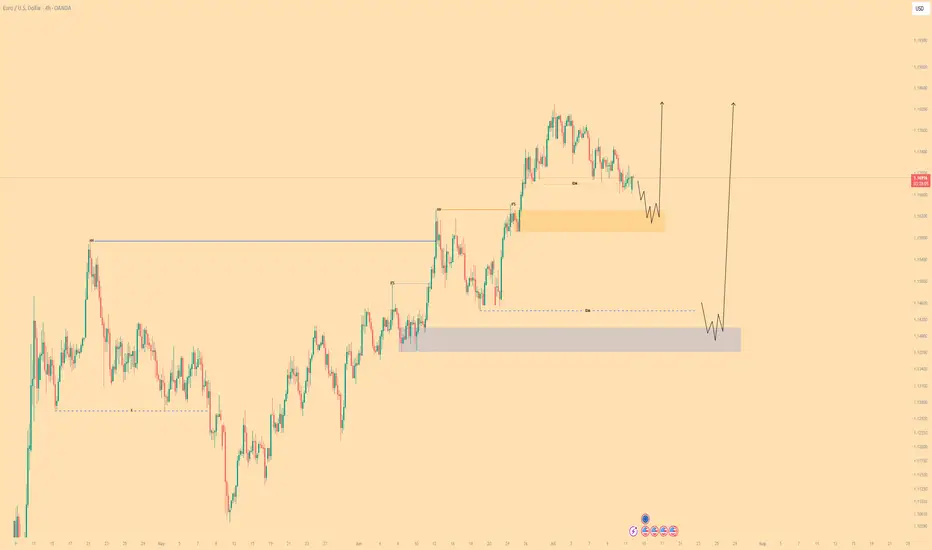
EUR/USD| - Bullish BiasHTF Context: Noted a clear break of structure to the upside, signaling strong bullish intent. Originally expected a deeper liquidity grab, but price shifted before reaching lower zones.
MTF Refinement: Dropped down to the 30M for better alignment — spotted a liquidity sweep confirming smart money interest.
LTF Execution Plan: Now watching for mitigation of the 30M OB. Once tapped, I’ll look for internal structure shift (1M/5M BOS or CHoCH) to confirm continuation.
Mindset: Staying patient — if price wants higher, it should respect this OB and show its hand first.
Bless Trading!
ETH – Watching the $2,900 Trigger for ATHsJust need BINANCE:ETHUSDT to break above $2,900 for the next trigger.
Feeling confident it will chew through the current supply zone.
Plenty of other coins are already showing clear direction, and Ethereum should follow.
Be patient—I doubt ETH will challenge the #1 spot, but a move above $2,900 opens the door to a potential new ATH.
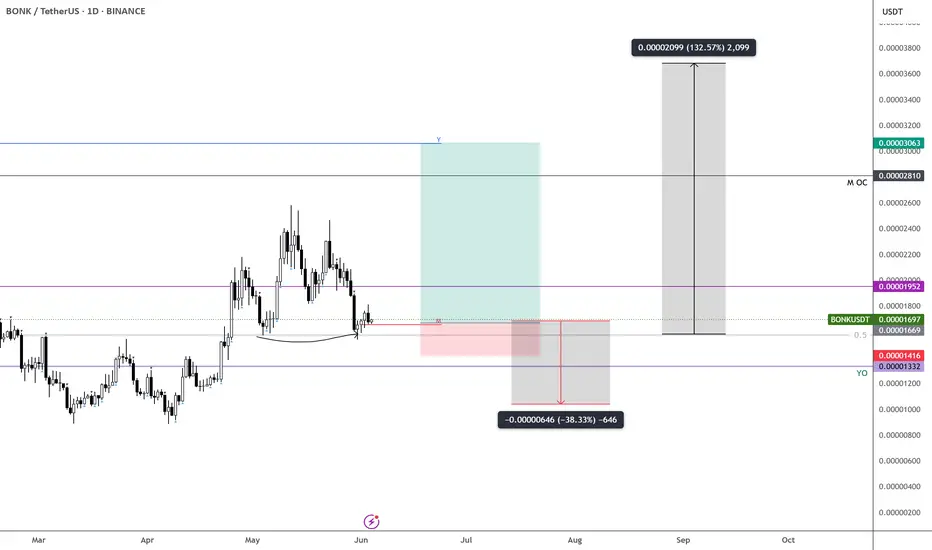
BONK – Long Here, Patience RequiredTime to go long on $BONK.
Hard not to bid at this level—the risk/reward is solid.
Still expecting some range-bound price action before the real move kicks in, so patience is key here.
First target: the yearly open—nearly a 2x from current levels. BINANCE:BONKUSDT
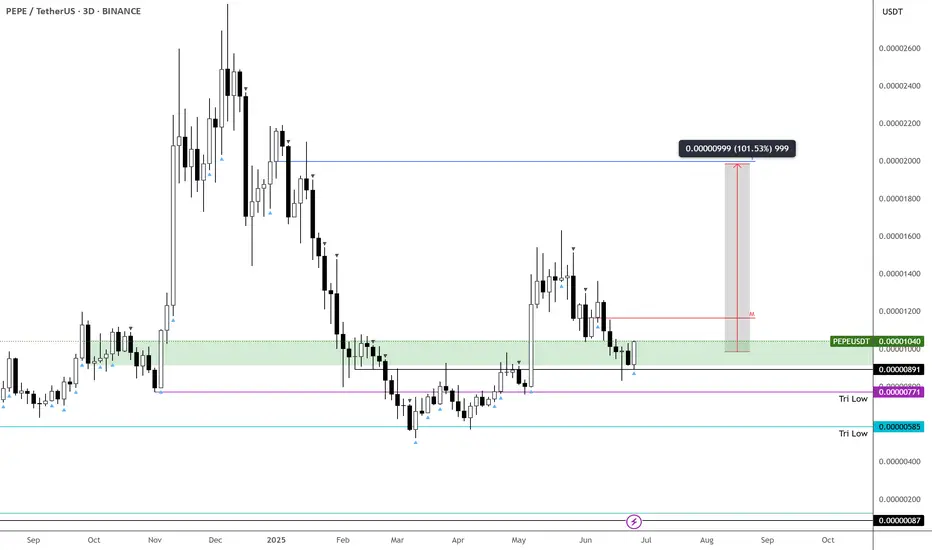
PEPE – Strongest Setup Among Top Meme Coins
Out of the higher-cap meme coins, I’m leaning more toward $PEPEUSDT.
From a price action perspective, it’s showing more strength than CRYPTOCAP:DOGE , CRYPTOCAP:SHIB , and $WIF. That’s not to say the others won’t pump—but personally, CRYPTOCAP:PEPE looks the most appealing here.
The green box is a solid area to build a position. It’s held the trimester lows well and continues to test them while responding bullishly.
Let’s see how it plays out over the next two months—but I like the odds of upside from here.
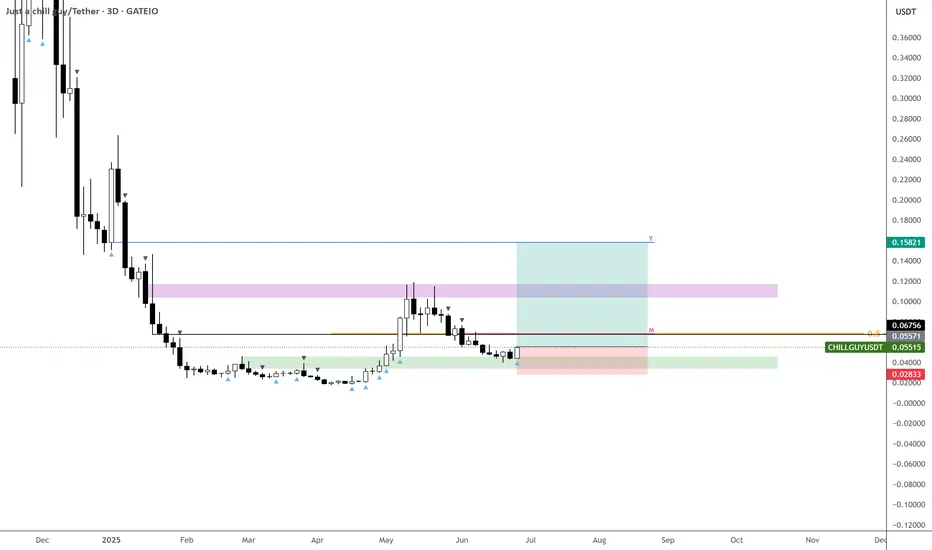
CHILLGUY – Ideal Entry After Retrace - 2x incoming!Best time to enter on $CHILLGUY—been waiting for a retrace, and we finally got it.
Anything near $0.055 is a solid buy if you missed the green zone entries.
The 3D chart is already signaling strong demand, and both downtrend signals from the local top have expired.
Expecting this one to trend faster than $BERT.
Targeting the Yearly Open for now—about a 2x from current levels. Will reassess after that.
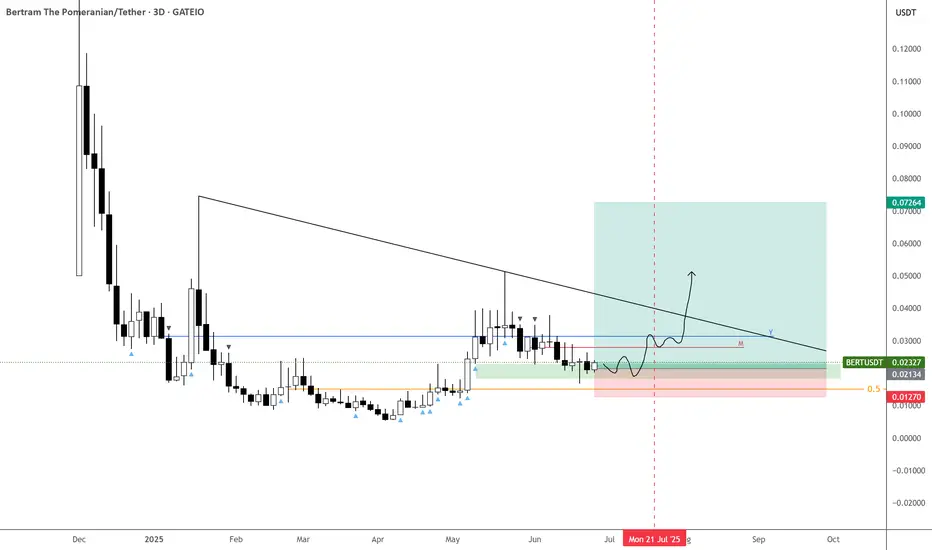
BERT – Positioning Early for Post-July Breakout - 10centsMEXC:BERTUSDT may take a few more weeks before it starts to surge.
Slowly building a position in this area—there’s a weaker downtrend signal off the local top that expires around July 21.
After that, I see a solid chance for trend continuation and potential new highs into late July or early August.
Yearly Open is the near-term target, but expecting a move toward 10c by year-end.
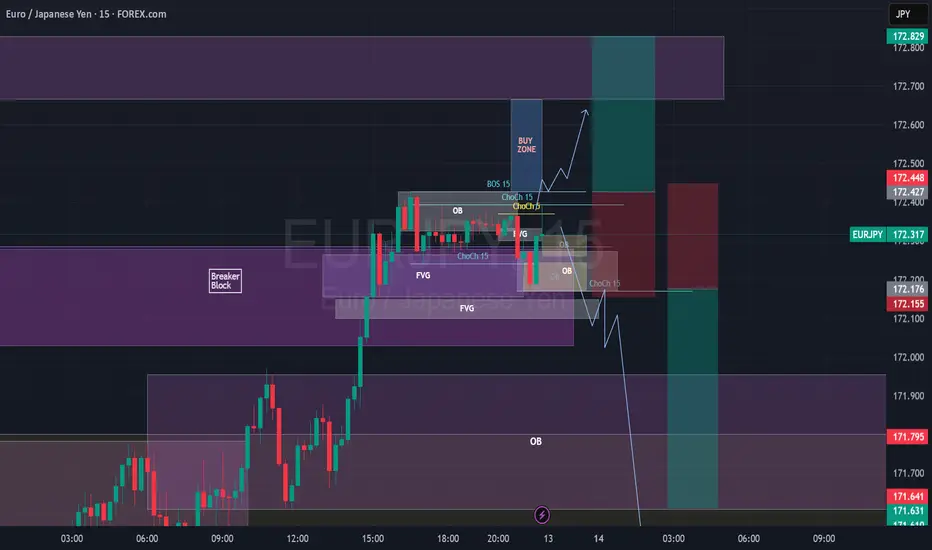
EURJPY Break of Structure, Retest and Fly5m - Monthly timeframes Bullish.
Price body candle closed and retested a 1H BB on 1H Timeframe.
Also retesting a 5M Bullish OB.
I want to wait for price to body candle close above the 15m BoS, create 3m/5m ChoCh, retest and look for Buys towards 172.665 (at the 1H OB or potentially 172.829, top of the 1H OB. SL under the 15m ChoCh.
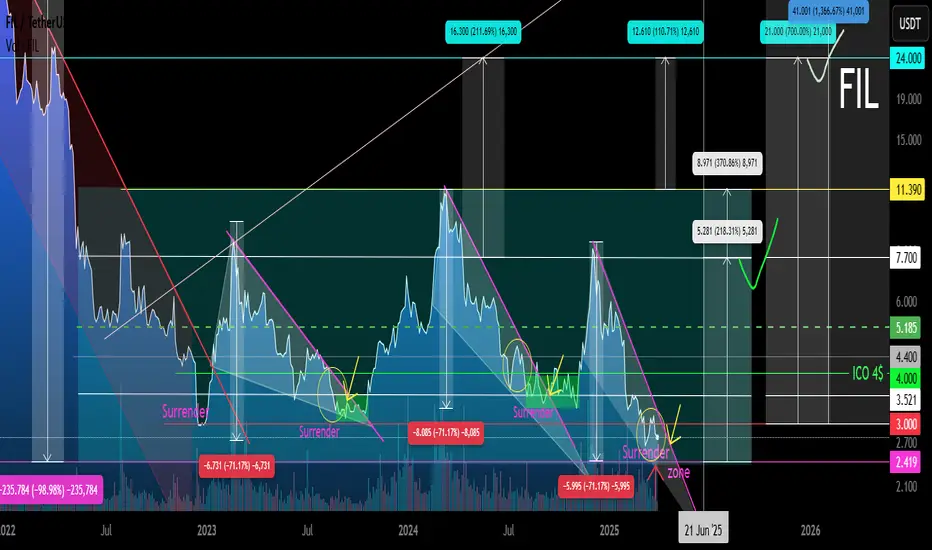
FIL Secondary trend. Channel zone. 31 03 2025Logarithm. Time frame 3 days (less is not needed).
Main trend. Time frame 1 week.
Published more than 2 years ago 22 01 2023
FIL/USD Main trend. From the maximum of $237 -99%
In the specified range, a horizontal channel with a large % step (exactly 370%) was formed earlier (2.590 - 7.157/10.7). There have already been 3 pumping waves in this channel. From the pumping highs in the main trend, the price fell by -98.98%
Secondary trend . This horizontal channel with a step of 370% and work with trend reversal formations.
Local trend , zone of formation of a descending wedge, zone of capitulation and trend reversal.
FIL/USDT Local trend. Wedge. Price clamping . 30 06 2024
Working now with the forming descending wedge and trend reversal in case of its breakthrough.
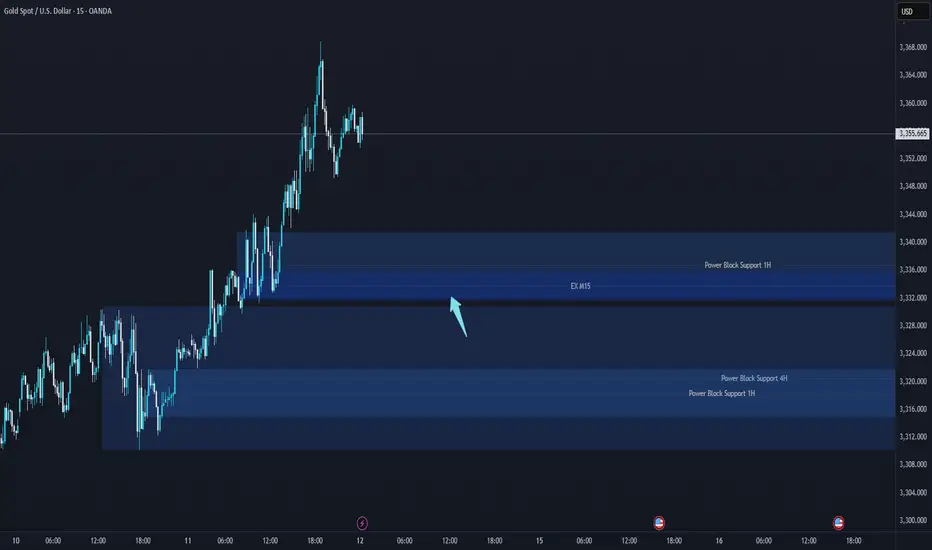
XAUUSD Support & Resistance Levels🚀 Here are some key zones I've identified on the 15m timeframe.
These zones are based on real-time data analysis performed by a custom software I personally developed.
The tool is designed to scan the market continuously and highlight potential areas of interest based on price action behavior and volume dynamics.
Your feedback is welcome!