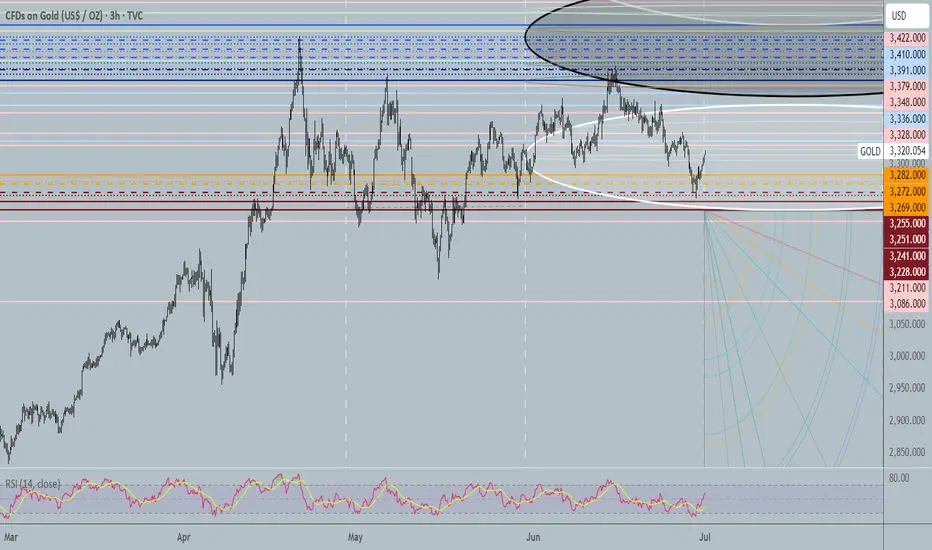
Key Levels for the Month 07/2025 ∷Gold∷🐍 Key Levels Overview for the Month 🐍
__________________________
Trend Base Lines
3227🐂🐂3392
3405🏛🏛3588
3516🐻🐻3810
__________________________
Resistances🔀
4049
3883
3822
3766
3743
3653
3587
3562
3535
3507
3461
Mids∷∷∷
3717
3585
3516
3430
3410
3391
3336
Supports🔀
3552
3422
3379
3348
3328
3282
3241
3228
3211
3086
Pivot Points
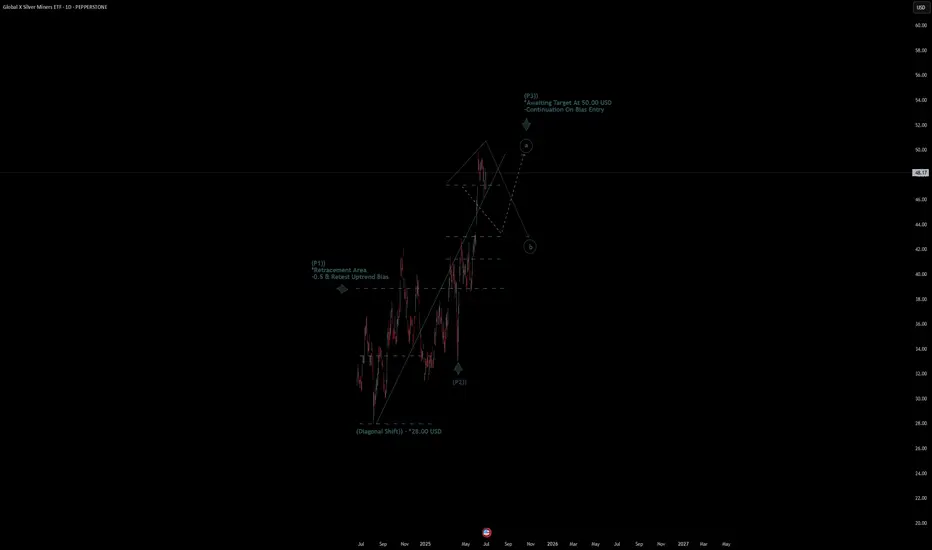
Global X SIlver ETF Quote | Chart & Forecast SummaryKey Indicators On Trade Set Up In General
1. Push Set Up
2. Range Set Up
3. Break & Retest Set Up
Notes On Session
# Global X SIlver ETF Quote
- Double Formation
* (Diagonal Shift)) - *28.00 USD | Completed Survey
* Awaiting Target At 50.00 USD
- Continuation On Bias Entry | Subdivision 1
- Triple Formation
* (P1)) / (P2)) & (P3)) | Subdivision 2
* (TP1) = a / Long Consecutive Range
* (TP2) = b / Short Consecutive Pullback | Subdivision 3
* Daily Time Frame | Trend Settings Condition
- (Hypothesis On Entry Bias)) | Regular Settings
- Position On A 1.5RR
* Stop Loss At 45.00 USD
* Entry At 48.00 USD
* Take Profit At 53.00 USD
* (Uptrend Argument)) & No Pattern Confirmation
* Ongoing Entry & (Neutral Area))
Active Sessions On Relevant Range & Elemented Probabilities;
European-Session(Upwards) - East Coast-Session(Downwards) - Asian-Session(Ranging)
Conclusion | Trade Plan Execution & Risk Management On Demand;
Overall Consensus | Buy
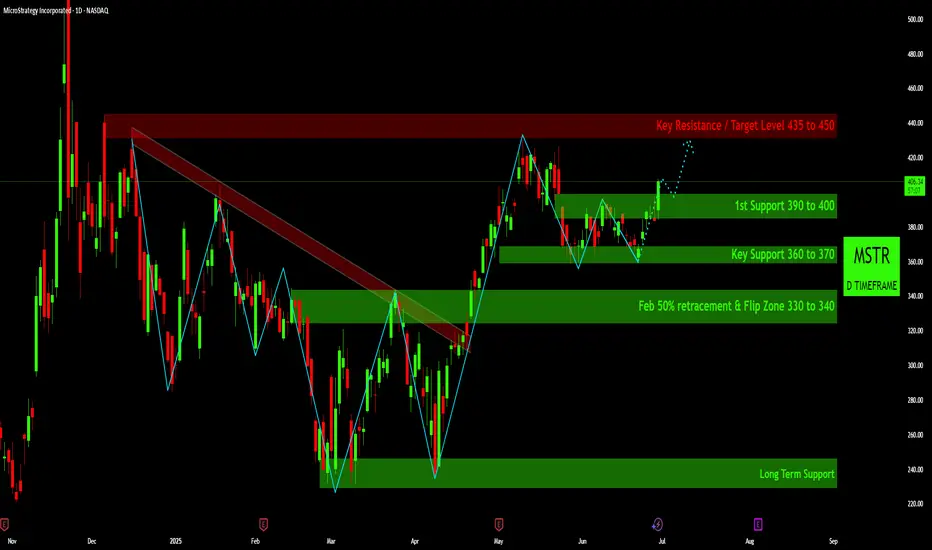
MSTR Daily Chart Analysis: Key Price LevelsThis analysis focuses on the daily chart of MicroStrategy (MSTR), highlighting significant price action, identified patterns, and predefined support and resistance levels.
Price Action Overview:
Starting from late 2024/early 2025, MSTR experienced a notable downtrend, characterized by a series of lower highs and lower lows, leading to a test of the "Strong Support" zone, illustrated by the grey shaded area around the 230-240 price level.
Following this decline, the chart illustrates a distinct "W" pattern formation, often interpreted as a potential bullish reversal signal. This pattern culminated in a decisive breakout above the overhead descending trendline (marked in red), indicating a shift in market structure from downtrend to a more bullish posture.
Post-breakout, the price saw a strong upward move into May. A subsequent pullback found significant support within the "Key Support 360 to 370" zone, which appears to have acted as a crucial pivot point, preventing further decline. More recently, the price has consolidated and is current
ly trading above the "1st Support 390 to 400" area.
Key Levels Identified:
Key Resistance / Target Level (435 to 450): The red shaded area at the top represents a significant overhead resistance zone. This level aligns with a previous peak and is identified as a potential target if the current upward momentum continues.
1st Support (390 to 400): This green shaded area serves as the immediate support level. The price has recently traded above this zone, suggesting it has transitioned into a new support area after potentially acting as resistance previously. Sustaining price action above this level would be a key observation.
Key Support (360 to 370): Located below the first support, this green zone has demonstrated its importance in recent price action, coinciding with the lows seen in June, where buyers stepped in.
Feb 50% Retracement & Flip Zone (330 to 340): This lower green shaded area represents a significant structural level, identified as a potential 50% Fibonacci retracement level from a previous move and a historical "flip zone" where price action shifted between support and resistance.
Strong Support (approx. 230-240): The grey shaded box at the bottom indicates a strong historical support level, representing the lowest point observed within this timeframe, acting as a critical long-term floor.
Current Observations:
The current price of 405.09 indicates MSTR is trading above its immediate "1st Support 390 to 400" zone. The dotted blue line on the chart illustrates a hypothetical continuation of the current upward momentum, projecting a potential move towards the "Key Resistance / Target Level 435 to 450."
Disclaimer:
The information provided in this chart is for educational and informational purposes only and should not be considered as investment advice. Trading and investing involve substantial risk and are not suitable for every investor. You should carefully consider your financial situation and consult with a financial advisor before making any investment decisions. The creator of this chart does not guarantee any specific outcome or profit and is not responsible for any losses incurred as a result of using this information. Past performance is not indicative of future results. Use this information at your own risk. This chart has been created for my own improvement in Trading and Investment Analysis. Please do your own analysis before any investments.
BTCUSDT:Sharing of the Latest Trading StrategyAll the trading signals last week have resulted in profits!!! Check it!!!👉👉👉
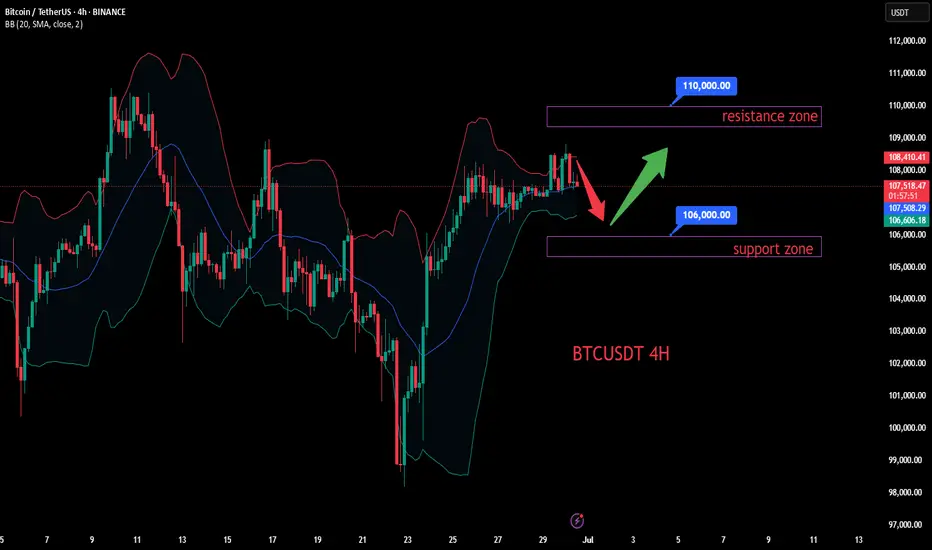
Bitcoin Technical Analysis (4-Hour Chart):
Price remains within an ascending channel. The MACD above the zero line with expanding red histograms indicates bullish dominance. After firmly breaking above the key resistance at $105,000, price is testing $110,000.
Caution: The RSI near 70 has entered overbought territory, increasing short-term pullback risks.
Support levels: $106,000 and $105,000.
Trading Recommendation for Aggressive Traders
Consider light long positions near $106,000 on pullbacks, with stop-loss set below $105,000.
Trading Strategy:
buy@105000-106000
TP:108000-110000
USOIL:Sharing of the Latest Trading StrategyAll the trading signals last week have resulted in profits!!! Check it!!!👉👉👉
Fundamental Analysis:
The ceasefire agreement between Israel and Iran has eased tensions in the Middle East, the primary factor behind the recent decline in oil prices. Meanwhile, market rumors suggest the U.S. may ease sanctions on Iran, which—if realized—would raise expectations of increased crude supply and further pressure oil prices.
Additionally, OPEC+ plans to continue increasing production by 411,000 barrels per day in July, with supply growth expectations exerting long-term downward pressure on oil.
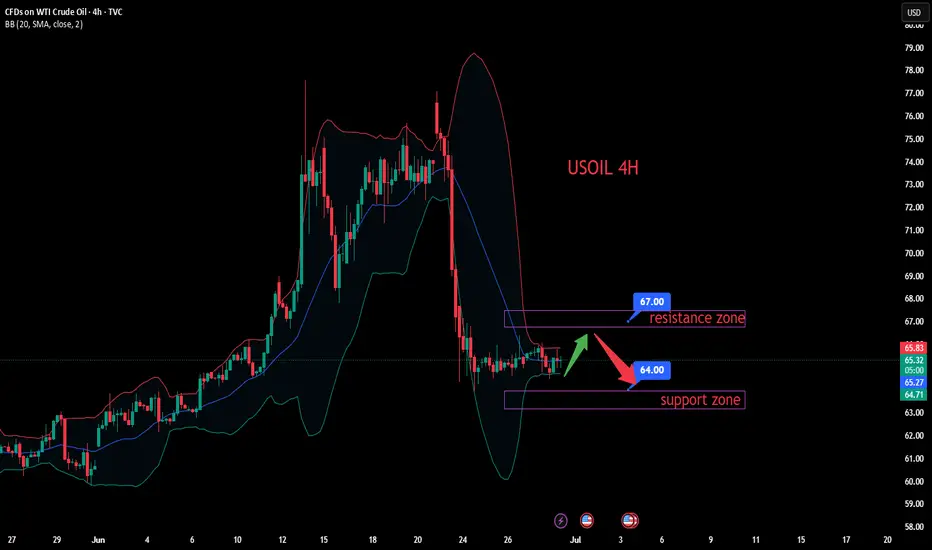
Technical Analysis (4-Hour Chart):
USOIL prices have pulled back from highs and currently hover near $65.20, approaching the S2 pivot point at around $64.69 and the 4-hour 200-period moving average. The prior appearance of a long candlestick may signal short-term support.
Notwithstanding, the current market remains in a bearish trend, so the strategy prioritizes buying on rebounds.
Trading Strategy:
Sell@67-66
TP:65-64
XAUUSD:Sharing of the Latest Trading StrategyAll the trading signals this week have resulted in profits!!! Check it!!!👉👉👉
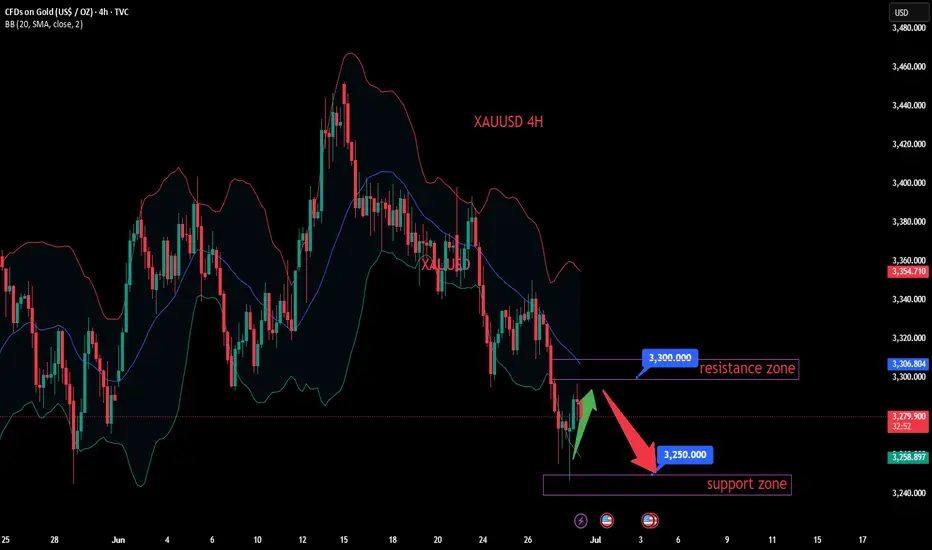
Early Session Dynamics:
Gold rebounded in today’s early trading after finding support at the prior low of 3245, aligning with our weekly forecast. The intraday strategy prioritizes a low-level rebound correction, with short positions to be initiated at resistance levels.
Key Technical Levels:
Resistance: 3295–3308
Support: 3250–3240
4-Hour Chart Perspective:
The market remains weak with high volatility. The double-bottom effect at 3245 is unconfirmed, and no bottoming pattern has emerged. Thus, the week’s initial outlook is for a range-bound oscillation between 3308 and 3240:
A rebound opportunity exists as long as 3240 holds.
A break above 3308 could trigger upward momentum.
Intraday Trading Strategy:
Lacking follow-through in the European session, the short-term trend is viewed as range-bound
Sell@3305-3295
TP:3285-3250
buy@3250-3260
TP:3285-3300
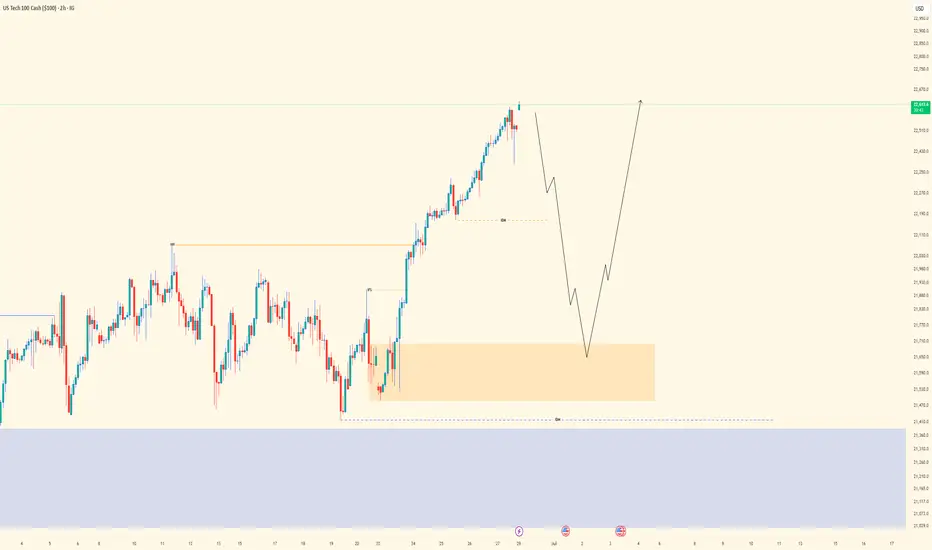
NASDAQ| - Continuation Setup Fueled by Momentum📌 Pair: NAS100 (NASDAQ)
📈 Bias: Bullish
🕰 HTF View (4H):
Strong bullish momentum unfolding with structure showing clear intent to continue higher. No major signs of reversal—smart money appears to be driving price up.
🧭 MTF View (30M → 2H clarity):
Using the 2H for cleaner narrative. Waiting for a clean sweep of sell-side liquidity (SSL) into a refined OB to continue the move. 30M showing structural alignment with the bullish bias.
🎯 Entry Criteria:
LTF CHoCH → Liquidity sweep → OB mitigation
Confirm the shift and execute on the return.
🎯 Target: Structure highs above
🧠 Mindset Note:
Momentum is your ally—but don’t let speed replace structure. Follow your confirmation sequence, stay surgical, and let price do the work.
Bless Trading!
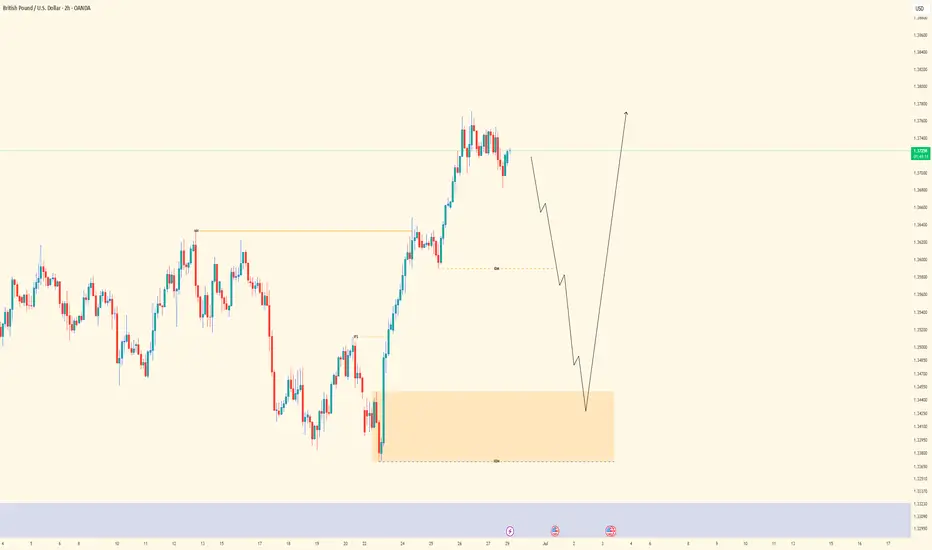
GBPUSD| - Riding the Bullish Wave with Precision📌 Pair: GBPUSD
📈 Bias: Bullish
🕰 HTF View (4H):
Major external structure (HH) broken to the upside — clear bullish intent from smart money. Strong momentum confirms continued interest in pushing price higher.
🧭 MTF View (30M → 2H clarity):
Refined bullish structure forming on 30M. Using the 2H to filter noise and spot deeper liquidity. Watching closely for a sell-side sweep into OB for cleaner, higher-probability LTF entries.
🎯 Entry Criteria:
CHoCH flip → Liquidity sweep → OB mitigation
Perfect sequence = greenlight for execution.
🎯 Target: Structure highs above
🧠 Mindset Note:
Sometimes the best entries come after everyone else gets taken out. Be the one who waits, confirms, then strikes with intention.
Bless Trading!
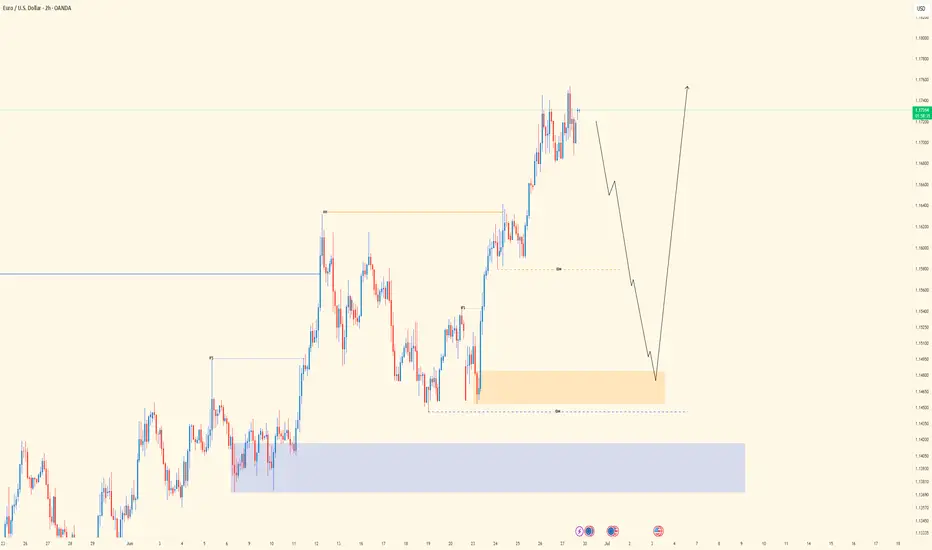
EURUSD| - Inducement Fueling Bullish Intent📌 Pair: EURUSD
📈 Bias: Bullish
🕰 HTF View (4H):
Clear bullish intent shown with a break above major external structure (higher high). Inducement remains intact—expecting that draw to price. Strong bullish momentum signals smart money positioning for more upside.
🧭 MTF Clarity (2H → 30M):
30M structure refined and leaning bullish, but using 2H for confirmation. Waiting on liquidity sweep into the OB zone for entry precision.
🎯 Entry Criteria:
LTF CHoCH → Liquidity Sweep → OB Mitigation
(Execution in that exact order for maximum confirmation)
🎯 Target: Structure highs above
🧠 Mindset Note:
Let the inducement play out—don’t rush it. This is where patience and clarity separate a sniper from a scalper. One clean entry > 10 reactive trades.
Bless Trading!
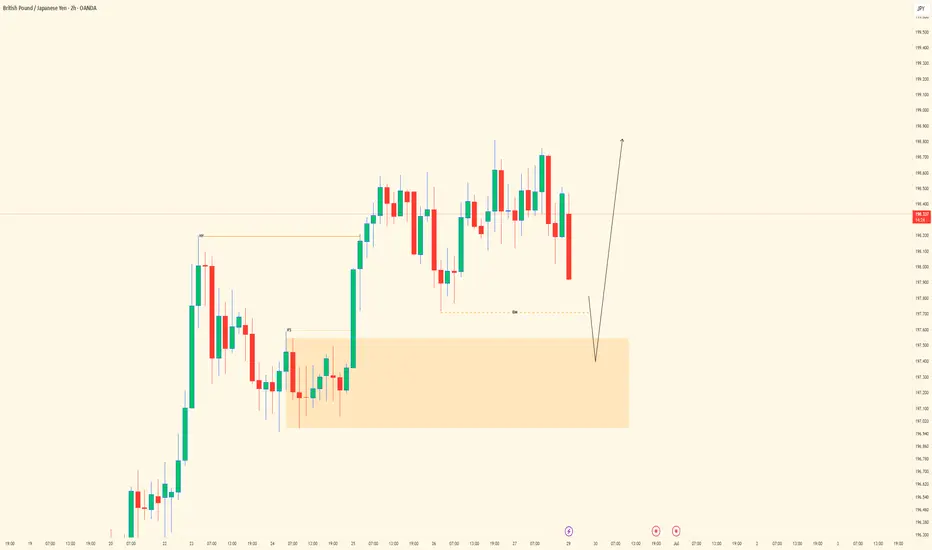
GBPJPY| - Bullish Play with Eyes on Deeper Liquidity📌 Pair: GBPJPY
📈 Bias: Bullish
🕰 HTF View (4H):
Major external structure has been broken to the upside, showing clear bullish intent. Price hasn’t aggressively swept sell-side liquidity yet, so we stay aware of the possibility—but structure favors a continuation north.
🧭 LTF View (30M):
Refined bullish structure forming. Waiting for liquidity sweep into the 30M OB for mitigation and signs of lower timeframe shift.
🎯 Entry Criteria:
After liquidity sweep → LTF CHoCH → Return into OB
Entry off optimal zone (refined precision based on PA)
🎯 Target: Near recent structure highs
🧠 Mindset Note:
Let price come to you. Don’t chase—anticipate. We’re playing the long game through structure and flow, not emotion.
Bless Trading!
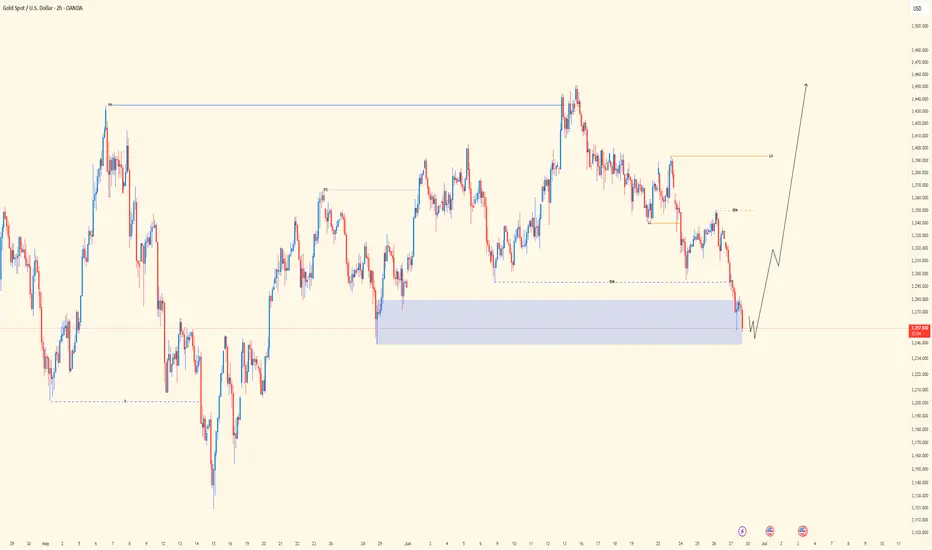
XAUUSD| - liquidity Driven Buy Setup📌 Pair: XAUUSD
📈 Bias: Bullish
🕰 HTF View (4H):
Last week’s price action formed a bullish continuation structure. Internal major high taken, sweeping liquidity—confirmation of smart money interest. Expecting continuation to upside objectives.
🧭 LTF View (30M):
Waiting for clean major LH break following the sell-side liquidity sweep. Entry zones will be refined once OB mitigation confirms buyer interest.
🎯 Entry Zone:
After SSL sweep + OB tap
🎯 Target: Recent highs and continuation beyond
🧠 Mindset Note:
Trusting the flow from higher-timeframe intention down to precision entries. Patience here pays—let the structure confirm before pressing the trigger.
Bless Trading!
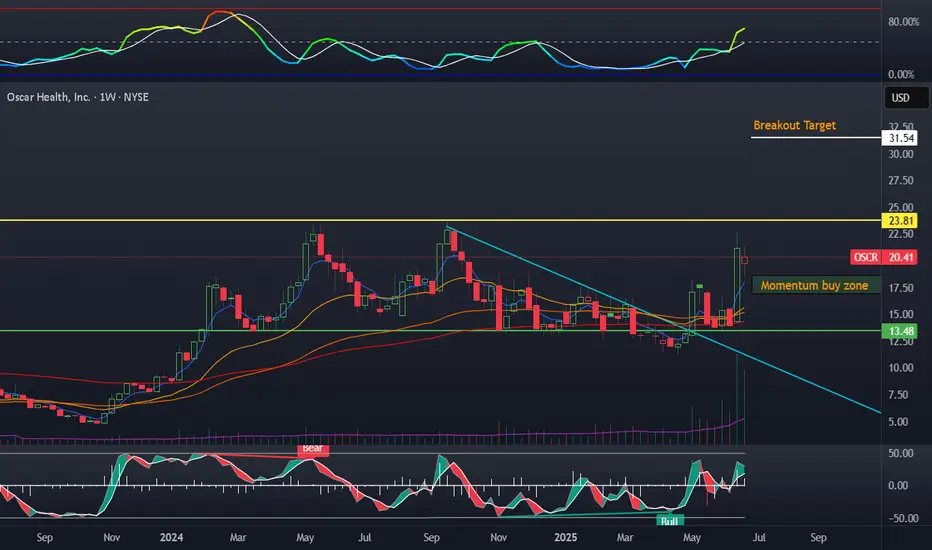
OSCR played out, where to DCA?OSCR played out nicely with a huge pop off price action. I was able to sell my leaps, and have already realized a few weeks of unassigned covered-calls. During the bounces near the bottom zone I was adding every few days. Where do I plan on averaging up? Around 17.5$ if we get there. I will also sell CSP within this zone.
Oscar like hims challenges the big legacy model of healthcare. The 24$ zone will continue to be an area of huge resistance. This is the highest volume the stock has ever had, a good sign.
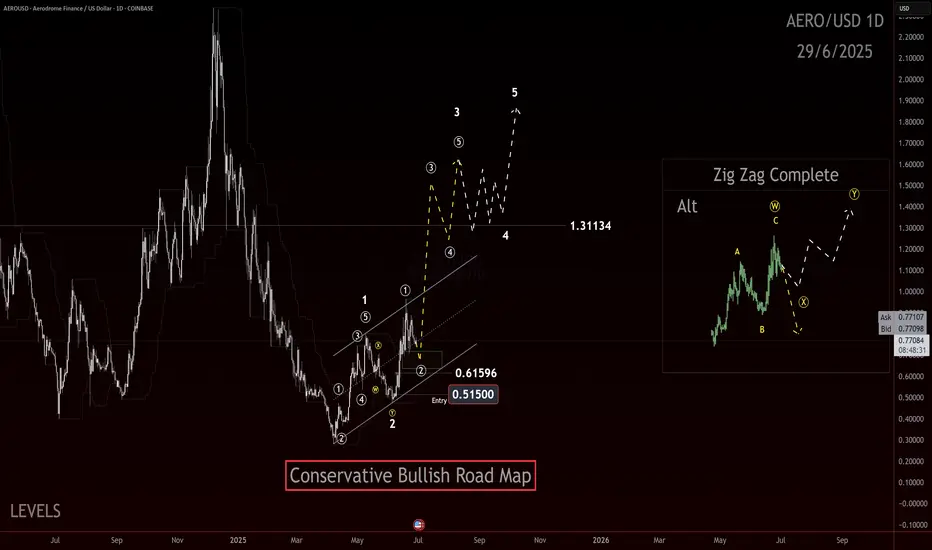
AERO, break down or the sound barrier!?If you find this information inspiring/helpful, please consider a boost and follow! Any questions or comments, please leave a comment!
AERO started by showing the kind of impulsive structure that could lead to a much larger advance. The internal retracement off the low was deep enough to flush weak hands but shallow enough to retain the broader bullish context.
The structure looks like a completed wave 2 correction: a double zigzag down into that .51-.61 pocket, finishing with an impulsive pop off the lows. That initial thrust is exactly the type of reaction you want to see if this is the early stages of a wave 3 or C advance.
What’s next? Ideally, price continues to respect the 0.615 level and we see price return back to the channel and then breaks above it with momentum, signaling the start of the next leg up. A clean swift move above .965 would help confirm that bulls are in control and we’re not dealing with an extended corrective mess.
Upside targets are layered: 1.31 is the first zone to watch—an area of prior structural reaction. Beyond that, the move has potential to extend above 1.80+ in a classic wave 5 push, provided we continue to see impulsive follow through.
Bias is bullish while price holds above .61 and continues to print higher lows. Any significant break back into that .51-.61 zone without reclaim would invalidate this setup and shift focus back to low prices.
Trade safe, trade clarity!
CRV ANALYSIS (1D)The smaller structure of CRV is bearish. It is expected to reject downward from the red zone, with our rebuy zone being the green area.
Given that the internal structure is bearish, it is ultimately expected to reach the green zone.
Closing a daily candle below the invalidation level will invalidate this analysis.
For risk management, please don't forget stop loss and capital management
When we reach the first target, save some profit and then change the stop to entry
Comment if you have any questions
Thank You
TON New Update (1D)This analysis is an update of the analysis you see in the "Related publications" section
Since we started publishing a series of bearish analyses on TON, the coin has experienced a significant drop | despite the ongoing growth of the Telegram app and its expanding user base.
Before reaching the support zone mentioned in our previous analysis, a strong intermediate demand zone is visible along the way, located just below a notable liquidity pool. A solid bullish reaction is expected from this identified demand area.
Targets are clearly marked on the chart.
A daily candle close below the invalidation level will invalidate this analysis.
For risk management, please don't forget stop loss and capital management
When we reach the first target, save some profit and then change the stop to entry
Comment if you have any questions
Thank You

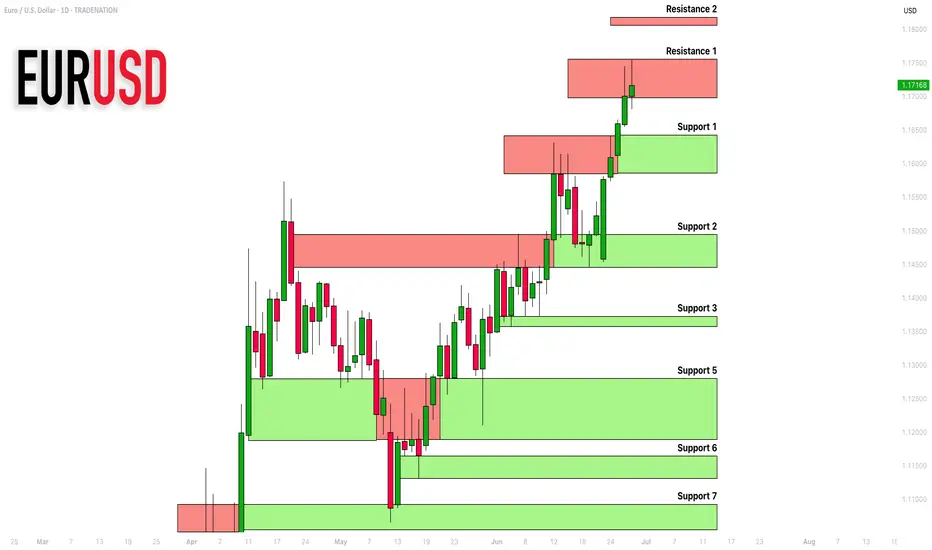
EURUSD: Support & Resistance Analysis for Next Week 🇪🇺🇺🇸
Here is my latest structure analysis
and important supports & resistances for EURUSD for next week.
Consider these structures for pullback/breakout trading.
❤️Please, support my work with like, thank you!❤️
I am part of Trade Nation's Influencer program and receive a monthly fee for using their TradingView charts in my analysis.
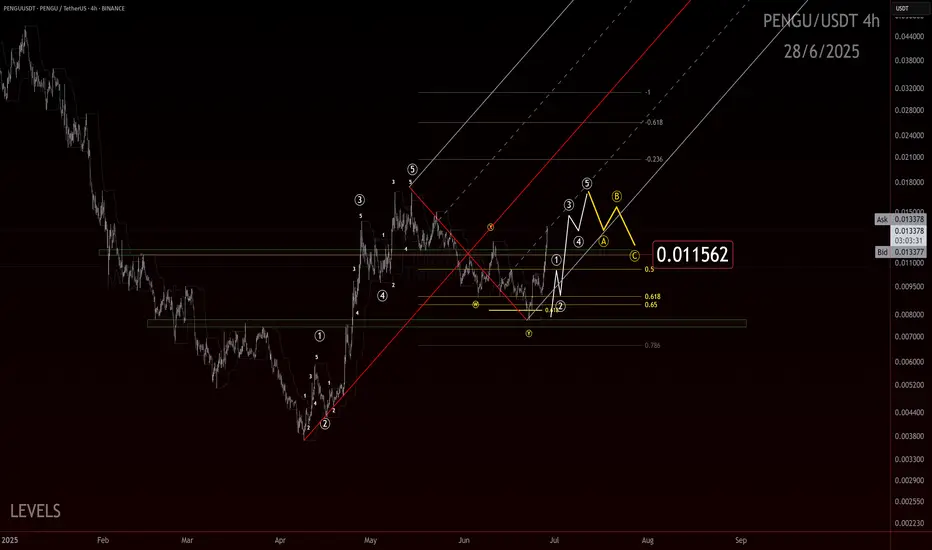
Penguins Can’t Fly, But This Chart Might If you find this information inspiring/helpful, please consider a boost and follow! Any questions or comments, please leave a comment!
The move off the low looks like a clean, completed impulse wave sharp, decisive, and showing solid structure. After that, we had a double ZZ retracement. While it was a bit deeper than the textbook ideal, it still fits perfectly within the normal range you’d expect for a healthy correction. Now, we’re seeing another smaller-degree impulse forming from the .007 pivot, suggesting that the market is gaining momentum again.
Here’s what we’re watching closely:
The secondary impulse off .007 continues to build structure.
We want to see a pullback after impulse completion that ideally holds above the .011 region, showing the market respects previous support and AOIs.
The structure of this potential pullback needs to be corrective rather than impulsive to confirm bullish continuation.
A clean move above prior swing highs would confirm that the larger wave 3 or C is underway.
Overall, this chart is ticking the boxes for a potential larger upside push if the market respects key levels and continues to print impulsive structure higher.
Trade Safe!
Trade Clarity!
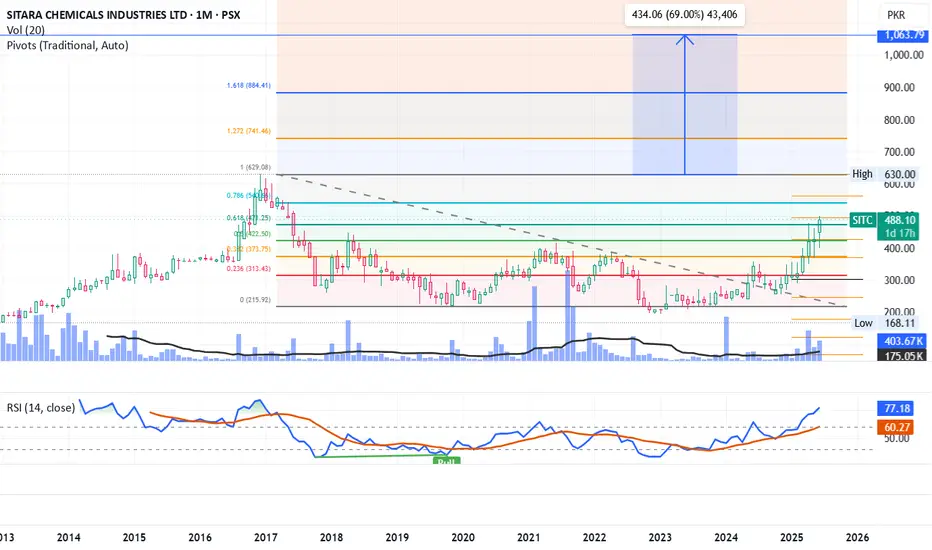
SITC Long Trade - Breakout almost confirmedSITC has given a breakout from Fib 0.618 of previous all-time high level on monthly time frame which will be confirmed on monthly closing.
Next targets are 540 (Fib 0.786) and then previous all time high 630.
Crossing it will open up gates to 1,000+
RSI is in bullish zone. Volumes of last two days confirm the breakout as well.
Its my personal analysis, not a buy / sell call.
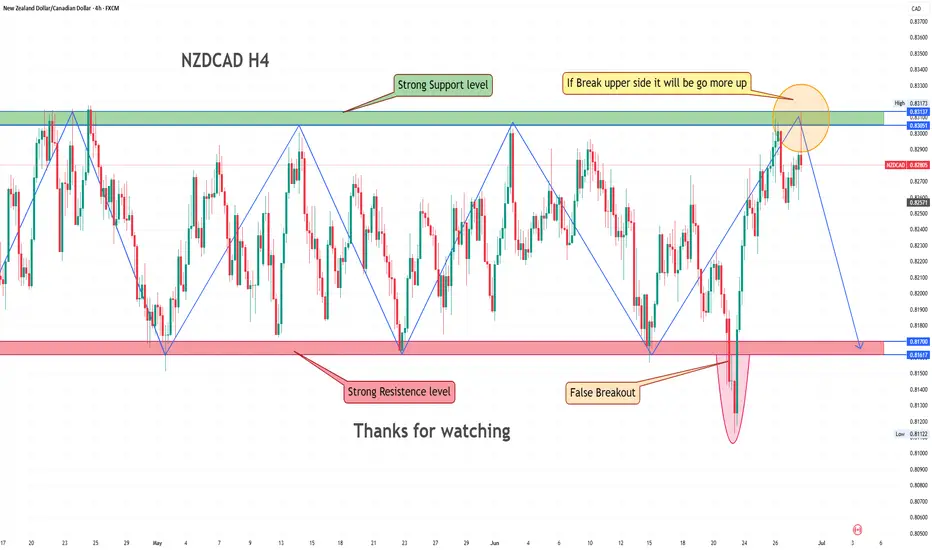
This currency is likely to go down.It is moving within a very strong support resistance zone so we can expect it to sell again.
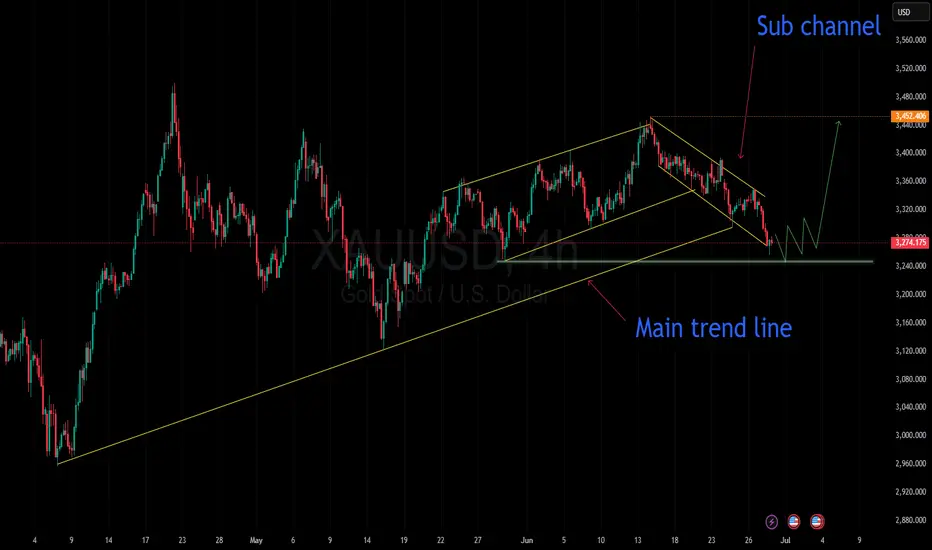
Gold is coiling for a breakout... All eyes on the next move!📉 Gold is currently moving within a minor descending channel.
In yesterday’s analysis, I pointed out the potential for a drop. Now, after a period of range-bound movement, I expect a breakout from this channel and a return to the main trend.
🎯 The first target on a reversal would be the top of the minor channel.
Keep a close eye on price action here — this zone could be key for the next move
OANDA:XAUUSD
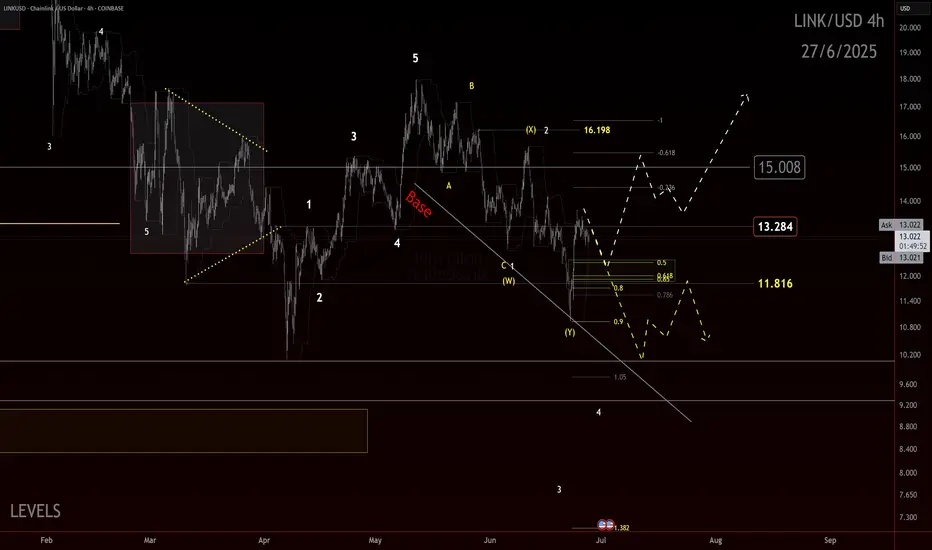
Final $LINK in the corrective chain?If you find this information inspiring/helpful, please consider a boost and follow! Any questions or comments, please leave a comment!
LINK could be finishing a double zigzag correction. Recent reaction at the channel’s most likely target area shows promise. Watching for an internal retrace that holds above key support.
Key Levels:
11.81: Ideal retrace floor
11.00: Break kills impulse idea
13.25: First upside flip needed
15.00: Big level to break for bulls
Bulls have been tricked before with possible impulse starts. This one has the right look and confluence, but caution is warranted. Ideally, we get consolidation and push above 13.25 to build confidence in further upside.
As long as price holds above 11.81 and builds higher lows, potential remains for an impulsive move up. Break below 11 and bias flips back to bearish continuation.
Trade Safe!
Trade Clarity!
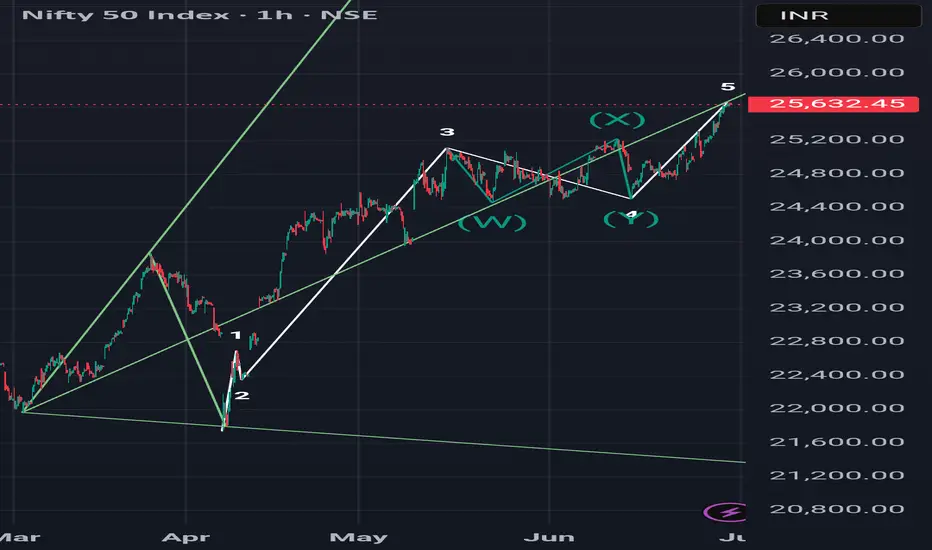
One of the reason, Why I m saying 5th wave done?Here you can see the pitchfork tool applied, as u can see that Nifty has touched this pitchforks median line from below and taking a resistance from it. This is the final 5th wave resistance. For further more elaboration, here are two ways I applied this tool:
1. In this particular snapshot, I touched 3rd pivot of this tool on the 7th April 2nd lowest pivot on hourly TF.
2. And yesterday prediction was based on this same tool but the 3rd pivot of the tool was on 7 April lowest pivot means on 21742.
Thats why there is a slight difference between these two median lines from two different ways of applying.
As u can see nifty has taken support on this line multiple times and forming a wavy structure around it
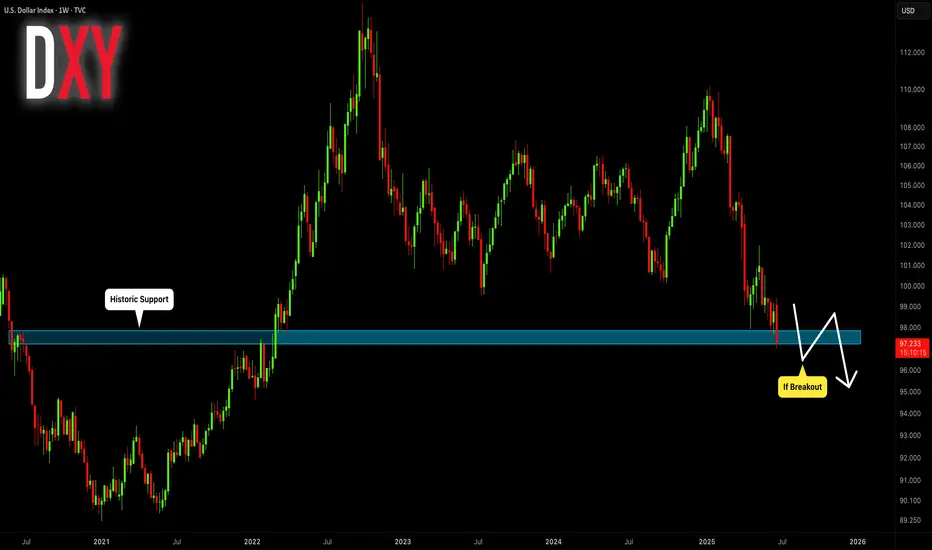
DOLLAR INDEX (DXY): Critical Moment
With an unprecedented pace of weakness of US Dollar,
DXY Index is now testing a historic weekly support cluster.
If the market breaks it today and closes below that, it will
open a potential for much more depreciation.
Next historic support will be 95.5 and a downtrend will continue.
Today's US fundamentals can be a trigger.
Please, support my work with like, thank you!