Advance technical analysis AUX USD ✅ Advanced Technical Analysis – XAU/USD (Gold) – 1H Timeframe
🧩 Chart Overview:
Timeframe: 1 Hour (H1)
Current Price: 3,333.675
Recent High: 3,451.525
Recent Low: 3,293.500
Marked with BOS (Break of Structure), CHoCH (Change of Character), supply and demand zones.
---
🔍 Step-by-Step Technical Breakdown:
---
1️⃣ Market Structure (Price Action)
🔺 Bullish Phase:
From June 13 to June 22, price showed a series of H1 BOS, confirming bullish structure.
🔻 Shift to Bearish:
After June 22, we observe several H1 CHoCH and BOS to the downside.
This indicates a clear transition from bullish to bearish, or at least a corrective phase.
---
2️⃣ Supply & Demand Zones
🟢 Demand Zone:
Marked between 3,293.5 and ~3,310
Price dipped into this zone and showed a minor bullish reaction (lower wick = liquidity grab)
🔴 Supply Zones:
Resistance at 3,393.509 (minor)
Stronger supply between 3,440 and 3,451 (previous unbroken highs)
---
3️⃣ Fibonacci & Potential Reversal Targets
If demand holds and bullish confirmation appears:
TP1: 3,393
TP2: 3,440
TP3: 3,451.5
These levels align well with structure and historical resistance.
---
4️⃣ Candlestick Behavior
Recent candles show price tapping the demand zone with some rejection.
Look for bullish engulfing, pin bars, or momentum candles as confirmation.
---
5️⃣ Potential Long Setup (If Confirmed):
Element Value
Entry Zone 3,305 – 3,315
Stop Loss Below 3,293 (e.g., 3,285)
TP1 3,393
TP2 3,440
TP3 3,451
Risk–Reward Estimated 1:3 to 1:5
---
⚠️ Risks & Considerations:
If the 3,293 demand zone breaks, bearish structure may continue.
Liquidity grabs and false breakouts are possible – wait for solid confirmation.
Align your entries with higher timeframe signals (e.g., H4) for stronger confluence.
---
❗️Disclaimer:
> This analysis is provided for educational purposes only and does not constitute financial advice or a recommendation to buy or sell.
You are solely responsible for your own trading decisions.
Pivot Points

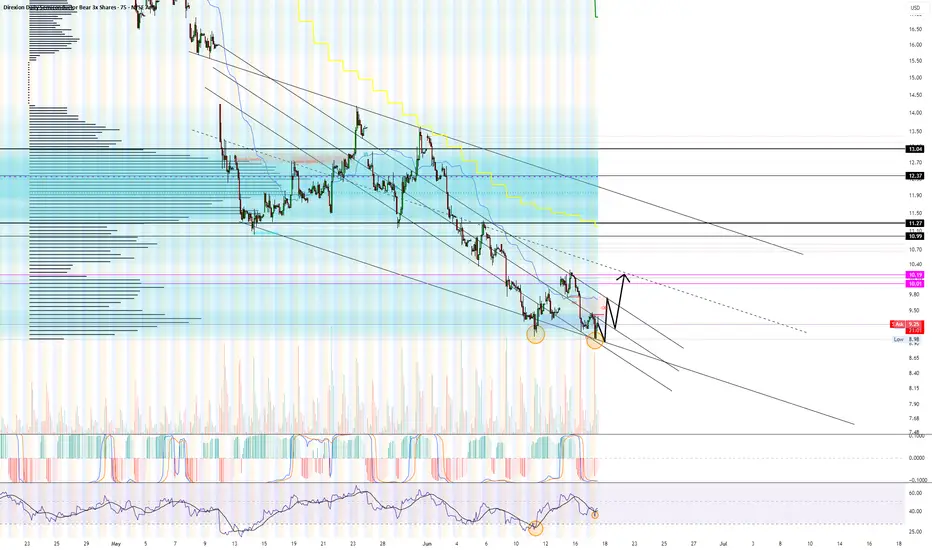
Divergence FormingThe descending channel pattern is always my favorite. Mixed with RSI, channels aligning with gaps and volatility being at $20, its a good chemical mix.
AMEX:SOXS to $10 can happen quickly but I think the move will be sharp and quick. Long term bearish signals forming to.
Lets see where it goes!
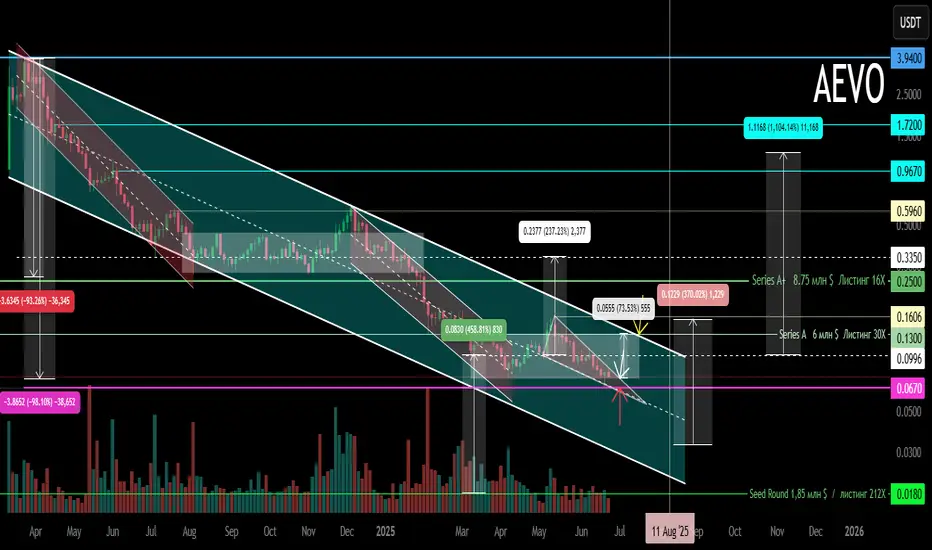
AEVO Main Trend DEX L2 Listing 212 X !) Decrease -98% 06 25Logarithm. Term 3 days.
Asset super hype in the past, listing with overly positive and aggressive marketing at 212X!
1️⃣Q1 2023 Private Seed $0.0185 / $1.85 million
2️⃣10 05 2023 Private Series A $0.13 / $6.01 million
3️⃣Q4 2023 Private Series A+ $0.25 / $8.75 million
4️⃣13 03 2024 Listing on the Binance exchange on the day of the secondary market trend reversal (I missed it, and it happens).
26 06 2025 now -98% decline after listing, which is 4.2X from the last prices of scammers, who gradually distributed, maintaining liquidity and the news background all this time their huge profit. Most of the coins are redistributed. You can think about collecting in this sideways, on a breakout of a local wedge (local trend), or on a breakout of a descending channel (reversal of the main trend).
Those who are far from trading can buy in equal parts (3 parts). From the position of the main trend and potential, the prices are now acceptable (you can buy the first part), so to speak (former "hype investors" are in wild horror).
Exit zones will be zones of previous consolidation, that is, those who previously bought on the hype will not be able to make a profit. In fact, it is always like this ... There are no “passengers”, then they will pump up well. As a rule, +800-1000% such assets of the previous excitement and such liquidity.
Local reversal zone.
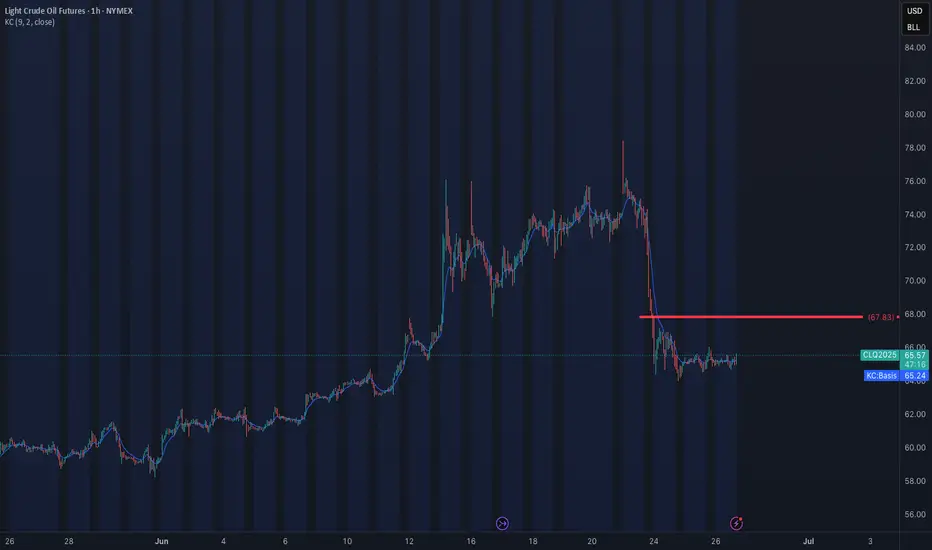
Geopolitical tensions is making oil fun to tradeFor the unexperienced traders, be very careful trading NYSE:CL , you can get caught anytime wether you are long or short right or wrong.
Nevertheless, if you follow my LIS, you can have a clear picture of where oil is heading to.
Right now, oil is set up as bearish but it can change in a matter of a bomb. Jokes aside, the LIS stands at 67.8. So below still bearish, above turn bullish.
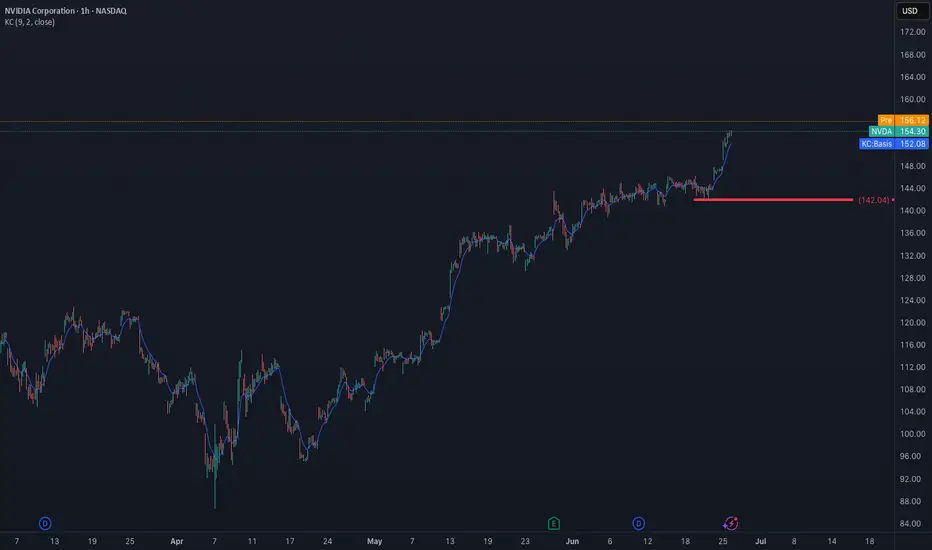
NVDA is still the leader making new ATHNASDAQ:NVDA is making new highs. When will it stop? A sign of weakness would be a break of my LIS at 142. It’s that simple, if you are long don’t panic sell early. Wait for a sign looking at my levels.
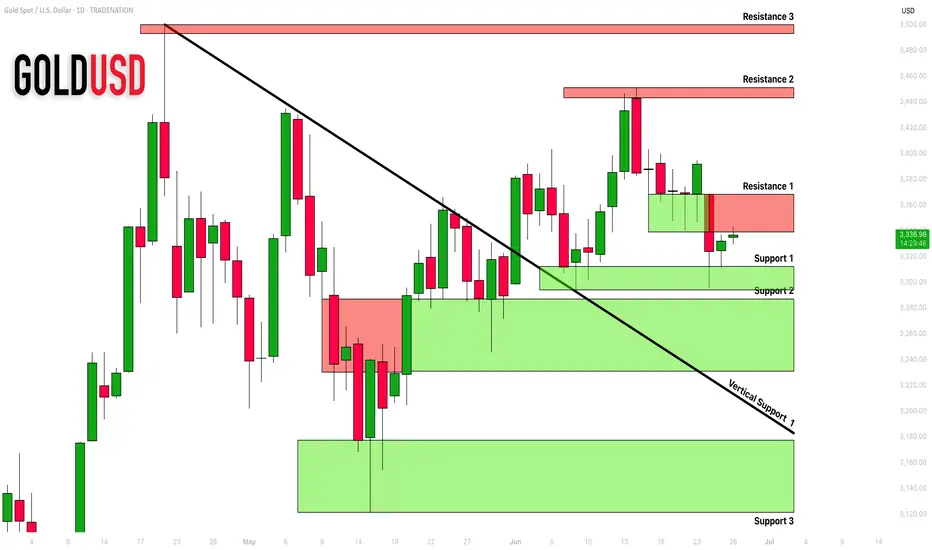
GOLD (XAUUSD): Updated Support & Resistance Analysis
Here is my latest support and resistance analysis for Gold.
Horizontal Structures
Support 1: 3294 - 3312 area
Support 2: 3231 - 3287 area
Support 3: 3121 - 3176 area
Resistance 1: 3338 - 3368 area
Resistance 2: 3441 - 3451 area
Resistance 3: 3493 - 3500 area
Vertical Structures
Vertical Support 1: Falling trend line
Consider these structures for pullback/breakout trading.
❤️Please, support my work with like, thank you!❤️
I am part of Trade Nation's Influencer program and receive a monthly fee for using their TradingView charts in my analysis.
XAUUSD BUYAll the supply and demand zone of our interest has been shown in the chart.
and we are currently on buy from our zone .

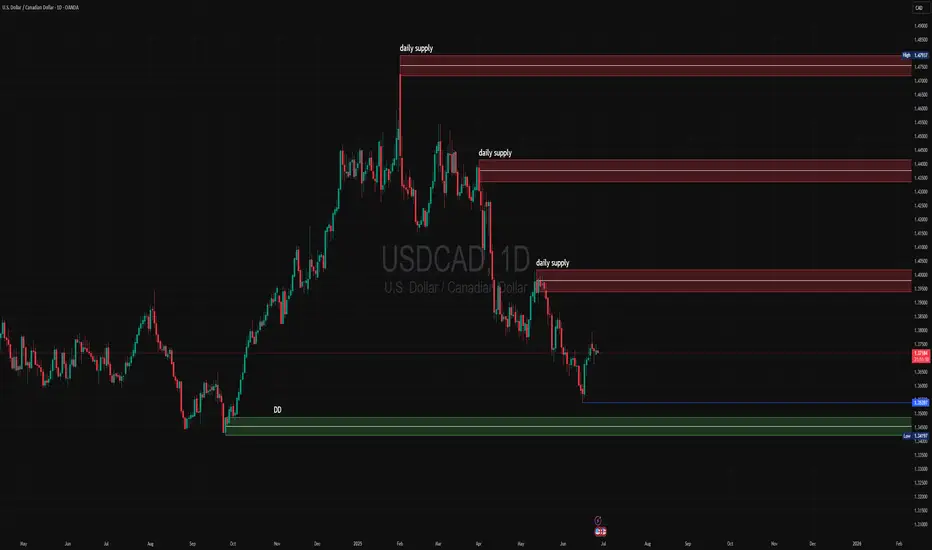
USDÉCAD Technical Analysis - Daily Time Frame 🔁 Market Structure:
The overall trend is bearish, with multiple Breaks of Structure (BOS) confirming sellers are in control.
Recently, price formed a Change of Character (CHoCH) at the bottom, which may indicate the beginning of a bullish correction or a temporary reversal.
The market is currently reacting from that low, showing signs of bullish pressure.
🟩 Demand Zone:
The green zone (around 1.3400 – 1.3460) marks a strong daily demand area.
This zone has shown previous bullish reactions and has not yet been fully tested in this leg.
It could serve as a high-probability long entry zone if price returns to it.
🟥 Supply Zones (Targets):
There are three red supply zones above, acting as potential take-profit levels for bulls or entry points for sellers:
TP1 (7%) – Around 1.3444
TP2 (14%) – Around 1.3790
TP3 (29%) – Around 1.4224
🎯 Trade Scenarios:
✅ Bullish Scenario (Swing Trade Toward Supply)
Item Details
Entry Zone 1.3400 – 1.3460 (daily demand zone)
Confirmation Bullish price action (e.g., engulfing candle, pin bar)
Stop Loss Below demand (e.g., under 1.3350)
Targets TP1: 1.3444 / TP2: 1.3790 / TP3: 1.4224
This setup offers a high risk-to-reward ratio if confirmed on lower timeframes.
🔴 Bearish Scenario (Continuation of Downtrend)
Item Details
Entry Zone From one of the supply areas (especially near 1.3790)
Confirmation Bearish candle (e.g., bearish engulfing, rejection wick)
Stop Loss Above the supply zone (e.g., 1.3850)
Target 1.3450 initially or lower if demand breaks
📌 Final Thoughts:
The market is currently in a correction phase.
The best long opportunity is from the demand zone around 1.3400 – 1.3460, with proper confirmation.
Targets are clearly marked based on supply zones.
Short positions should wait for confirmation near those supply levels.
⚠️ Disclaimer:
This is not financial advice or a recommendation to buy or sell.
It reflects only my personal view of the market based on the current chart structure.
Please do your own analysis and manage your risk accordingly before making any trading decisions OANDA:USDCAD
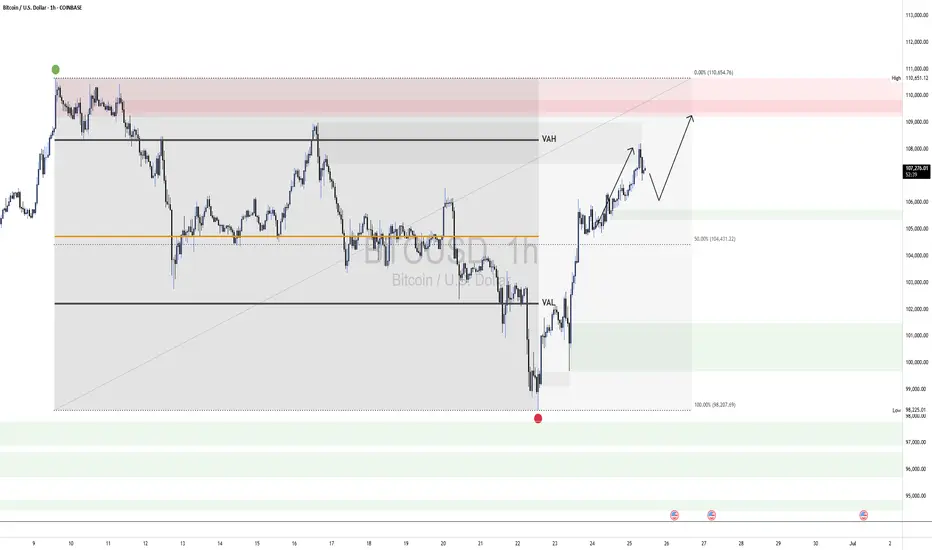
BTCUSDNow that BTCUSD has reached our previous target at 107,848, we are updating our forecast.
The market remains structurally bullish, with the next upside objective at 109,400.
Although we've seen a reaction from a short-term supply zone, a slight pullback or pause is possible. However, due to visible liquidity resting above, there's a strong likelihood that price will extend higher toward 109,400.
At that point, we will closely monitor price action for signs of exhaustion or reversal to evaluate potential short opportunities.
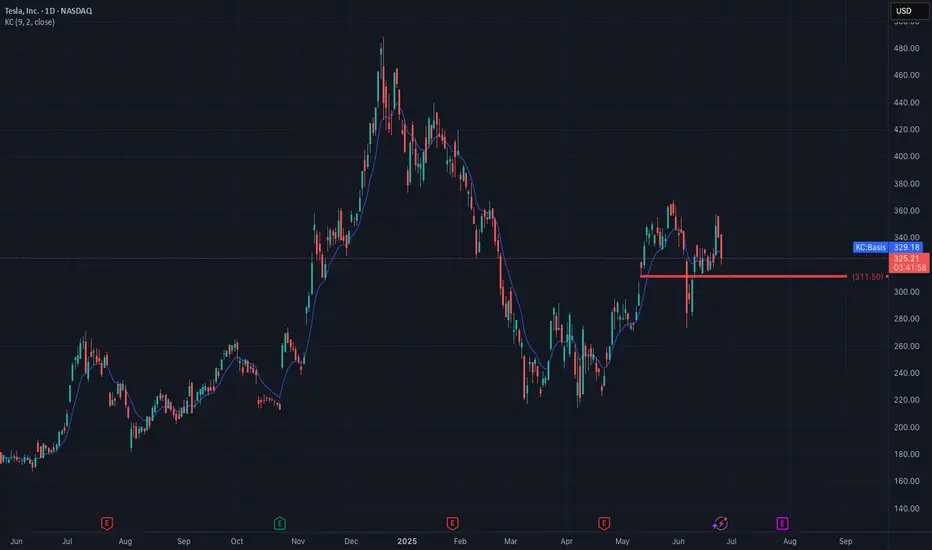
Will the Robotaxi euphoria continue to push TSLA higher?NASDAQ:TSLA pushing higher the last few days thanks to the start robotaxis. Will this rally continue? the answer is yes until the LIS gets broken.
LIS is at 311, any break below will give a retrace. If you are long, get out and get back in when the next LIS gets broken on the upside. This is efficient investing. Don't waste time doing HODL.
LIS is evolving over time, I will keep you updated on it.
This is really simple trading based on important levels. Keep following my post, so you can see it by yourself.
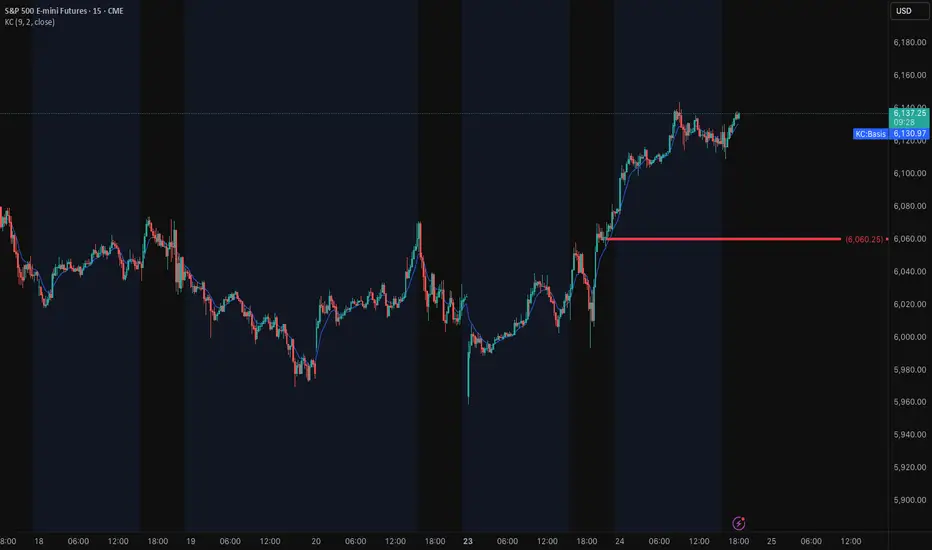
ES still bullish but a pullback awaitsES is still in a bullish setup on the 15min chart but a pull back is awaited at least to 6100 area. To see a change in trend to the downside, you need to see a break of my line in the sand at 6060 level.
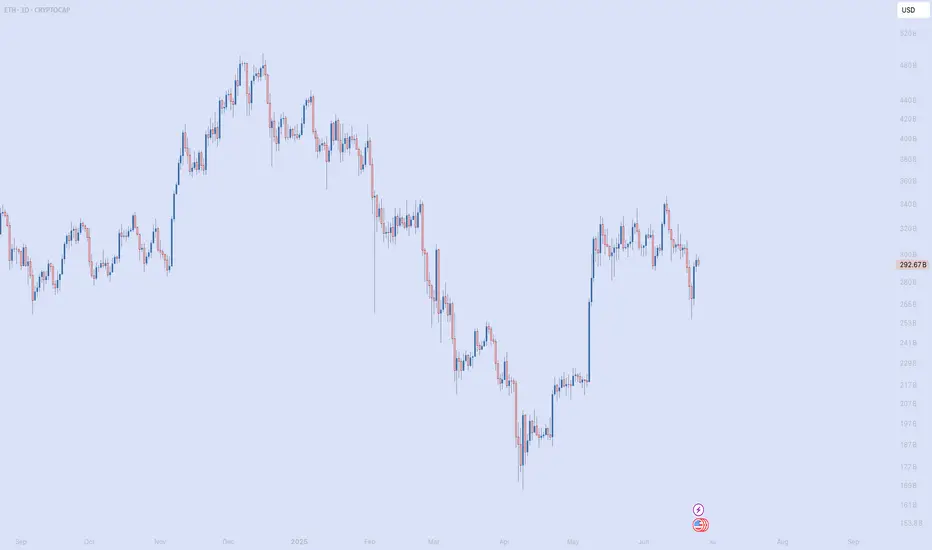
Decision Phase in ETHBTCI would like to offer an idea about ETHBTC. Although it showed a nice bottom formation with its last breakout move, I think it is at a very critical point with the horizontal movement and downward break that followed. If you look at the ETH chart ( ) , you can see that it corrected almost 60% of its sharp rise and gave a nice test to the red box and went up. It is currently trying to stay within its old range. ETHBTC, on the other hand, is making a downward move. It would not be wrong to say that it has evolved into an structure as if it made a downward retest, despite having made a similar move.
I have 3 plans for this process:
Plan 1: The price retesting the 0.026 levels after entering the old range and throwing it above this area with a slow and small pullback. I will consider the last downward move as manipulation and take a position accordingly.
Plan 2: Defining its last move as a retest to the range it broke down, continuing its decline and first coming back to the 0.019 levels. Maybe a decline to the green box zone below after the reaction there.
Plan 3: After making the rise in plan 1, testing the 0.021 levels for the last time by pulling back more and starting a rapid rise from there. Frankly, although it is a bit difficult, such a move seems good to me since seeing sharp movements and volume in the bottom formation will increase the opinion that the rate is the bottom.
This is the roadmap I will follow in general. I think these movements can be until the first week of July. I hope that the next 10 days will give a good idea of how we will spend the summer months. It should not move horizontally in these areas anymore and I don't think it will. I don't care about drawing both up and down and then saying "aha" and being right. If my goal is not to make money, being right is useless. If there is a movement that is suitable for one of the movements I draw, I want to take a position and turn it into reality.
Good day everyone.
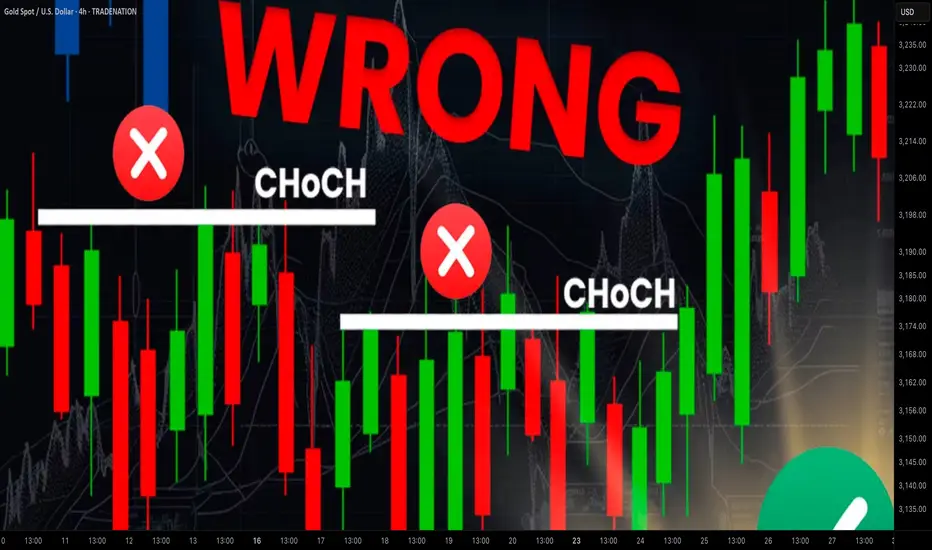
Learn Best Change of Character CHoCH Model in Trading with SMC
Most of the SMC traders get Change of Character CHoCH WRONG!
In this article, I will share with you Change of Character models that have a low accuracy and better to be avoided.
I will teach you the best CHoCH model for Forex Gold trading and show you how to identify it easily.
Let's start with the basic theory first and discuss what Change of Character signifies.
Change of Character in Bearish Trend
In a downtrend, Change of Character CHoCH is an important event that signifies a violation of a bearish trend.
CHoCH is confirmed when the price breaks and closes above the level of the last lower high.
Above, is a text book Change of Character model in a bearish trend.
For the newbie traders, such a price action provides a strong signal to buy while it fact it is NOT .
One crucial thing is missing in this model to confirm a bullish reversal.
According to basic trend analysis rules, we say that the market trend is bullish if the price forms a bullish impulse, retraces and sets a Higher Low HH , forms a new bullish impulse with a new Higher High HH.
Only then, we can say that the market is trading in up trend.
CHoCH model above confirms a bearish trend violation BUT it does not confirm a trend change.
Such a model may easily signify a deeper correction.
Look what happened with GBPNZD.
Though the price formed a confirmed bearish CHoCH, it was a false signal and just an extended correction.
That's a perfect bullish reversal model.
It combines CHoCH and conditions for a bullish trend.
Such a union is extremely accurate in predicting up movements.
Examine a price action on USDJPY.
Not only the price formed a confirmed CHoCH but also we see a start of a new bullish trend.
Change of Character in Bullish Trend
In an uptrend, Change of Character CHoCH is a significant event that signifies a violation of a bullish trend.
CHoCH is confirmed when the price breaks and closes below the level of the last higher low.
Above is a typical model of a bearish CHoCH.
For many traders, that is the signal to open short.
However, it is not that accurate and one important component is missing there.
According to basic price action rules, the market trend is bearish
if the price forms at least 2 bearish impulses with Lower Lows LL and a pullback between them with a Lower High LH.
Only when these 3 conditions are met, a bearish trend is confirmed .
Perfect bearish Change of Character model should include both CHoCH and a bearish trend price action. That will confirm a violation of a bullish trend and start of a new bearish trend.
EURCAD has a very strong potential to continue falling:
not only we see a valid bearish Change of Character but also
a start of a new bearish trend based on a price action.
Next time when you identify CHoCH on forex market, make sure that you check the preceding price action. It will help you to more accurate assess reversal probabilities and make a wiser trading decision.
❤️Please, support my work with like, thank you!❤️
I am part of Trade Nation's Influencer program and receive a monthly fee for using their TradingView charts in my analysis.
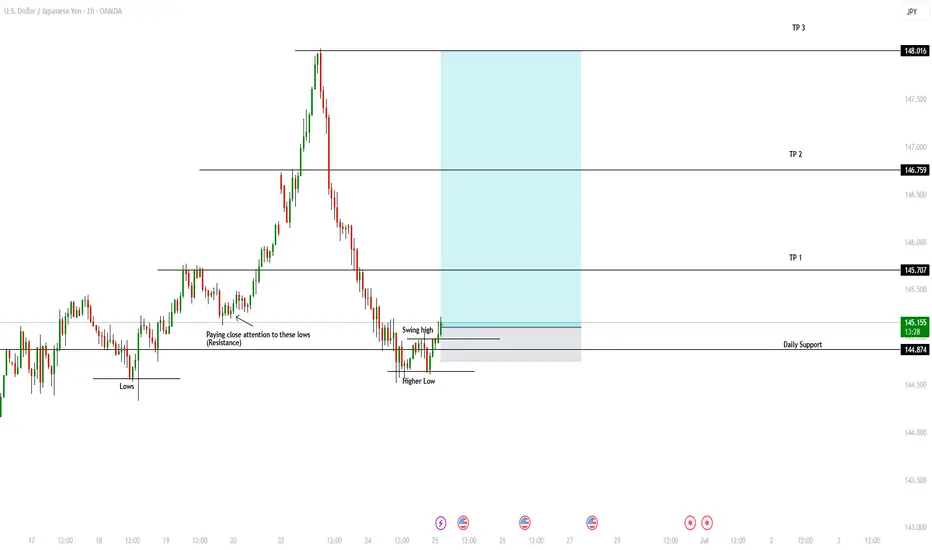
OANDA:USDJPY Buy SetupUSDJPY Buy Setup – Bullish Structure & Daily Rebound
USDJPY is showing signs of renewed bullish momentum after rejecting a significant daily low. Price action on the 1-hour timeframe has confirmed the formation of a higher low, followed by a clean break above a key daily support level—now turned support once again. This shift in market structure indicates a potential continuation of the uptrend, supported by higher highs and higher lows on the intraday chart.
Technical Highlights:
Strong rejection from a daily low zone
Bullish structure confirmed on the 1H timeframe
Price reclaiming a key support level and holding above it
Momentum suggests potential continuation toward higher targets
Trade Setup:
Entry: 145.110
Stop Loss: 144.754
Target Levels:
Take Profit 1: 145.709
Take Profit 2: 146.747
Take Profit 3: 148.014
This setup offers a favorable risk-to-reward ratio within a well-defined bullish context. Wait for a solid candle confirmation if not already entered, and always manage your risk according to your trading plan.
Drop your thoughts or questions in the comments, and if you found this valuable, hit boost and follow for more structured trade ideas. Wishing you precision and profits!
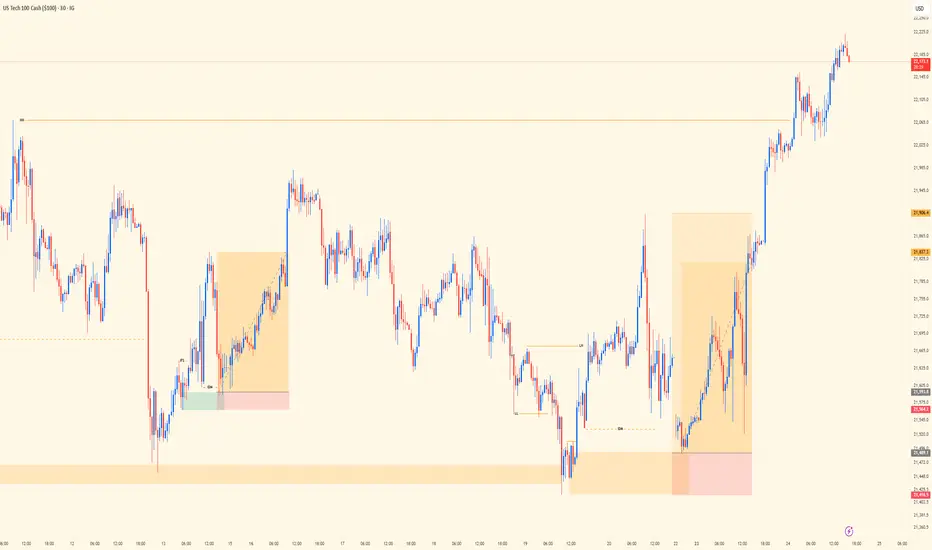
NASDAQ Midweek Review | Trend, Liquidity, PrecisionSingle-chart post today showing the execution trail behind two solid wins on NASDAQ.
Top-down bias was aligned — bulls clearly in control, so I stuck with trend direction. No need to fight momentum. As a trend trader, I don’t counter — that mindset shift alone is what keeps me consistent and clean with entries.
Chart shows the 30M view — where structure, liquidity, and timing came together. Both setups were built off elite structure reads. Liquidity played its part: manipulation, sweep, confirmation, and execution.
Bias: Bullish
HTF Alignment: Bullish trend continuation
Entry Frame: 30M precision
Key Insight: Liquidity isn’t noise — it’s narrative.
Mindset Note: Counter-trading is a shortcut to inconsistency. Stay with flow, respect structure.
Bless Trading!
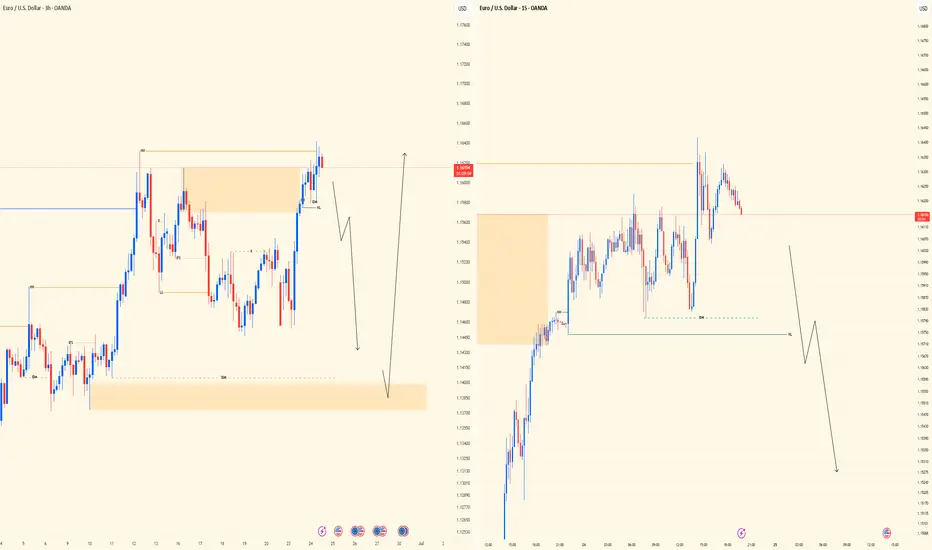
EURUSD Midweek Outlook | 3H - 15M Dual ViewLeft side chart shows the 3H Bird’s Eye structure — price swept the recent highs but failed to follow through, signaling external bull weakness. That shift in narrative tells me price may be prepping to drop, potentially targeting the SSL below before gathering fuel to attack major highs.
Right side zooms in on the 15M — I’m patiently watching for a clean lower high to break (CHoCH) followed by a pullback to confirm a sell entry. Until I get that proper LTF trigger, I stay on the sidelines. Execution always follows alignment.
Bias: Short
HTF Structure: 3H sweep of highs, showing weakness
LTF View: Waiting for 15M confirmation (break + retest)
Target: SSL below
Mindset Note: Trade what’s shown, not what’s felt. Stay sharp, stay patient.
Bless Trading!
Midweek XAUUSD Insight | Dual View SetupPair: XAUUSD
Bias: Bullish
HTF Overview (Left Panel – 3H): Price action has been moving within bullish structure, with a major higher low currently holding strong. This HL is the key pivot I’m watching for continuation.
Refinement Zone (Middle – 30M): We’ve tapped into a 30M OB and are now sitting in mitigation territory. No signs of reversal yet, but the setup is maturing.
Entry Technique (Right Panel – 15M View): Just waiting for that classic Smart Money confirmation — LTF CHoCH, liquidity sweep, then return into OB. Will refine down to 5M for precise entry if price plays out clean.
Entry Zone: Waiting on confirmation around the OB zone
Target Zones: Based on HTF structure continuation
🧠 Mindset Note: Setup is solid, but patience wins. Let the story unfold — we only strike with clarity and precision.
Bless Trading!

Biogen Inc Stock Quote | Chart & Forecast SummaryKey Indicators On Trade Set Up In General
1. Push Set Up
2. Range Set Up
3. Break & Retest Set Up
Notes On Session
# Biogen Inc Stock Quote
- Double Formation
* (Diagonal Shift)) - *100 EMA | Completed Survey
* (A+ SIgnal)) - *Valid Shift | Subdivision 1
- Triple Formation
* (P1)) / (P2)) & (P3)) | Subdivision 2
* (TP1) = a / Long Consecutive Range
* (TP2) = b / Short Consecutive Pullback | Subdivision 3
* Daily Time Frame | Trend Settings Condition
- (Hypothesis On Entry Bias)) | Regular Settings
- Position On A 1.5RR
* Stop Loss At 143.00 USD
* Entry At 127.00 USD
* Take Profit At 103.00 USD
* (Downtrend Argument)) & No Pattern Confirmation
* Ongoing Entry & (Neutral Area))
Active Sessions On Relevant Range & Elemented Probabilities;
European-Session(Upwards) - East Coast-Session(Downwards) - Asian-Session(Ranging)
Conclusion | Trade Plan Execution & Risk Management On Demand;
Overall Consensus | Sell

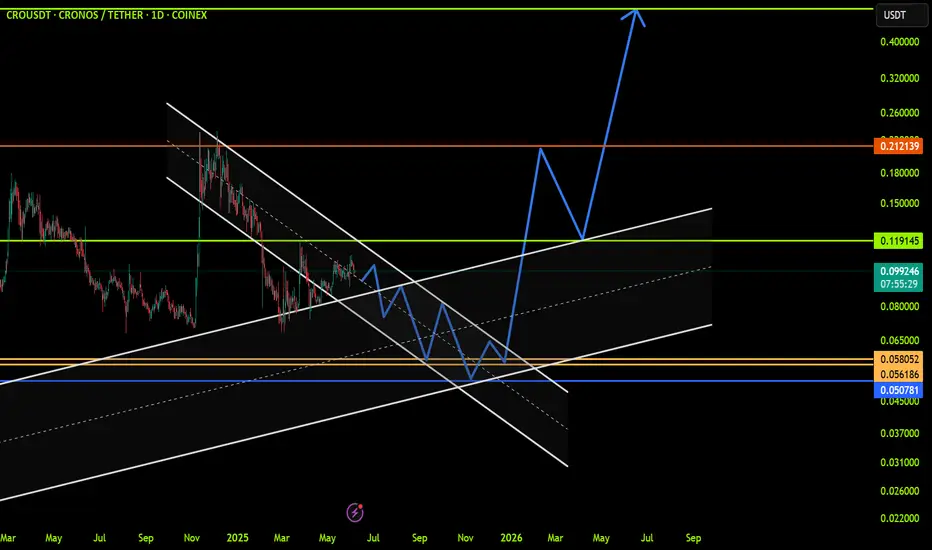
CROUSDT: Trend in daily timeframeThe color levels are very accurate levels of support and resistance in different time frames, and we have to wait for their reaction in these areas.
So, Please pay special attention to the very accurate trend, colored levels, and you must know that SETUP is very sensitive.
Be careful
BEST
MT
ETCUSDT: Trend in daily timeframeThe color levels are very accurate levels of support and resistance in different time frames, and we have to wait for their reaction in these areas.
So, Please pay special attention to the very accurate trend, colored levels, and you must know that SETUP is very sensitive.
Be careful
BEST
MT

ILVUSDT: Trend in daily timeframeThe color levels are very accurate levels of support and resistance in different time frames, and we have to wait for their reaction in these areas.
So, Please pay special attention to the very accurate trend, colored levels, and you must know that SETUP is very sensitive.
Be careful
BEST
MT

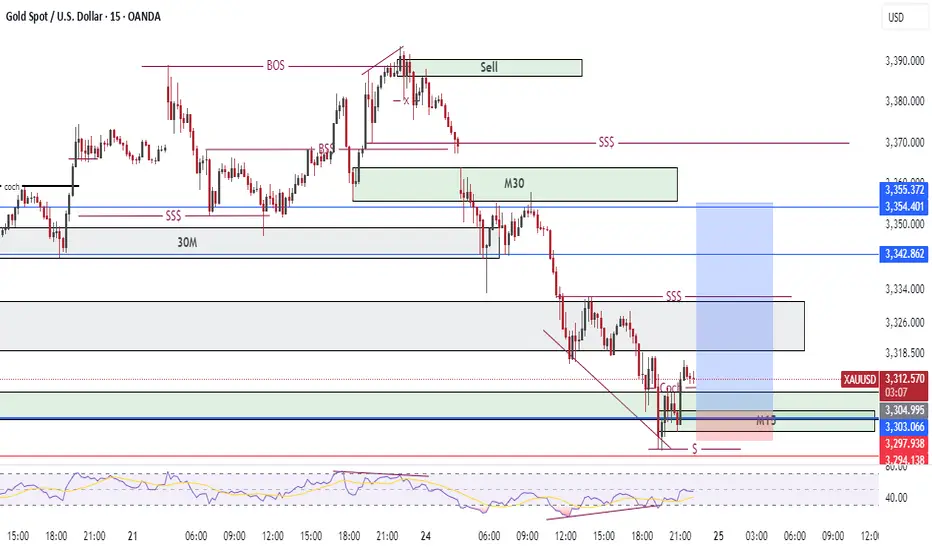
XAUUSD BUY SETUPHere the price action shows bullish shift at M15 so we wait to retest at our zone to enter buy .
Please follow to support me .
Thank you !
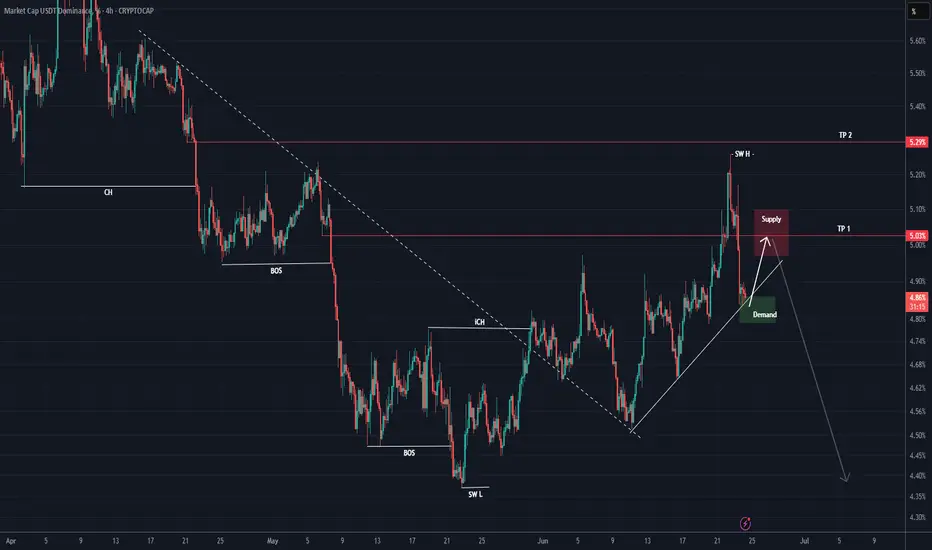
USDT DOMINANCE New Update (4H) First of all you should know that "USDT Dominance" is always moving inverse of BTCUSDT .
In this analysis, we want to examine this index on lower timeframes. It has reached a support zone and a trendline.
Ideally, we should see a pullback from the green box toward the red box.
There is a high chance of price rejection from the red box to the downside, which could lead to a bullish move in the market.
Let’s see how the price reacts to the red box.
For risk management, please don't forget stop loss and capital management
Comment if you have any questions
Thank You