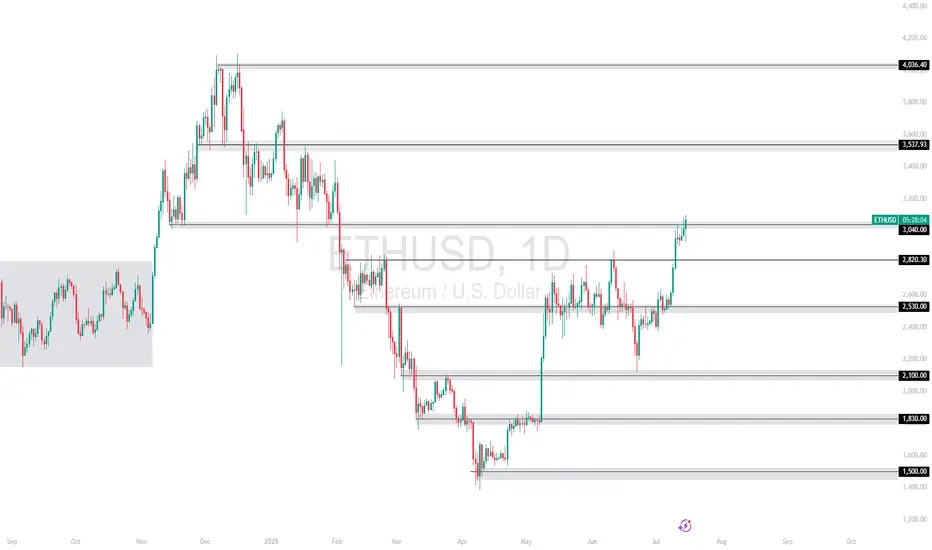
ETHUSD | Breakout Watch Above $3,040Ethereum has surged above the critical $2,530 resistance zone and is now challenging $3,040, a key structure level. A daily close above this could open the path toward $3,537 and even $4,056 in the mid-term.
Support at: 2,530 / 2,100 / 1,830 🔽
Resistance at: 3,537.93 / 4,056.40 🔼
🔎 Bias:
🔼 Bullish: Holding above 2,530 confirms breakout structure; a clean break above 3,040 targets higher zones.
🔽 Bearish: Failure to stay above 3,040 may invite a retest of 2,530.
📛 Disclaimer: This is not financial advice. Trade at your own risk.
Pivot Points
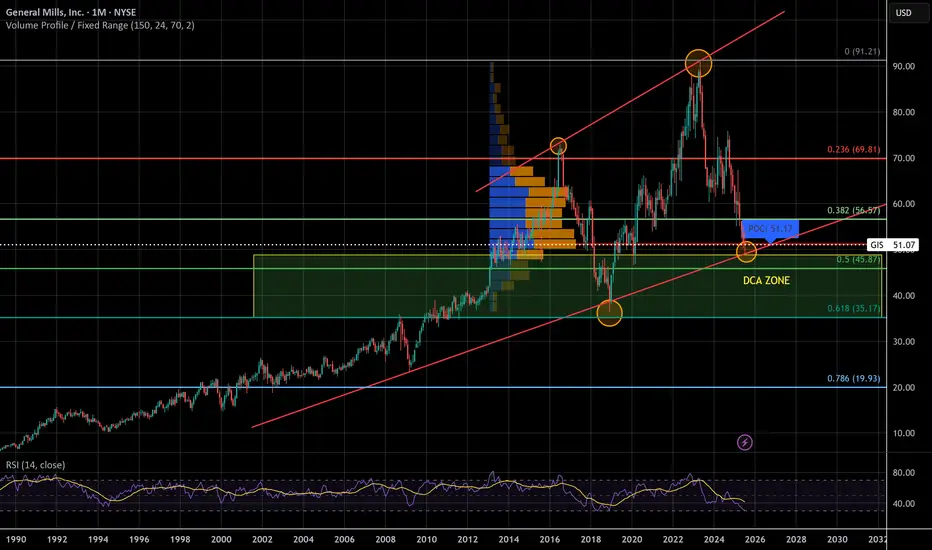
General Mills - Legendary Recession StockWe could be witnessing the biggest correction in General Mills history, again! For the 2nd time in 5 years! I trust in the golden fib, volume looks good, and RSI is low. If it makes it to the top of the channel it'll double in price in the coming years. This looks like a good candidate for Elliott Waves but I'm no good with them.
A lot of people think a recession is coming, if that is the case a lot of people will be buying general mills. More eating at home to save money = more groceries purchased. Looking at the previous financial recessions, General Mills lost 30-35% and recovered swiftly to even greater heights
Tariffs could also heavily affect general mills, which is why I DCA instead of 'aping fat bags'. Making money is hard, but holding onto it is even harder.
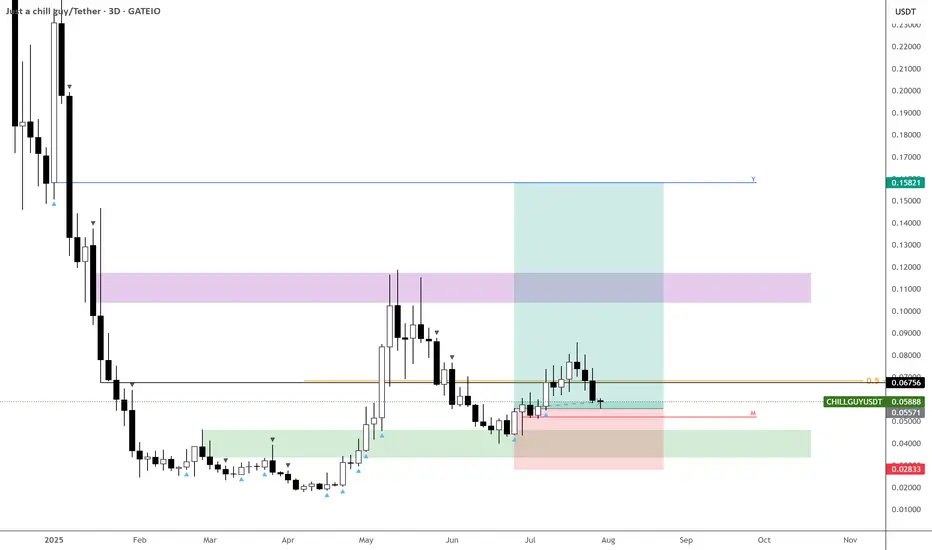
$CHILLGUYUSDT – Second Chance Before the Breakout?Getting a second chance to enter $CHILLGUYUSDT.
Price is still basing out and holding key levels—looking constructive.
I’m adding here and will continue to do so as long as this structure holds.
The path remains tilted to the upside for now.
15 cents still firmly on the horizon.
Dieteren Group Quote | Chart & Forecast SummaryKey Indicators On Trade Set Up In General
1. Push Set Up
2. Range Set Up
3. Break & Retest Set Up
Notes On Session
# Dieteren Group Quote
- Double Formation
* (Reversal Argument)) + (Diagonal Shift)) | Completed Survey
* (Downtrend Argument)) - *Double Top Structure | Subdivision 1
- 49 bars, 67d | Date Range Method
- Triple Formation
* (P1)) / (P2)) & (P3)) | Subdivision 2
* Daily Time Frame | Trend Settings Condition | Subdivision 3
- (Hypothesis On Entry Bias)) | Indexed To 100
- Position On A 1.5RR
* Stop Loss At 118.00 EUR
* Entry At 107.00 EUR
* Take Profit At 91.00 EUR
* (Downtrend Argument)) & Pattern Confirmation
- Continuation Pattern | Not Valid
- Reversal Pattern | Valid
* Double Top | Short Set Up
* Ongoing Entry & (Neutral Area))
Active Sessions On Relevant Range & Elemented Probabilities;
European-Session(Upwards) - East Coast-Session(Downwards) - Asian-Session(Ranging)
Conclusion | Trade Plan Execution & Risk Management On Demand;
Overall Consensus | Sell

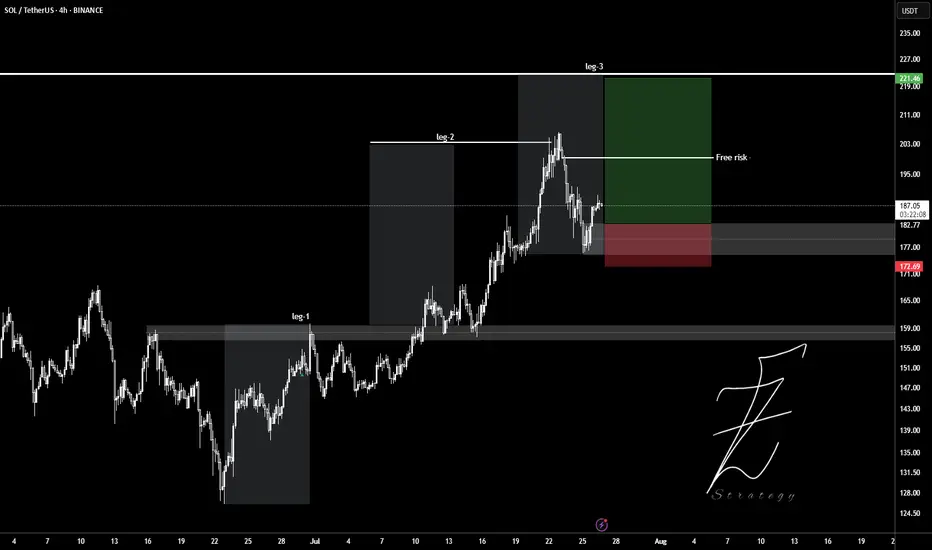
SOLUSDTWait for pollback to 180$ level and ready to get buy position.
Target set in leg2 and leg3.
Entry: 182
Stop: 177
Tp: 190 - 200 - 210 - 220
Please control Risk management.
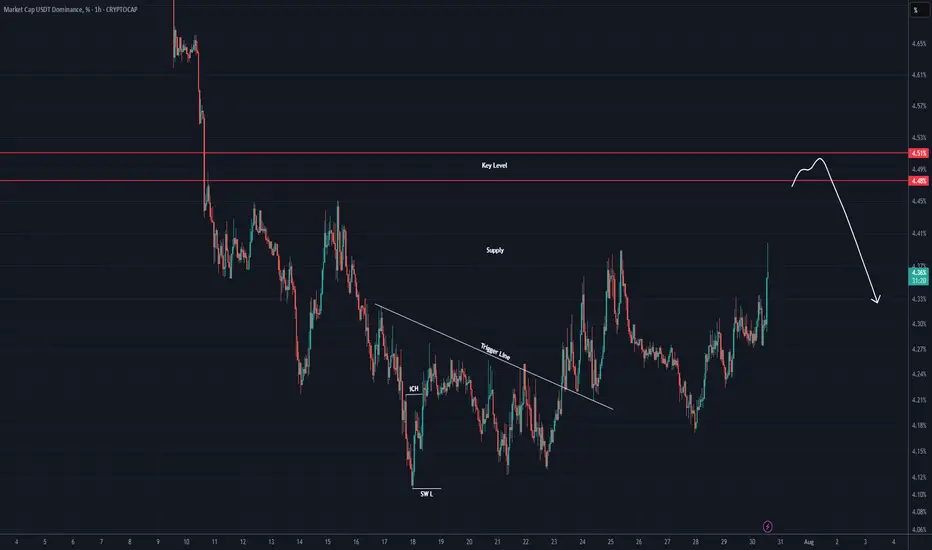
USDT DOMINANCE New Update (4H)First of all you should know that "USDT Dominance" is always moving inverse of BTCUSDT
We have a key level on the chart that This key level has been lost, and there hasn't been a pullback to it yet. It seems that the candles intend to make a pullback to this level. Upon this pullback, we expect a rejection to the downside.
Let's see what happens.
For risk management, please don't forget stop loss and capital management
Comment if you have any questions
Thank You
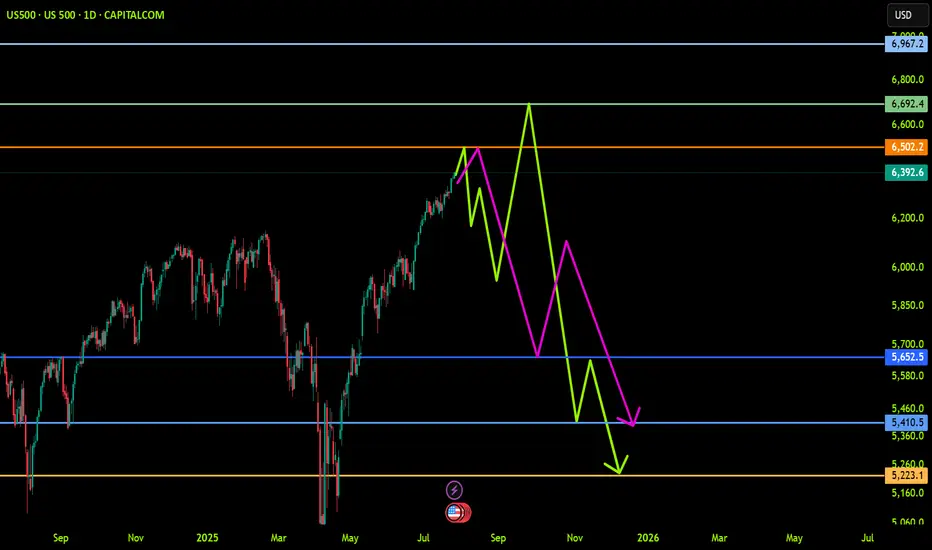
US500 (S&P): Trend in daily time frameThe color levels are very accurate levels of support and resistance in different time frames, and we have to wait for their reaction in these areas.
So, Please pay special attention to the very accurate trends, colored levels,
and you must know that SETUP is very sensitive.
Be careful
BEST
MT
How to Find Liquidity Zones/Clusters on Any Forex Pair (GOLD)
You need just 1 minute of your time to find significant liquidity zones on any Forex pair and Gold.
In this article, I will teach you how to identify supply and demand zones easily step by step.
Liquidity Basics
By a market liquidity, I mean market orders.
The orders are not equally distributed among all the price levels.
While some will concentrate the interest of the market participants,
some levels will be low on liquidity.
Price levels and the areas that will attract and amass trading orders will be called liquidity zones.
How to Find Supply Zones
To find the strongest liquidity clusters, we will need to analyze a daily time frame.
A liquidity zone that is above current prices will be called a supply zone.
High volumes of selling orders will be distributed within.
One of the proven techniques to find such zones is to analyze a historic price action. You should identify a price level that acted as a strong resistance in the past.
4 horizontal levels that I underlined on EURGBP influenced market behavior in the recent past.
The price retraced from these levels significantly.
Why It Happened?
A down movement could occur because of an excess of selling orders and a closure of long positions by the buyers.
These factors indicate a high concentration of a liquidity around these price levels.
How to Draw Supply Zone?
One more thing to note about all these horizontal levels is that they cluster and the distance between them is relatively small .
To find a significant liquidity supply zone, I advise merging them into a single zone.
To draw that properly, its high should be based on the highest high among these levels. Its low should be based on the highest candle close level.
Following this strategy, here are 2 more significant supply zones.
We will assume that selling interest will concentrate within these areas and selling orders will be spread across its price ranges.
How to Find Demand Zones
A liquidity zone that is below current spot price levels will be called a demand zone . We will assume that buying orders will accumulate within.
To find these zones, we will analyze historically important price levels that acted as strong supports in the past.
I found 3 key support levels.
After tests of these levels, buying pressure emerged.
Why It Happened?
A bullish movement could occur because of an excess of buying orders and a closure of short positions by the sellers. Such clues strongly indicate a concentration of liquidity.
How to Draw Demand Zones?
Because these levels are close to each other, we will unify them into a one liquidity demand zone.
To draw a demand zone, I suggest that its low should be the lowest low among these key levels and its high should be the lowest candle close.
Examine 2 more liquidity zones that I found following this method.
Please, note that Demand Zone 2 is based on one single key level.
It is not mandatory for a liquidity zone to be based on multiple significant levels, it can be just one.
We will assume that buying interest will concentrate within these areas and buying orders will be allocated within the hole range.
Broken Liquidity Zones
There is one more liquidity zone that I did not underline.
That is a broken supply zone. After a breakout and a candle close above, it turned into a demand zone. For that reason, I plotted that based on the rules of supply zone drawing.
Start Market Analysis From Liquidity
Liquidity zones are one of the core elements of forex trading.
Your ability to recognize them properly is the key in predicting accurate price reversals.
Identify liquidity zones for:
spotting safe entry points,
use these zones as targets,
set your stop losses taking them into consideration.
They will help you to better understand the psychology of the market participants and their behavior.
I hope that the today's tutorial demonstrated you that it is very easy to find them.
❤️Please, support my work with like, thank you!❤️
I am part of Trade Nation's Influencer program and receive a monthly fee for using their TradingView charts in my analysis.
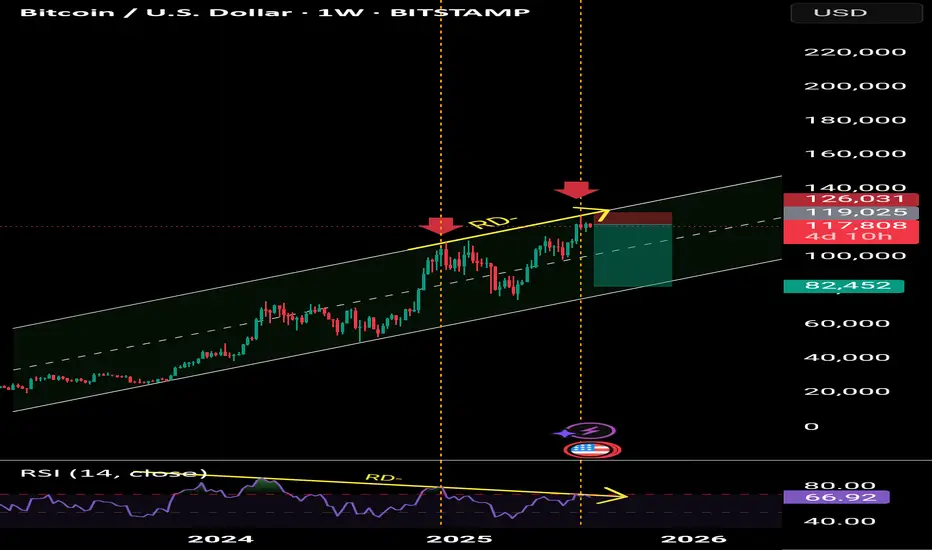
Bitcoin sell short Bitcoin has negative divergence on the weekly timeframe and is suffering. The target is $82,000. It is now the channel ceiling. The market is heavily bearish.
Bitcoin Tp:82000
😘😘😘
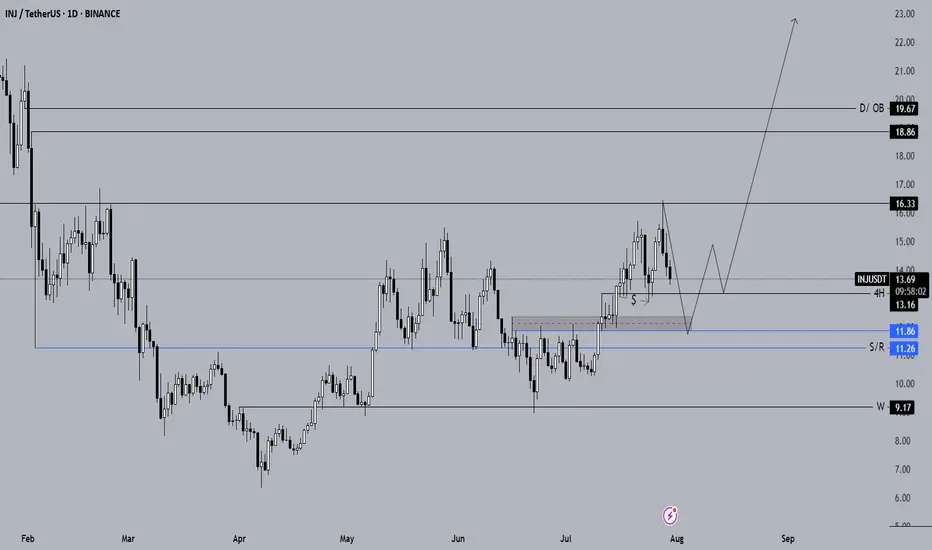
Long-Term Spot Technical Analysis of INJ CoinWhen evaluating INJ coin for long-term spot investments, it is evident that the price continues its downward movement after being rejected from the daily resistance level at $16.33. If INJ fails to receive a strong buying reaction from the $13.16 support in the coming days, the downtrend is likely to persist.
Our preferred long-term spot entry zone lies between the $11.86 – $11.26 support range. If INJ retraces to the blue support zone marked on the chart, we intend to accumulate with a long-term target of $23.
As long as INJ continues to close daily candles above the $10 level, we will maintain our long-term spot positions. Should the price rebound from the $11.86 – $11.26 zone, our initial upside target will be $16.33.
Not Financial Advice (NFA).
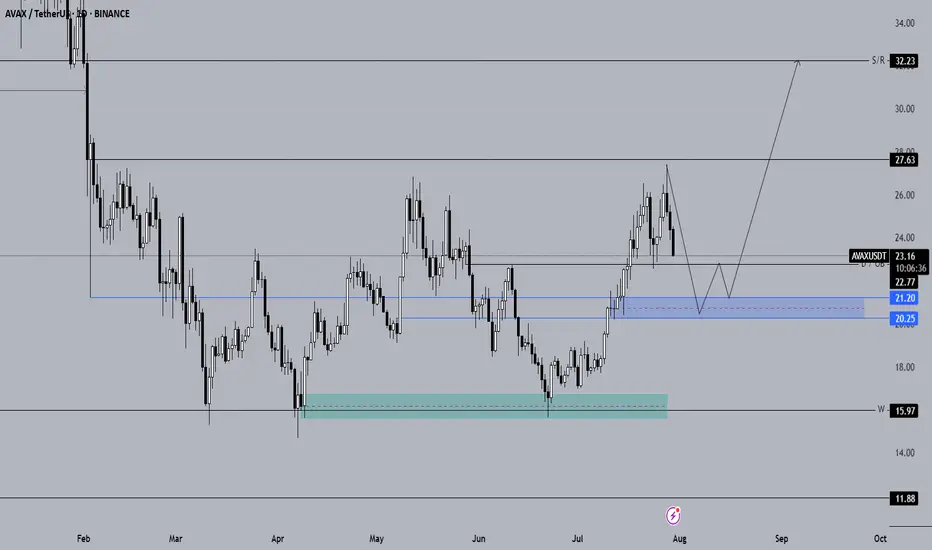
Long-Term Technical Analysis of AVAX CoinWhen evaluating AVAX for long-term investments, the blue support zone highlighted on the chart stands out as the key area to monitor for potential spot entries. If AVAX closes daily candles below the $22.77 level, it is expected to continue its downward trend.
The primary spot buy zone for AVAX is identified between the $21.20 – $20.25 support range. If the price retraces into the blue zone on the chart, we plan to initiate spot positions. Should AVAX show a reversal from this area, our next upside targets are $27.63 and $32, respectively.
If AVAX fails to generate a strong reaction from the blue zone and continues to decline, we will then monitor the $18 support level. As long as AVAX holds above $18, our bullish outlook from this analysis remains valid.
Not Financial Advice (NFA).
Long-Term Technical Analysis of ENA CoinENA coin continues its downward movement after being rejected from the $0.70 resistance level. As long as ENA holds above the 4H support level at $0.5549 with confirmed 4-hour candle closes, it is likely to attempt a rebound toward the weekly resistance zone (marked in blue).
However, if ENA loses the $0.5549 support level and closes multiple 4H candles below it, further downside momentum is expected. In such a scenario, the initial downside target would be $0.4611.
For long-term spot investments in ENA, the price range between $0.3952 and $0.3781 should be closely monitored by investors.
Our plan is to accumulate ENA coin within the $0.3952 – $0.3781 support range for long-term spot positions. If the price reaches this zone, our target will be set at $1.
Not Financial Advice (NFA).

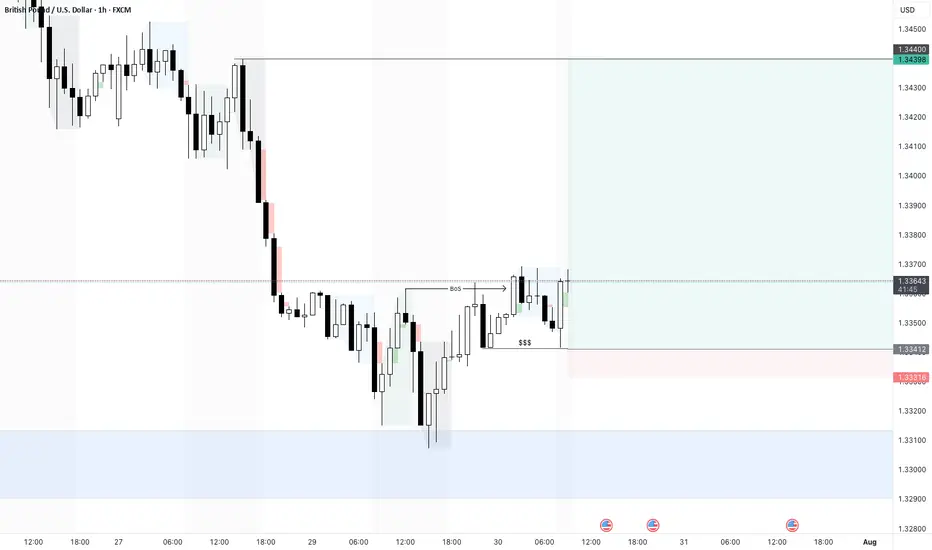
GBPUSD - 30/7/25 - PIvot to bullishYesterday price touched a HTF demand zone that i marked out and on the 1 hour formed a break of structure. This is as per my plan a pivot ore reversal sign.
Now trying to find an entry its trickier. Initially i wanted to enter higher up at the green imbalance that is there, but i noticed equal low liquidity marked as $$$ which i will assume will be taken out. I placed a buy-limit here with a tighter SL than i normally go for, but the TP is the next high.
Today is a high impact news day with the Fed releasing news later today -hence i will not take as many trades.
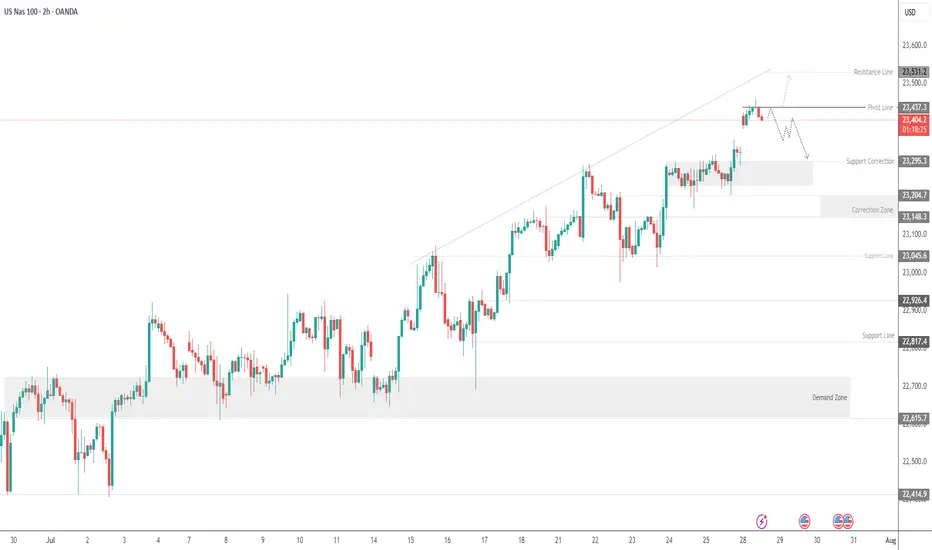
USNAS100 Correction in Play – Watching 23390 & 23440USNAS100
The price is undergoing a bearish correction while trading below 23440, with downside targets at 23300 and 23295, especially if a 1H candle closes below 23390.
A bullish scenario will be activated if price closes 1H above 23440, opening the path toward 23530 and potentially 23700.
At the moment, the market appears to be correcting toward 23295 before attempting a bullish rebound.
Support Levels: 23300 – 23210 – 23150
Resistance Levels: 23530 – 23700
Nifty Analysis EOD – July 30, 2025 – Wednesday🟢 Nifty Analysis EOD – July 30, 2025 – Wednesday 🔴
Trapped in Illusion – A Day of Decoy Moves
Nifty moved 130 points today, falling short of the 2-week average range of 196 points. It formed its IB by 11:40 AM, marking the day's high and low early. For the rest of the session, it hovered between the IB high and the previous day high, eventually closing near the mean.
Despite a close below the open, Nifty managed a green close vs. the previous day—making it a classic "moboroshi candle" day, where visuals deceive sentiment.
📉 Intraday 5 Min Time Frame Chart
🪜 Intraday Walk
IB formed by 11:40 AM
False breakout on both sides trapped traders badly
Nifty stayed stuck between IB high and PDH
Closed slightly above the previous close, but below open
Eyes on breakout of 24,910 for targets of 24,995 and 25,090–25,110
🔄 Trend & Zone Update
📈 Resistance Zone Shifted To: 25,110 ~ 25,090
📉 Support Zone Shifted To: 24,520 ~ 24,480
🕯 Daily Time Frame Chart with Intraday Levels
🕯️ Daily Candle Breakdown
Candle Type: Small Red Hammer‑Like Candle (Decoy / Moboroshi)
Today’s OHLC:
🟢 Open: 24,890.40
🔺 High: 24,902.30
🔻 Low: 24,771.95
🔴 Close: 24,855.05
📈 Change: +33.95 (+0.14%)
📌 Candle Structure:
Real Body: 35.35 pts (Small bearish body)
Upper Wick: 11.90 pts (Very small)
Lower Wick: 83.10 pts (Long)
📌 Key Observations:
Buyers stepped in near 24,770 zone
Closed near open but slightly lower → mild net selling
Long lower wick indicates dip buying support
📌 Implication:
Buyers defended 24,770–24,780 zone
A reclaim of 24,900–24,920 may resume bullish move
A close below 24,770 weakens support
🛡 5 Min Intraday Chart
🛡️ Gladiator Strategy Update
ATR: 195.72
IB Range: 78.15 → Medium
Market Structure: Balanced
💥 Trades Triggered:
🕙 10:25 AM – Short Entry → SL Hit
📌 Trade Summary:
False IB breakouts on both sides led to a stop loss hit—typical trap in a tight consolidation phase.
📌 Support & Resistance Levels
📈 Resistance Zones:
24,880 ~ 24,890
24,910
24,995
25,090 ~ 25,110
📉 Support Zones:
24,830 ~ 24,820
24,780
24,725 ~ 24,715
24,660 ~ 24,650
🔮 What’s Next? / Bias Direction
Awaiting breakout above 24,910 for potential targets of 24,995 and 25,090–25,110. Consolidation may reward patient breakout players in upcoming sessions.
🧠 Final Thoughts
“Structure is key. When levels work, respect them. When they break, adapt.”
Today's range was narrow, but traps show signs of buildup. Be ready when the market unwinds.
✏️ Disclaimer
This is just my personal viewpoint. Always consult your financial advisor before taking any action.

USDJPY - 30/7/25 - BoS to a bearish pull backI dont normally trade USDJPY but i see a setup based on my strategy. The price was climbing to take out a previous high on the 4H and Daily TF. But on the hourly there is a clear BoS which suggests that there may be a pull back even though the HTF bias is still bullish.
+ve:
1. there is a BoS on the 1 hour chart
2. Equal low liquidity just below which will draw price to this zone
3. Big imbalance below the equal low liquidity
-ve:
1. Fed news today may push the market against my trade idea
BTCUSDT.PThe best area to buy MARKETSCOM:BITCOIN is $119,000 and wait for the pullback to be complete.
But for selling and shorting, be sure to wait for $115,000 to break down.
⚠️Please control risk managements.
USDT DOMINANCE Update (2H)After losing important levels, the price has now started to pull back, and it seems that some of the market’s major players have taken profits.
On the chart, the price faces two key levels ahead, from which it could be rejected at either one.
There is also a possibility that the price will reach the key level zone.
We are waiting for the reaction to these levels.
A daily candle close above the invalidation level will invalidate this analysis.
For risk management, please don't forget stop loss and capital management
Comment if you have any questions
Thank You

OSCR: back to support and now it’s decision timeAfter the recent impulse move, OSCR has pulled back to a key support zone around 13.65. That area aligns with the 0.79 Fib retracement, a horizontal level from spring, and a rising trendline that has already triggered reversals in the past. The structure is still intact, and buyers are testing the level again. If support holds and we get a bullish confirmation, the next target is 17.01, followed by a potential breakout toward the high at 22.81.
Volume remains elevated, the overall structure is healthy, and the correction is controlled. A break below 13.00 would invalidate the setup - until then, it’s a clean, high-reward zone with tight risk.
Fundamentally, Oscar Health has revised its 2025 guidance: revenue is expected in the $12–12.2B range, with operating losses projected between $200M and $300M. Despite softening topline growth, earnings per share are improving, and investor sentiment has been shifting. Technical strength is also reflected in the recent rise in RS Rating to 93, confirming that the stock is showing relative leadership even as the market cools.
This is one of those setups where both technicals and narrative are aligning - now we just need confirmation from the chart.
GOLD GOLDEN XauUsd is now still respecting the trend and will keep holding expecting an even stronger push to the up side
AITECH Main trend Channel Wedge. Reversal zones. AI. 30 07 2025Logarithm. Time frame 1 week. Main trend. Huge pumps for hype. The price is driven up on dexes, and profits are realized on centralized medium and low liquid exchanges. Important. Twitter (X) of the project has 560 thousand subscribers. That is, at the right time there will be a flow of positive news for subscribers who are former holders, or potential buyers (there are most of them, they buy only very expensive ones) and pumping as before, but by a smaller percentage.
And while in the ascending channel, the decline phase forms a descending wedge in the secondary trend. A triangular formation has formed in the local trend. The logic of the reversal zones is shown with arrows.
What is it. From the marketplace:
Solidus AI Tech is building one of Europe's first Web3-based AI infrastructures, powered by a state-of-the-art, green HPC data center. The $AITECH token powers an ecosystem of products that combine AI utilities, scalable computing, and Web3 tools, empowering developers, enterprises, and institutions to easily build, deploy, and scale AI solutions.
With the support of major partners including NVIDIA, IBM, Fetch.ai, Tron, BNBChain, Binance Wallet, Trustwallet, and many more, Solidus AI Tech is becoming one of the most advanced and adaptable Web3 AI token projects, positioning itself among industry leaders.
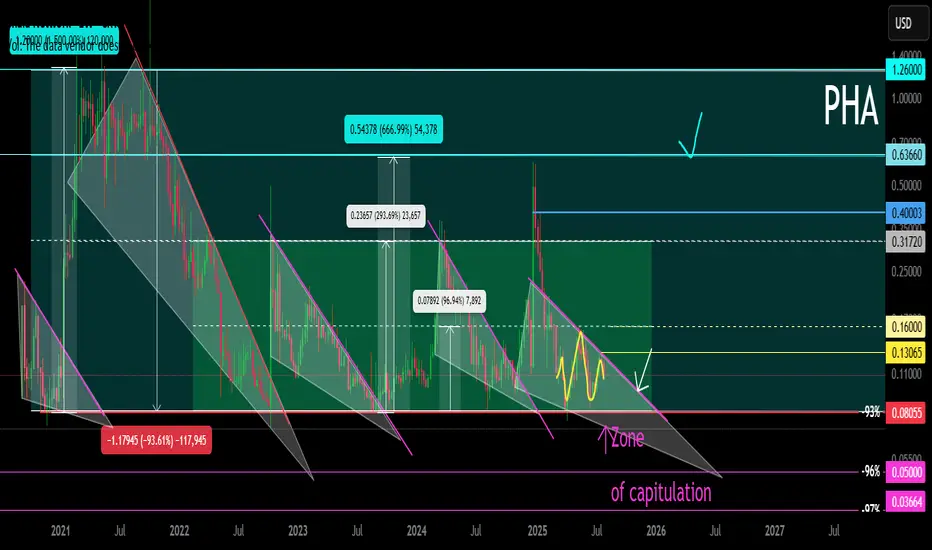
PHA Main trend since 2020. Hype Web3 AI 07 2025Cryptocurrency as an example. This applies to all similar assets by liquidity. Logarithm main trend. Time frame 1 week (smaller time frame, to understand the shown and described, is not necessary). Cryptocurrency is an imitation of utility with a good legend, which is traded on liquid exchanges (in the decline phase in the next cycle) most likely there will be delists, if they do not make a “restart” (rebranding). A big plus in the crypto legend of this project is that it is mentioned as the basis of the legend of Web3 and AI.
What is it. Phala Network is an execution layer for Web3 AI. By allowing AI to understand blockchains and interact with them, it removes the barrier for the first billion users joining Web3.
Phala Network's multi-security system is a solution to the problem of AI execution. Based on Phala Network, you can easily create hack-proof and unstoppable AI agents tightly integrated with on-chain smart contracts using AI-Agent Contract.
Agentize smart contracts: create AI agents for smart contracts using natural and programming languages.
End of participation phase. Created a project at the end of the participation phase in 2020 09 before entering the distribution zone of the last cycle with the highs of 2021.
Market distribution . Then, under the hype of alts, very aggressive convincing marketing and pumping over +1500%. Long distribution (more than 9 months) with price retention at a huge profit and publication of convincing fairy tales-news for “pouring” fresh fuel (mass pipel) through info wires in the market distribution zone of 2021.
Phase of decline to the recruitment zone. (partial change of hands, those who created, they do not need it). Phase of decline from the sales zone (advertisement is good), to the purchase zone (no advertising, no activity) -93%. That is, the “fresh fuel” money of investors turned into “dust” on the spot (conditionally $ 1000 of super promising next "shit", in $ 50-100), on futures still in the distribution zone “disappeared”.
Phase of accumulation (use of many short alt seasons to shake the price and “shake out”). Upon reaching the recruitment zone, — reverse. They made a reversal, pump-buyout of liquidity (their heavy orders) by a large % (+580%), which served as the starting points for the formation of the horizontal pump / dump channel range, that is, conditional accumulation.
Now another wedge is being formed locally in the horizontal channel — its breakthrough, the beginning of the pumping and another altseason, which can develop into the participation phase.
It is worth noting that they can enter the long stop loss and long liquidation zone when forming a wedge (this often happens). Take this into account in your money management in advance. Accept risks, or distribute entry money when implementing force majeure in advance, even if you do not lie that this is possible. The capitulation phase (part of accumulation, liquidity collection), that is, “dumping passengers” and the final liquidation of their faith, does not always happen, which is logical.
On weak assets (very old, low liquidity), outright scams that have "outlived their usefulness", the capitulation phase sometimes ends in a complete scam.
Alt-seasons of accumulation and capitulation zones . During this time, there were 3 average alt seasons, which naturally affected the price of this cryptocurrency (3 pumping waves in the channel +580%, +300%, +650% (average gain/drop conditionally in half), price movements in the median zone of a large trend channel.
Participation phase — most likely, there will be a series of pumps with sticks under the market trend as a whole, and most importantly, the hype of everything related to AI.
Distribution phase — most likely will be shorter in time than before, and still I would exit mostly under the mirror zone of the previous distribution, as the project is “old”, the hype "the chart remembers the deceived investors". Then two options, the development of the paths of which depends on the market as a whole, and not on this candy wrapper.
a) Consolidation and exit from it to the second zone of the final distribution ("the hamster is not scared", "it will grow forever").
b) Transition to the decline phase, then the fading of marketing, the final loss of liquidity (supporting the project with money), and a gradual (delists, regulation, norms) or sharp scam (hacking, etc.).
It does not matter which path we take in the distribution phase, the final path, like everything similar created under the hype, is the loss of liquidity, oblivion and scam. Therefore, do not forget to sell such (99.999% of the crypto market) at high prices, despite the positive news deception creeping into the mind through the ears and eyes.
Rebranding. Restart. Resetting price charts. If they do it like EOS and similar "old" scams — rebranding (preparing for a new market hype in advance), and remove all charts from exchanges, so that for the new market hype as a whole, the project would be “fresh” according to the chart, new, that is, the previous scam of "few experienced investors" would not be visible, then pumping up more than +1000% is possible, but this is irrational... As you need to spend a lot of money, it is easier to create a new imitation of something useful...
The market phases are clearly visible on the chart. I also described everything in detail.
Nifty Analysis EOD – July 29, 2025 – Tuesday🟢 Nifty Analysis EOD – July 29, 2025 – Tuesday 🔴
Bulls Strike Back After Trendline Trap & Break
Nifty started below the previous day's low, and after marking day low at 24,598.60, it rose to 24,725 where it faced the trendline and CPR zone. A sharp rejection from there quickly pushed Nifty back to the day's open level. A base-building process began, characterized by a low-range but high-volatility phase.
Gradually, Nifty crossed the VWAP and the trendline again, breaking the day's high and CPR zone, ultimately reaching R1 and closing near the highest point at 24,830.40.
In the first half, both long and short traders got trapped in fast swings—refer to the chart for visual cues.
🕯 5 Min Time Frame Chart with Intraday Levels
🔄 Trend & Zone Update
📈 Resistance Zone Shifted To: 25,110 ~ 25,090
📉 Support Zone Shifted To: 24,520 ~ 24,480
🕯 Daily Time Frame Chart with Intraday Levels
🕯 Daily Candle Breakdown
Open: 24,609.65
High: 24,847.15
Low: 24,598.60
Close: 24,821.10
Change: +140.20 (+0.57%)
🕯Candle Structure Breakdown:
Real Body: Green candle (Close > Open):
24,821.10 − 24,609.65 = 211.45 pts (large bullish body)
Upper Wick: 26.05 pts (small)
Lower Wick: 11.05 pts (very small)
🕯Interpretation:
Market opened lower but found strong buying support, rallying to nearly 24,850.
Closed near the day’s high—bulls dominated.
Tiny lower wick shows hardly any selling pressure after the open.
🕯Candle Type:
Bullish Marubozu-type — strong signal of reversal or continuation, indicating control by buyers.
🕯Key Insight:
Strong bounce from sub-24,600 back above 24,800 has improved short-term sentiment.
If 24,830–24,850 breaks in the next session, potential upside till 24,920–24,995.
Support now shifts to 24,700–24,720.
🛡 5 Min Intraday Chart
⚔️ Gladiator Strategy Update
ATR: 202.98
IB Range: 128.5 → Medium
Market Structure: Balanced
Trades Triggered:
🕒 11:10 AM – Long Entry → Target Hit 🎯 (1:3 Risk:Reward)
🧱 Support & Resistance Levels
Resistance Zones:
24,815 ~ 24,830
24,850
24,920
24,995
Support Zones:
24,725
24,693
24,660 ~ 24,650
🧠 Final Thoughts
“Volatility shakes the weak hands; structure empowers the patient.”
Today’s session was a textbook example of how the market tests conviction. After trapping early traders with sharp intraday swings, Nifty rewarded those who respected structure and waited for confirmation. The reclaim of the trendline, VWAP, and CPR zone reinforced the strength of bullish intent. If the momentum continues above 24,850, we may be entering a fresh leg of the uptrend—stay nimble, but don't lose sight of the bigger picture.
✏️ Disclaimer
This is just my personal viewpoint. Always consult your financial advisor before taking any action.
