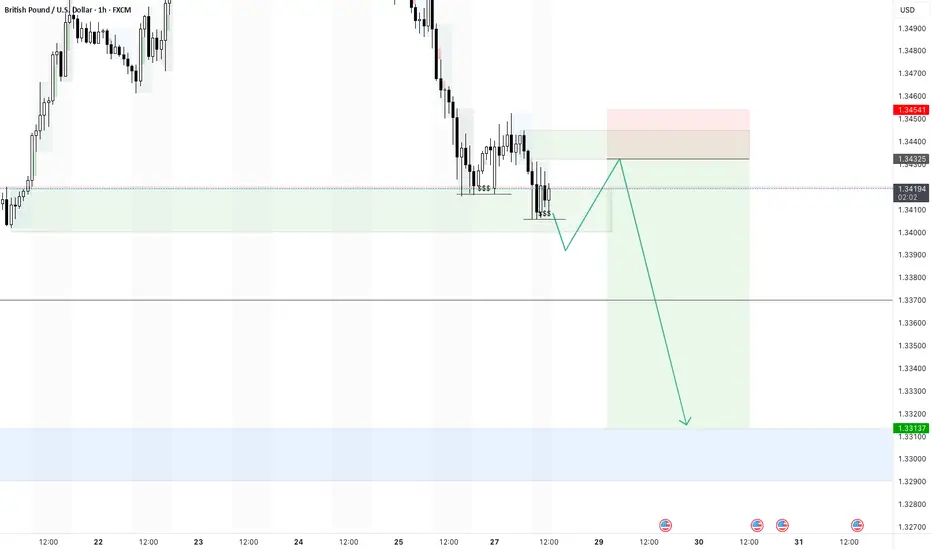
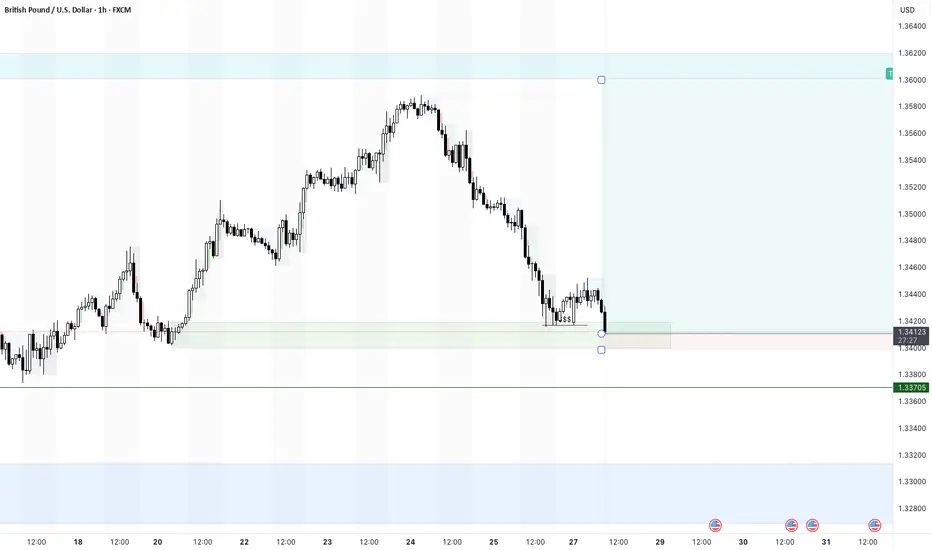
GBPUSD - 28/7/25 - Bearish continuationI do have a bullish trade open current from this zone, but will move the SL to breakeven or take a small loss.
The new idea if the equal low liquidity is swept is to take a bearish trade as shown.
Pivot Points
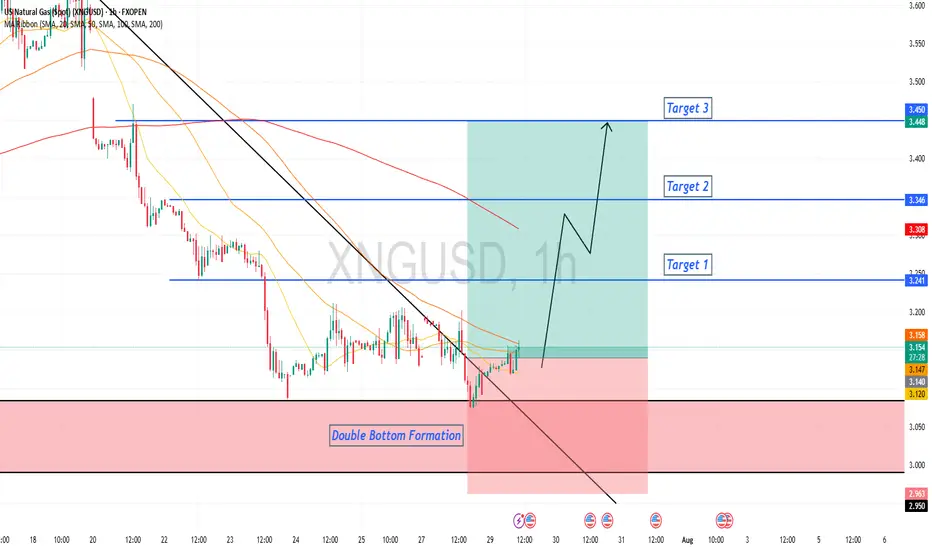
Natural Gas is in the Buying DirectionHello Traders
In This Chart NATGAS HOURLY Forex Forecast By FOREX PLANET
today NATGAS analysis 👆
🟢This Chart includes_ (NATGAS market update)
🟢What is The Next Opportunity on NATGAS Market
🟢how to Enter to the Valid Entry With Assurance Profit
This CHART is For Trader's that Want to Improve Their Technical Analysis Skills and Their Trading By Understanding How To Analyze The Market Using Multiple Timeframes and Understanding The Bigger Picture on the Charts
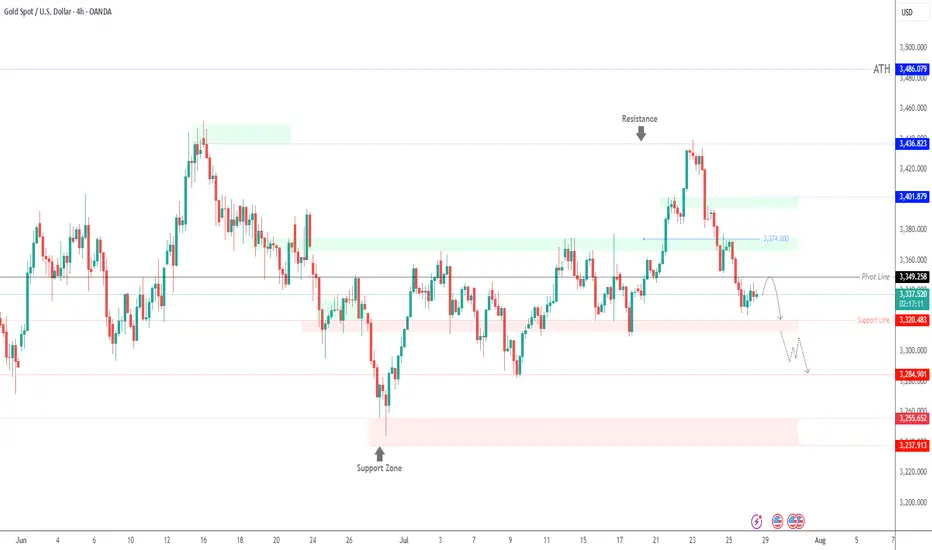
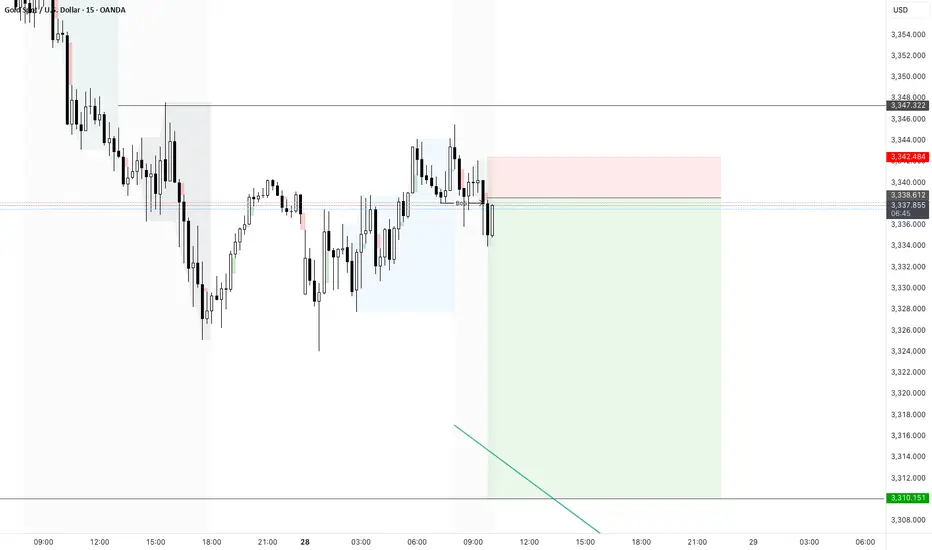
GOLD Slips as Dollar Gains on Trade Deal – Bearish Below 3349
Gold Pares Gains as USD Strengthens on Trade Deal Ahead of Fed
Gold gave up early gains, pressured by a stronger U.S. dollar after the announcement of the US–EU trade agreement.
Meanwhile, attention shifts to upcoming U.S.–China negotiations later today, as both sides aim to extend the current trade truce and avoid new tariffs.
Investors are also closely watching the Federal Reserve’s policy decision on Wednesday, seeking signals on future interest rate moves.
TECHNICAL OUTLOOK:
Gold maintains a bearish trend while trading below 3349, with potential downside toward 3320.
A 1H candle close below 3320 – 3312 would confirm extended bearish pressure targeting 3285, driven in part by ongoing geopolitical risks.
⚠️ To shift back to a bullish structure, the price must stabilize above 3349.
Key Levels:
• Support: 3320 – 3285 – 3256
• Resistance: 3365 – 3375
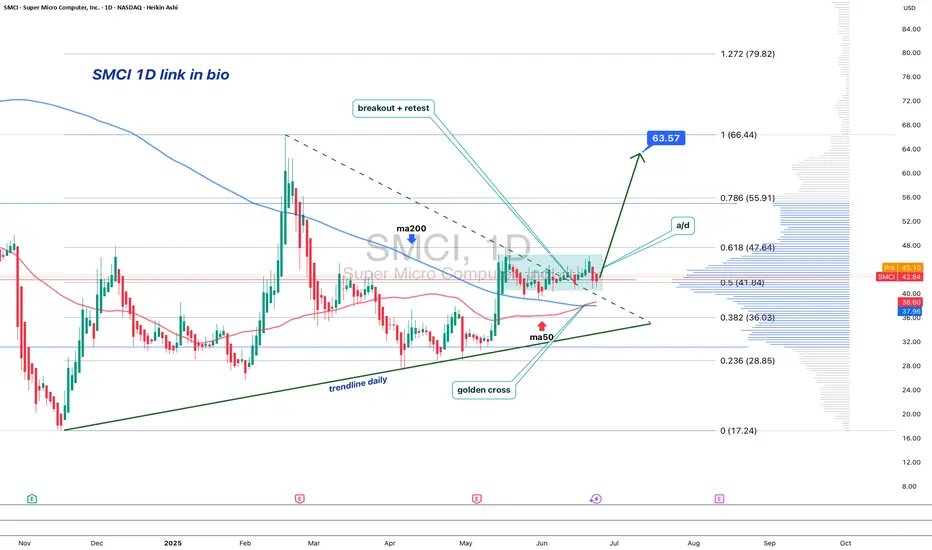
SMCI: When a chart says it’s time to reconnect with the AI hypeOn the daily chart, Super Micro Computer Inc. (SMCI) is showing a clean bullish setup. Price broke out of a descending trendline (green dashed), confirmed it with a retest, and is now consolidating above the breakout zone. The golden cross — where the MA50 crossed above the MA200 — confirms a long-term trend reversal.
Volume profile indicates strong accumulation near $41–43. The 0.5 Fibonacci level at $41.84 acted as support. Above the current range, there’s low volume resistance up to $63.57 (0.786), followed by $66.44 and a final extension target at $79.82 (1.272).
Fundamentals: SMCI is a leading server hardware manufacturer. Demand for their systems has soared with the explosion of AI infrastructure. The company maintains solid financials, with rising quarterly revenue and growing presence in the cloud sector. Institutional investors have been actively increasing their positions since late 2023 — a sign of strong long-term conviction.
Tactical plan:
— Entry: market $42–43
— Target 1: $55.91
— Target 2: $63.57
When technicals scream textbook breakout and fundamentals bring AI momentum to the table — it might just be one of the best late entries in the AI wave this summer.
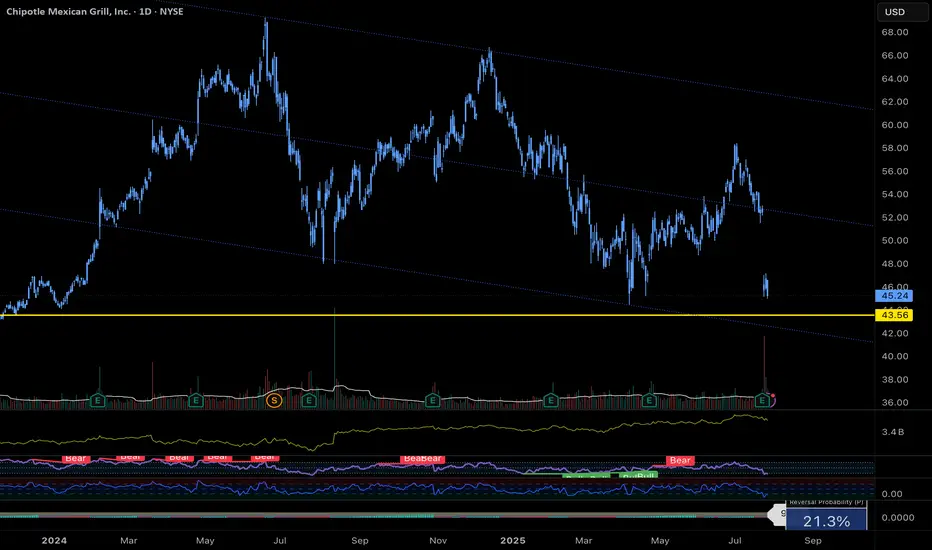
$CMG Approaching Major Support – Buy the Dip or Breakdown?Chipotle ( NYSE:CMG ) just reported earnings and missed on both revenue and same-store sales. Transactions fell 4.9%, and the company lowered its full-year outlook — triggering a sharp decline on elevated volume.
Technically, we’re approaching a major confluence of support near the $43 area (both diagonal trendline support and historical horizontal level).
🔻 Indicators currently suggest continued selling pressure, so traders looking to buy the dip should remain cautious.
Trade Setup Idea:
- Watch for bullish reversal patterns (engulfing, double bottom, trend shift) on 15min–1hr charts
- Avoid premature entries; trend reversals often take time
- NYSE:CMG Confirmation > prediction
📌 Keep alerts set. This one’s worth watching closely.
#CMG #Chipotle #TradingView #TechnicalAnalysis #SupportAndResistance #DipBuy #StocksToWatch
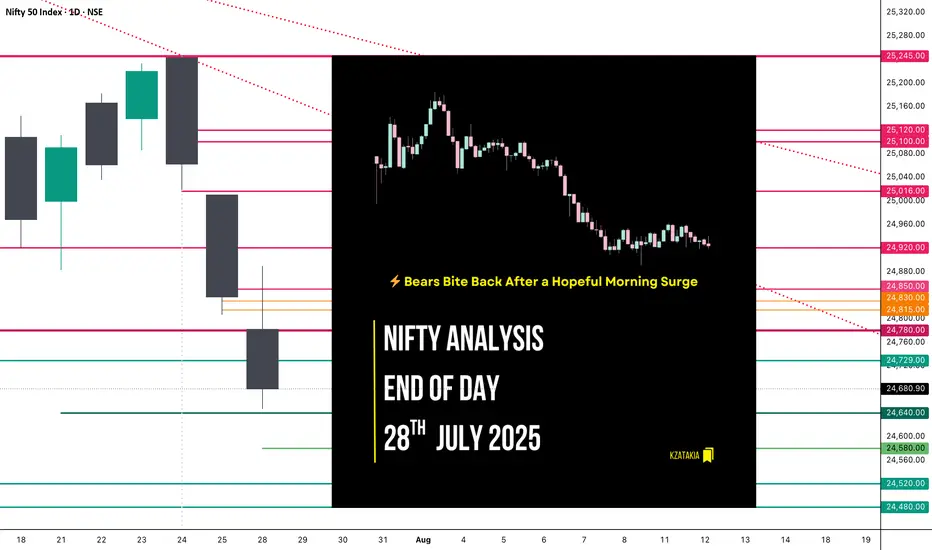
Nifty Analysis EOD – July 28, 2025 – Monday 🟢 Nifty Analysis EOD – July 28, 2025 – Monday 🔴
⚡️ Bears Bite Back After a Hopeful Morning Surge
📊 Nifty Summary
Nifty opened with a minor gap-down of 32 points and slipped an additional 67 points in the first 3 minutes, testing the critical support zone of 24,755 ~ 24,729. After marking a day low at 24,732.70, it witnessed a sharp recovery breaching key levels — CDO, Gap, PDC — and touched the CPR BC level. Rejection from there caused a retracement to the mean, followed by another successful attempt breaching CPR BC and IB High. However, it couldn’t sustain above, as profit booking and pressure from a higher time frame bearish trendline dragged the index below the CPR zone and even past the PDL.
Support at 24,780 offered brief relief, but a bearish triangle formed between the HTF trendline and that support and The breakdown at 12:40 led to a clean move, with the pattern target achieved.
🕯 5 Min Time Frame Chart with Intraday Levels
🔁 Trend & Zone Update
📍 Resistance Zone Shifted To: 25,100 ~ 25,120
📍 Support Zone Shifted To: 24,520 ~ 24,480
🧭 What If Plans – 29th July Outlook
🅰️ Plan A (Contra Long Setup)
If market opens inside the previous day range and finds support at 24,700 ~ 24,729,
→ Potential targets: 24,780, 24,815, 24,840
🅱️ Plan B (Trend is Friend – Short Continuation)
If market opens inside range and faces resistance around 24,830 ~ 24,815,
→ Aim for: 24,780, 24,720, 24,640, 24,580
🔄 On-the-Go Plan
If market Gaps Up/Down outside previous day’s range,
→ Wait for IB formation and act based on structure & S/R levels.
🕯 Daily Time Frame Chart with Intraday Levels
🕯 Daily Candle Breakdown
Open: 24,782.45
High: 24,889.20
Low: 24,646.60
Close: 24,680.90
Change: −156.10 (−0.63%)
🕯 Candle Structure Breakdown:
Real Body: 101.55 pts (Red candle, bearish)
Upper Wick: 106.75 pts (Long — rejection from highs)
Lower Wick: 34.30 pts (Defended slightly)
🕯 Interpretation:
Tried to rally above 24,880 but faced aggressive selling. Closed well below open, forming a bearish rejection candle resembling a shooting star. Bears clearly took control after the intraday bounce attempt.
🕯 Key Insight:
Selling pressure visible from 24,880–24,900 zone.
Close below 24,700 keeps bearish tone intact.
Next Support: 24,650–24,620.
Bulls' challenge: Reclaim and close above 24,850.
🛡 5 Min Intraday Chart
⚔️ Gladiator Strategy Update
ATR: 197.91
IB Range: 122 → Medium
Market Structure: Imbalanced
Trades Triggered:
09:27 – Long Entry → 🎯 Target Hit (1:1.5 R:R)
12:40 – Short Entry → 🎯 Target Hit (1:2.5 R:R)
🧱 Support & Resistance Levels
Resistance Zones:
📍 24,729
📍 24,780
📍 24,815 ~ 24,830
📍 24,850
📍 24,920
Support Zones:
📍 24,640
📍 24,580
📍 24,520 ~ 24,480
💭 Final Thoughts
🧠 “Every breakout starts with hesitation — but not every hesitation leads to a breakout.”
Today’s structure showed strong indecision, but sellers used it to dominate.
Monday’s triangle breakdown proved that structure plus patience = power. Keep your bias flexible and trust your levels.
✏️ Disclaimer
This is just my personal viewpoint. Always consult your financial advisor before taking any action.
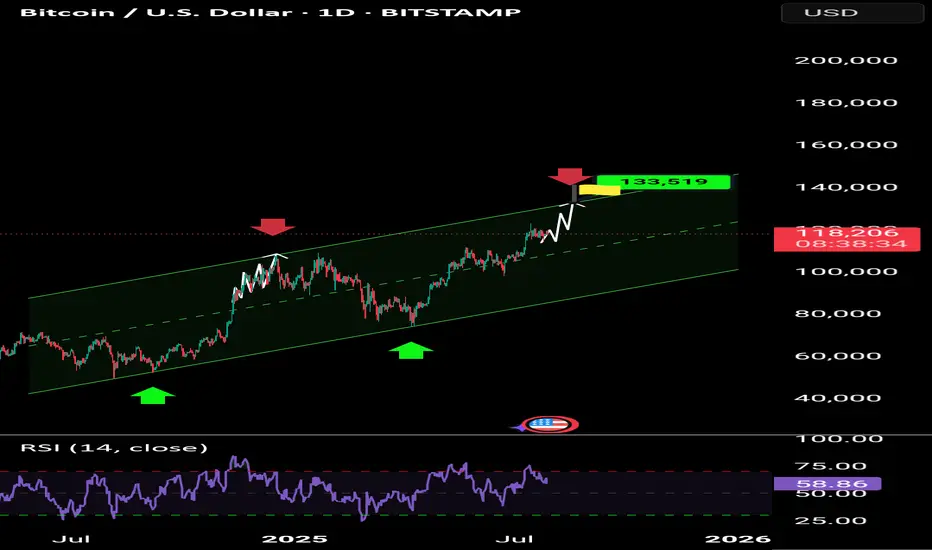
Bitcoin Go 133000Bitcoin prepares to attack the ceiling of the 133,000 range channel after some suffering
Bitcoin tp1:126000
Tp2:128000
Tp3:133000
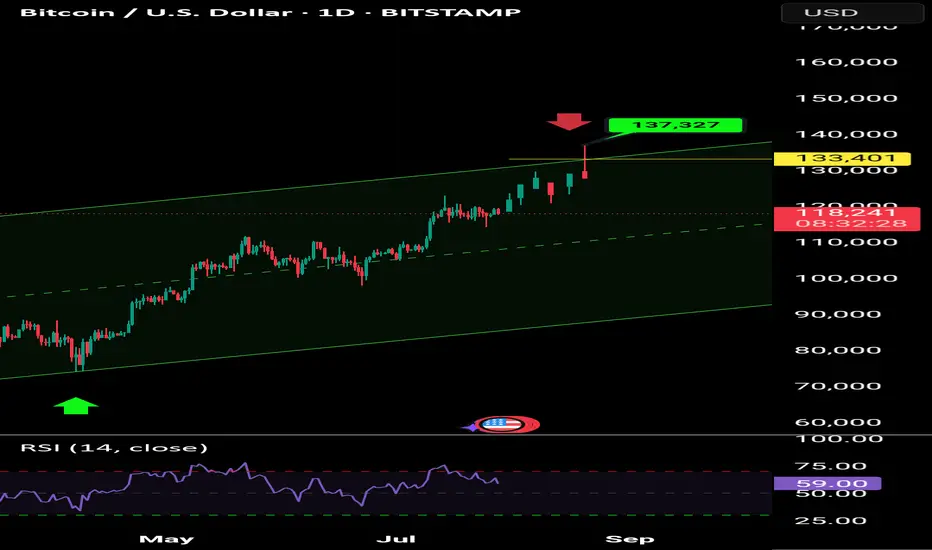
Bitcoin's next target is $133,000Bitcoin prepares to attack the ceiling of the 133,000 range channel after some suffering
Bitcoin tp1:126000
Tp2:128000
Tp3:133000
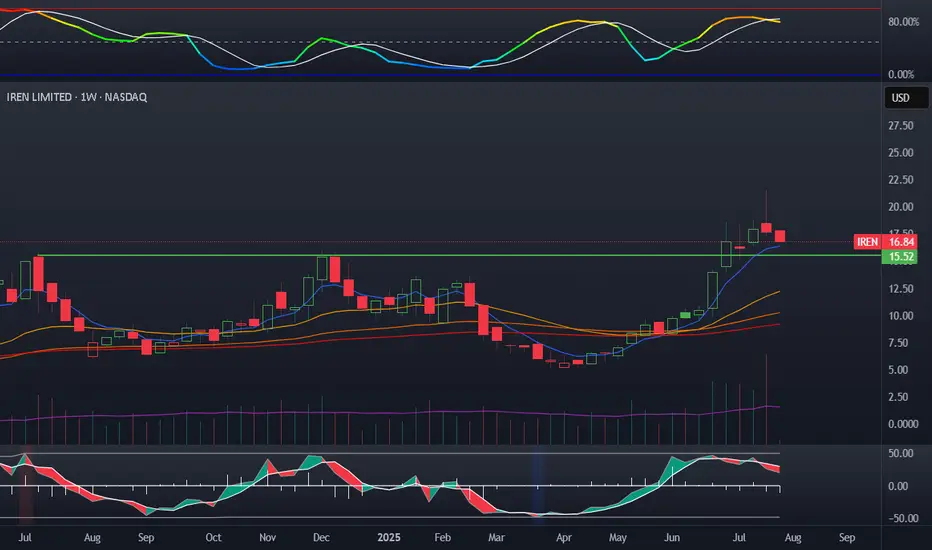
Iren approaches buy zoneIren has been a very hot stock the last few months. I have missed the entry so far, my plan is to enter on around the marked buy zone at the prior tops. This should flip to support at this point. Would love some more oscillators resets, need a few days.
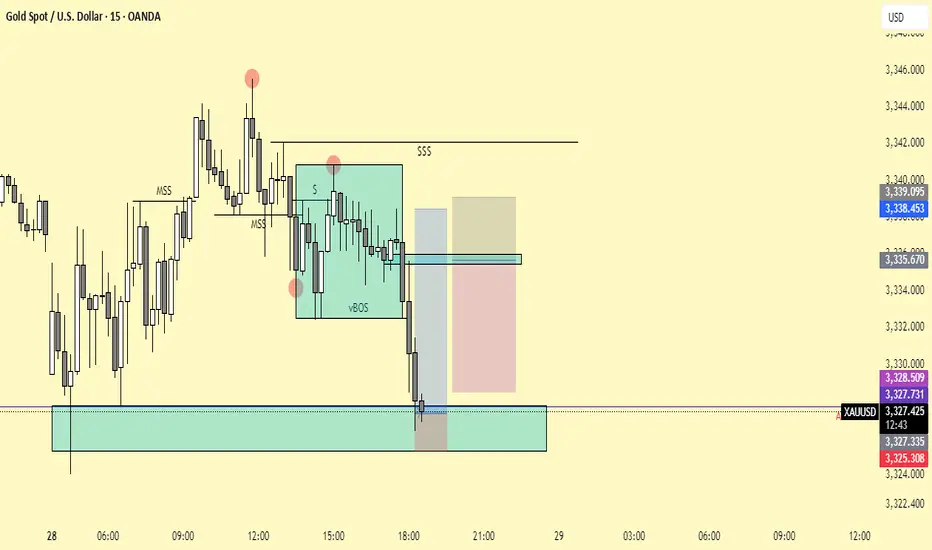
XAUUSD -28/5/25 - Day trade in bearish directionWatching DXY i noticed some string bullish momentum in the dollar.
As a result it looks like gold may have continued weakness today.
I see a pivot formed on the 15in and taking a bearish trade to the hight time frame liquidity equal levels below.
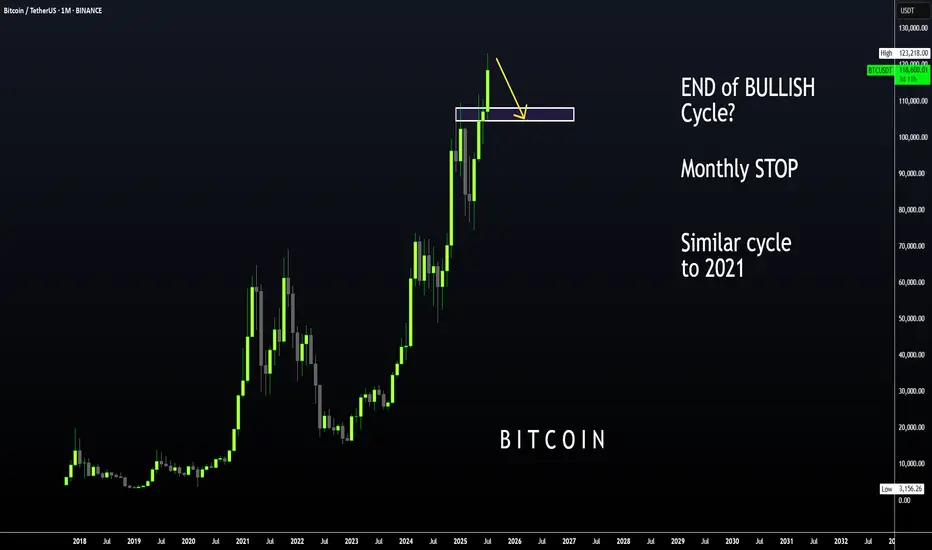
BTC | ALT Season, then BEARISH CYCLE BeginsBitcoin is likely moving in to the beginning of a bearish cycle.
I'm not saying this is immediate, we first need to see altseason - however, if BTC increases it may not go any higher than the last high of $123k. We could easily see the price hover around this zone with a few small increases and decreases for the next few weeks as alts make their respective moves.
I have been talking about the 2021 fractal for a couple of months, where BTC took its time to correct and then made another ATH which was only slightly higher.
We already see a similar pattern playing out in the monthly timeframe if we overlay bars pattern from 2021:
Although Bonce zone 3 may only be in several months, these are the major support zones where BTC could bounce from. Ideal for a swing:
____________________
BINANCE:BTCUSDT
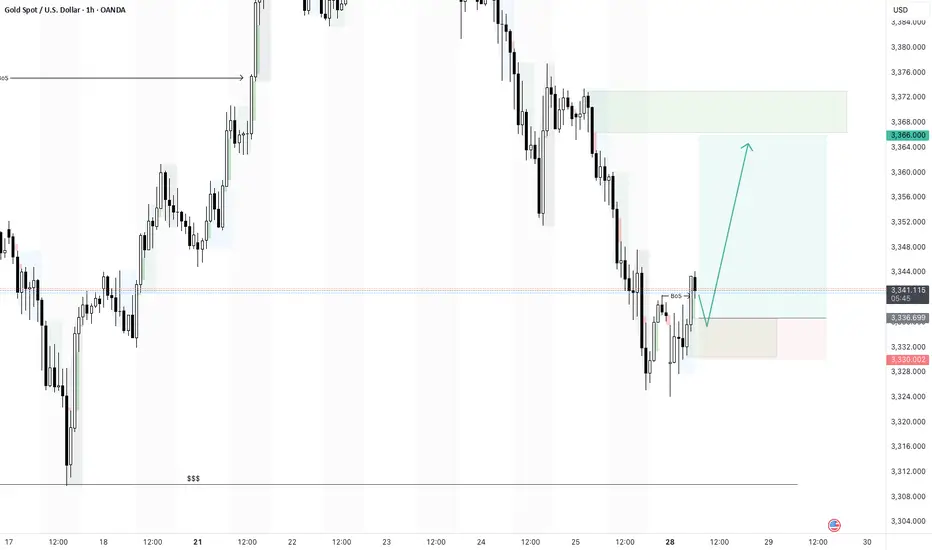
XAUUSD 28/2/25 - Morning bullish pushBased on the 1hr- there is a break of structure and i am looking for a bullish move this morning.
There is a chance that this trade fails as there is a 4hr equal low liquidity below which could draw the price to.
Im still going to take this trade and let price do its thing today.
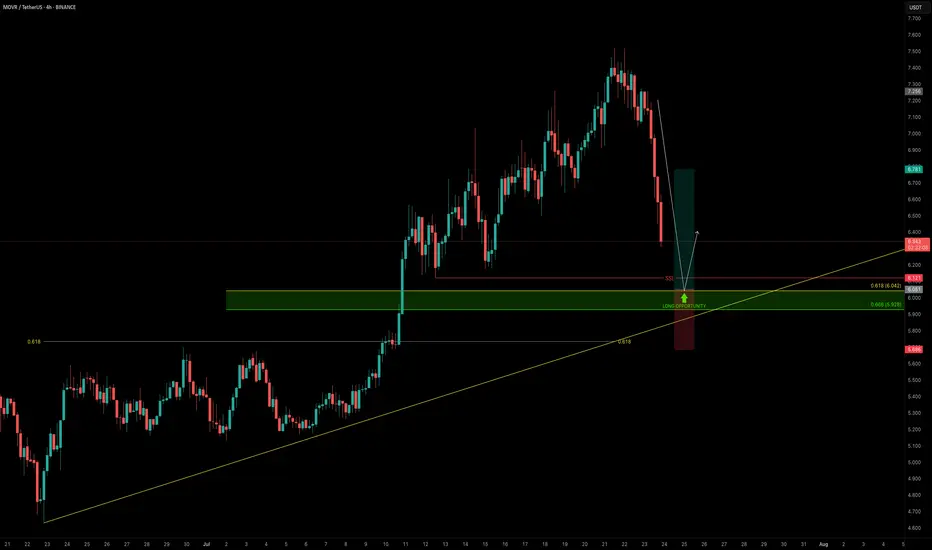
MOVR — Buying the Dip Into Confluence SupportAs the broader market pulls back, it’s the perfect time to scan for high-conviction long setups — and MOVR stands out.
Price is approaching a strong confluence support zone, offering a solid long opportunity.
🧩 Key Technicals
➡️ Liquidity Pool Below the Low:
There’s a visible liquidity pocket just beneath the swing low at $6.121 — an area where stop hunts and reversals are likely.
➡️ Fib & Speed Fan Confluence:
0.618 Fib retracement from the recent move aligns at $6.042
0.618 Speed Fan level also intersects the zone
Together, they form a technical floor right at the $6 psychological level
🟢 Long Trade Setup
Entry: $6.042
Stop-loss: $5.685 (below structure & liquidity sweep)
Target (TP): $6.78
R:R: ≈ 1:2+
Plan: Wait for price to fill into the zone and monitor for a bullish reaction (e.g., SFP, bullish structure reclaim)
💡 Why It Matters: Confluence Builds Confidence
When multiple tools — fib retracement, speed fan, liquidity pools, and psychological round numbers — all line up, it increases the probability of a strong reaction.
This is how smart money builds positions — not by chasing pumps, but by entering where others panic.
Final Thoughts
MOVR is approaching a clean, high-probability buy zone just below $6.00.
If the level holds and confirms with price action, this setup offers a solid R:R and a clear invalidation point.
📌 Mark the zone, set your alert, and let price come to you.
_________________________________
💬 If you found this helpful, drop a like and comment!
Want breakdowns of other charts? Leave your requests below.
Bitcoin Primed for Growth, Says Advanzia GroupBitcoin has once again ignited bullish expectations among institutional and retail investors alike, following a strong weekly close above key technical resistance levels. Market strategists and on-chain analysts now forecast significant upside potential for the world’s largest digital asset, with several signals pointing to a renewed leg higher in the ongoing crypto market cycle.
According to data from TradingView and Glassnode, Bitcoin closed the week above $117,000, confirming a bullish engulfing pattern on the weekly chart—typically viewed by traders as a strong sign of trend continuation. Momentum indicators such as the Relative Strength Index (RSI) and Moving Average Convergence Divergence (MACD) also suggest that buy-side pressure is building, with limited resistance until the $130,000 zone.
“Bitcoin just posted one of the strongest technical closes of the year,” says Alex Dornfeld, Senior Market Analyst at Advanzia Group, a digital wealth advisory firm. “The macro setup, institutional flows, and price structure all suggest that we may be entering the next wave of strategic accumulation.”
Institutional Capital Re-Emerges
Recent filings with the U.S. Securities and Exchange Commission (SEC) indicate that several hedge funds, family offices, and sovereign wealth vehicles are reactivating exposure to spot Bitcoin ETFs, especially after the June dip created what some viewed as an “institutional buying window.”
The resurgence in capital inflows has been supported by robust derivatives activity. Open interest on CME Bitcoin futures hit a 9-month high this week, reflecting renewed appetite for directional positions among professional traders.
"Liquidity has returned faster than expected," Dornfeld notes. "That alone is an incredibly strong signal that this rally is being built on more than retail enthusiasm."
On-Chain Metrics Confirm Accumulation
Blockchain analytics also support the bullish narrative. Glassnode data shows a surge in long-term holder supply, meaning more BTC is being transferred to cold storage wallets and held for longer durations. Historically, this behavior precedes major price increases, as reduced circulating supply squeezes market availability.
Additionally, net exchange outflows have exceeded $1.3 billion in the past two weeks, a clear sign that investors are positioning for medium- to long-term appreciation.
Advanzia Group: Helping Investors Capture the Upside
In this rapidly evolving digital asset landscape, Advanzia Group is helping investors navigate volatility and capitalize on the upside of the Bitcoin cycle. Through a mix of algorithmic risk management, macro trend analysis, and tailored portfolio strategies, the firm supports both institutional clients and high-net-worth individuals seeking measured exposure to digital assets.
“We believe in disciplined positioning,” says Dornfeld. “Our job is not to chase the market, but to help clients capture asymmetric opportunities like the one currently forming in Bitcoin—without taking on unmanaged risk.”
Advanzia’s latest research bulletin, released to private clients on Monday, outlines an expected range of $130,000–$145,000 for Bitcoin by late Q3 2025, assuming stable macro conditions and continued ETF inflows.
Outlook: The Momentum is Real
While risks remain—including macroeconomic shifts, regulatory unpredictability, and potential sell-offs—many analysts agree that the recent weekly close provides a strong technical foundation for further upside.
Whether Bitcoin reaches new all-time highs in the next few months or experiences interim corrections, the direction of travel appears increasingly tilted to the upside.
And for investors seeking to participate strategically, partners like Advanzia Group are proving essential—turning volatility into opportunity, and market signals into long-term performance.
Bitcoin, Politics, and Security: This Week in CryptoThis week brought a series of headline-making moves in the crypto space, reflecting the growing maturity and complexity of the digital asset landscape. From massive Bitcoin buys to cybersecurity initiatives and political implications, here's what stood out — and why it matters.
Strategy Buys $740M in Bitcoin
Institutional players continue to accumulate Bitcoin — but the scale and structure of Strategy’s recent purchase caught the attention of analysts. According to filings with the SEC, the firm added 11,000 BTC, bringing total holdings to 186,000 BTC — worth over $11 billion.
What’s notable is that Strategy appears to be financing these purchases using bond issuance, effectively applying low-interest leverage to increase crypto exposure. This marks a shift in how corporations are approaching Bitcoin — as both a reserve asset and a financial instrument.
Trump Media Discloses $2B in Digital Assets
In a surprising disclosure, Trump Media & Technology Group, the parent of Truth Social, revealed it holds $2 billion in digital assets — including USDC, Ethereum, and small allocations to Solana and Chainlink.
The move has sparked debate within both financial and political circles, given Donald Trump’s renewed activity as a U.S. presidential candidate. Such a significant crypto treasury tied to a politically active entity raises concerns about market influence and regulatory scrutiny.
CoinDCX Launches $1M Bug Bounty Program
Indian crypto exchange CoinDCX announced a $1 million bug bounty program, inviting white-hat hackers and security researchers worldwide to find vulnerabilities in its platform. This marks a shift toward proactive cybersecurity in the crypto exchange industry.
The company also plans to launch an open-source vulnerability-sharing platform to facilitate threat intelligence across exchanges — a move that could standardize Web3 security practices.
Bottom Line
This week underscored the increasingly strategic posture of major crypto market players. From treasury management and structured crypto financing to cybersecurity and institutional-grade governance, the digital asset sector is evolving rapidly.
For savvy investors and ecosystem participants, this complexity brings more opportunity than ever before — but also demands sharper focus, real-time analytics, and risk-aware strategies.
If you need these articles tailored for a newsletter, blog, or investor deck — just let me know!

Solana (SOL) Revs Up Again — Fresh Breakout Above $200 in Sight?After months of consolidation, Solana (SOL) is once again showing signs of bullish momentum, trading near $176 and rapidly approaching a potential breakout level of $200. Investors and analysts alike are paying close attention, as on-chain activity and ecosystem development provide a compelling case for a renewed upward trajectory.
With growing demand for high-throughput blockchain infrastructure and new institutional integrations, Solana is positioning itself as more than just an Ethereum alternative—it’s emerging as a core infrastructure layer for high-performance Web3 applications.
Institutional Momentum Gathers Pace
In the last three weeks, several high-profile announcements have bolstered confidence in the Solana ecosystem. Fidelity Digital Assets revealed it is piloting tokenized bond products on Solana’s network, citing its fast settlement time and composability.
Meanwhile, Visa expanded its USDC settlement pilot on Solana across five countries, reinforcing the blockchain’s real-world financial use cases.
“Solana is no longer just retail-driven,” said Karla Nunez, digital asset strategist at ApexBridge. “Institutions are beginning to build directly on it—and that changes the dynamic.”
Ecosystem Growth and Developer Activity
The number of active developers on Solana has surged 38% quarter-over-quarter, according to Electric Capital’s Developer Report. Projects in DeFi, gaming, and NFTs continue to attract users, helped by extremely low transaction costs and sub-second finality.
Notably, the Solana Foundation recently launched a $100 million grant fund for AI-integrated crypto applications, which could catalyze the next wave of user adoption.
Technical Indicators Support Breakout Narrative
SOL has outperformed major altcoins this month, rising 21% in July. The token is now trading above its 50-day and 100-day moving averages, and momentum indicators suggest a potential breakout above the key psychological barrier at $200.
A confirmed break would likely open the door to $240–$260, with minimal historical resistance in that zone.
Macro Factors Provide Tailwind
The broader crypto market is recovering as inflation metrics cool and expectations for central bank easing rise. Solana, with its high beta to market movements, often leads altcoin rallies during bullish pivots.
Furthermore, the recent dip in Ethereum gas prices has had limited impact on Solana’s user base, suggesting its appeal is increasingly based on performance, not cost arbitrage.
Conclusion
While risks remain—from network outages to broader market volatility—Solana’s resurgence appears fundamentally supported. With institutional interest rising, technical signals aligning, and ecosystem momentum building, a clean break above $200 could mark the beginning of a new cycle for SOL.
For investors seeking exposure to high-speed smart contract platforms with real-world traction, Solana may be nearing another defining moment.
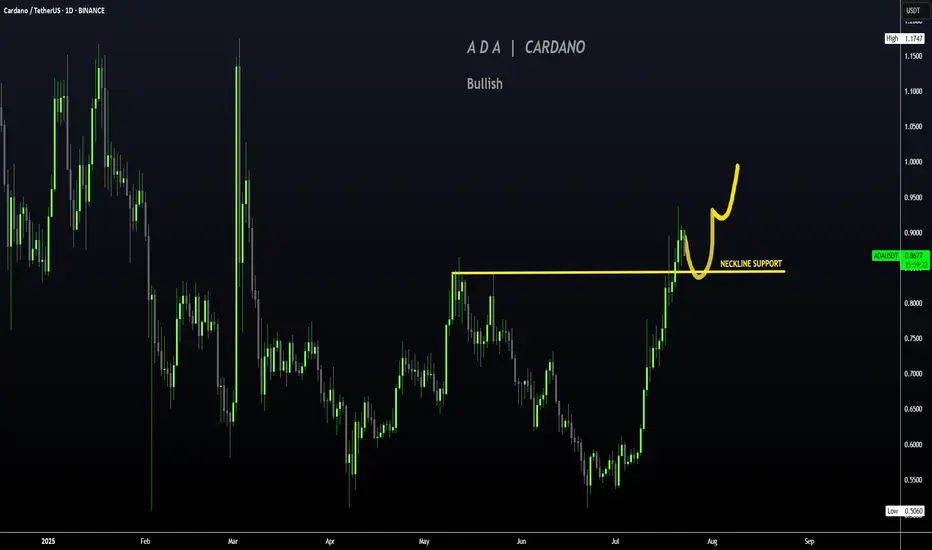
CARDANO | ADA Creeping UP to $1Cardano has made a big move in recent weeks, boasting a 77% increase.
If you were lucky enough to buy in around 30 or 40c, this may be a great TP zone:
Looking at the Technical Indicator (moving averages), we can see the price makes its parabolic increases ABOVE - which is exactly where we are currently beginning to trade. This could mean more upside is likely, and the 1$ zone is a big psychological resistance zone:
A continuation of the current correction may look something like this for the next few weeks:
_____________________
BINANCE:ADAUSDT
Tesla Stock in Bearish Trend - Further Downside ExpectedTesla Stock in Bearish Trend - Further Downside Expected
Tesla's (TSLA) stock price continues to display a clear bearish trend structure, characterized by the formation of consistent lower lows and lower highs on the price chart. This technical pattern suggests sustained selling pressure and indicates the downtrend will likely persist in upcoming trading sessions.
Key Technical Observations:
- Established Downtrend: The consecutive lower highs and lows confirm the bearish price structure remains intact
- Weak Momentum: Each rally attempt has failed to gain traction, meeting selling pressure at progressively lower levels
- Critical Price Levels: The stock has established well-defined resistance and support zones for traders to monitor
Price Projections:
- Downside Target at $272: The bearish momentum could drive TSLA toward the $272 support level, representing a potential 15% decline from current levels
- Key Resistance at $370: Any recovery attempts will likely face strong selling pressure near the $370 level, which now serves as a major resistance barrier
Market Implications:
1. Bearish Continuation Expected: The prevailing trend structure favors further downside unless a significant reversal pattern emerges
2. Breakdown Risk: A decisive move below current support levels could accelerate selling momentum toward $272
3. Short-Term Rally Potential: While the overall trend remains down, temporary rebounds toward $370 may present selling opportunities
Trading Considerations:
- Short Positions: Consider maintaining bearish exposure while price remains below the $370 resistance level
- Stop Loss: A sustained break above $370 would invalidate the immediate bearish outlook
- Profit Targets: $272 serves as the primary downside objective, with potential support levels to watch along the way
Risk Factors to Monitor:
- Market sentiment shifts in the EV sector
- Changes in Tesla's production/delivery outlook
- Broader market conditions affecting tech/growth stocks
The technical setup suggests Tesla shares remain vulnerable to further declines, with $272 emerging as the next significant downside target. Traders should watch for either confirmation of the bearish continuation or potential reversal signals near key support levels. As always, proper risk management remains essential when trading in trending markets.

GBPUSD 28/7/25- Sweep and bullishI highlighted the equal liquidity zone and places a buy limit order.
This has been triggered and now will see if it holds.
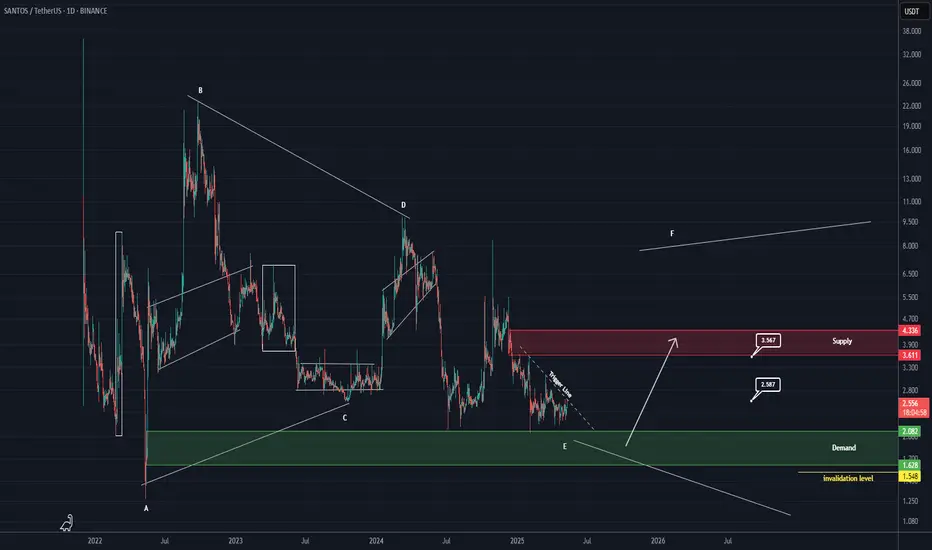
SANTOS ANALYSIS (1D)Football-related tokens in the crypto market have been quiet for a while and seem to be dormant. One of the tokens that shows good inflow during its moves is SANTOS.
SANTOS appears to be forming a symmetrical triangle and is currently at the end of wave E. While there are multiple wave count scenarios for this token, it is sitting on a strong support zone.
As long as it holds the green zone, it has the potential to move toward the targets.
However, a daily candle closing below the invalidation level will invalidate this analysis.
For risk management, please don't forget stop loss and capital management
When we reach the first target, save some profit and then change the stop to entry
Comment if you have any questions
Thank You
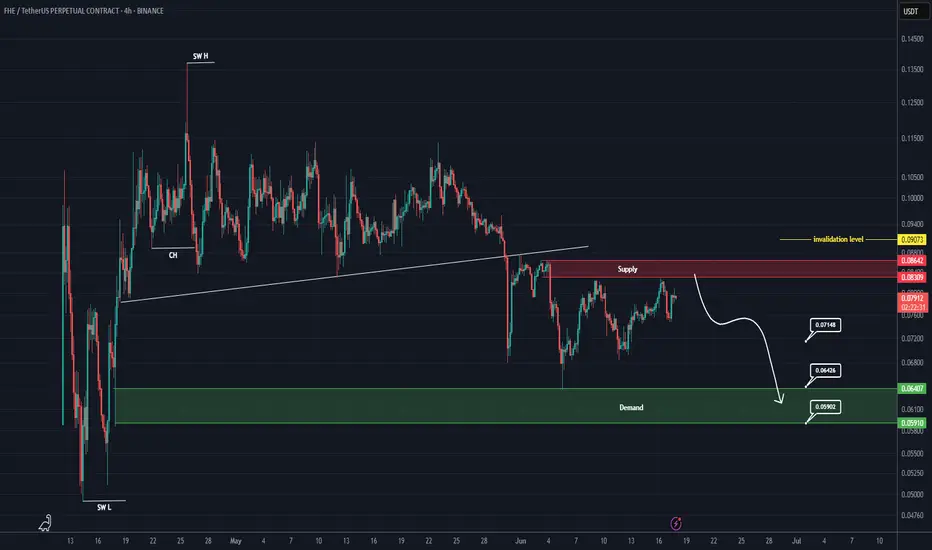
FHE Analysis (4H)A major structure in FHE has turned bearish, and the price is currently pulling back to a fresh and untouched order block. Additionally, the price is trading below supply zones on higher timeframes.
A drop toward the specified targets and the green zone is expected, as long as the red box is maintained.
A daily candle closing above the invalidation level will invalidate this analysis.
For risk management, please don't forget stop loss and capital management
When we reach the first target, save some profit and then change the stop to entry
Comment if you have any questions
Thank You
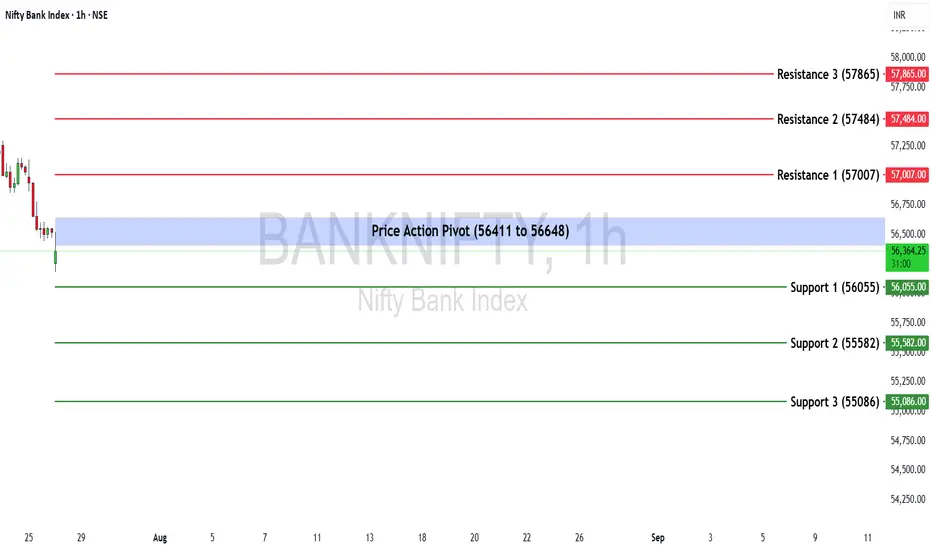
Bank Nifty Weekly Insights: Key Levels & TrendsBank Nifty ended the week at 56,528.90, registering a marginal gain of +0.44%.
🔹 Key Levels for the Upcoming Week
📌 Price Action Pivot Zone:
The critical zone to monitor for potential trend reversals or continuation lies between 56,411 and 56,648.
🔻 Support Levels:
Support 1 (S1): 56,055
Support 2 (S2): 55,582
Support 3 (S3): 55,086
🔺 Resistance Levels:
Resistance 1 (R1): 57,007
Resistance 2 (R2): 57,484
Resistance 3 (R3): 57,865
📈 Market Outlook
✅ Bullish Scenario:
If Bank Nifty sustains above the pivot zone (56,648), it may trigger renewed buying interest, potentially pushing the index toward R1 (57,007) and higher levels like R2 (57,484) and R3 (57,865).
❌ Bearish Scenario:
A breakdown below the lower end of the pivot zone at 56,411 may attract selling pressure, dragging the index towards S1 (56,055) and possibly lower levels like S2 (55,582) and S3 (55,086).
Disclaimer: lnkd.in