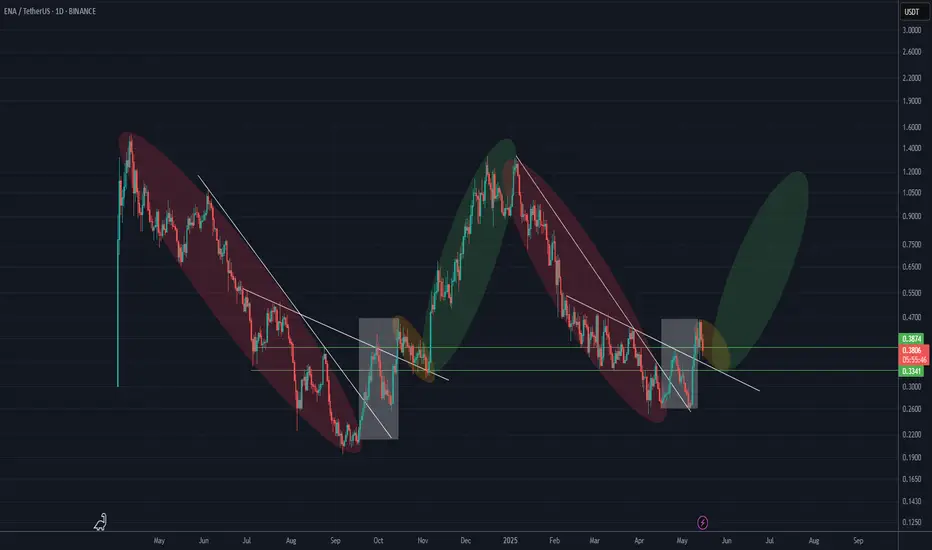
ENA is repeating a bullish fractal (1D)Look at the red, white, yellow, and green boxes in order, and then pay attention to the white trigger lines. You’ll notice that the previous phases | the end of the bearish trend (red box), followed by a bullish move for breakout (white box), then a pullback (yellow box), and finally the main bullish move (green box) | are now repeating.
Also, the price is currently sitting within the trading range marked by the two green lines, which is a key area. After the pullback is completed, a bullish wave is expected to begin, potentially reaching at least around the previous all-time high (ATH).
For risk management, please don't forget stop loss and capital management
Comment if you have any questions
Thank You
Pivot Points
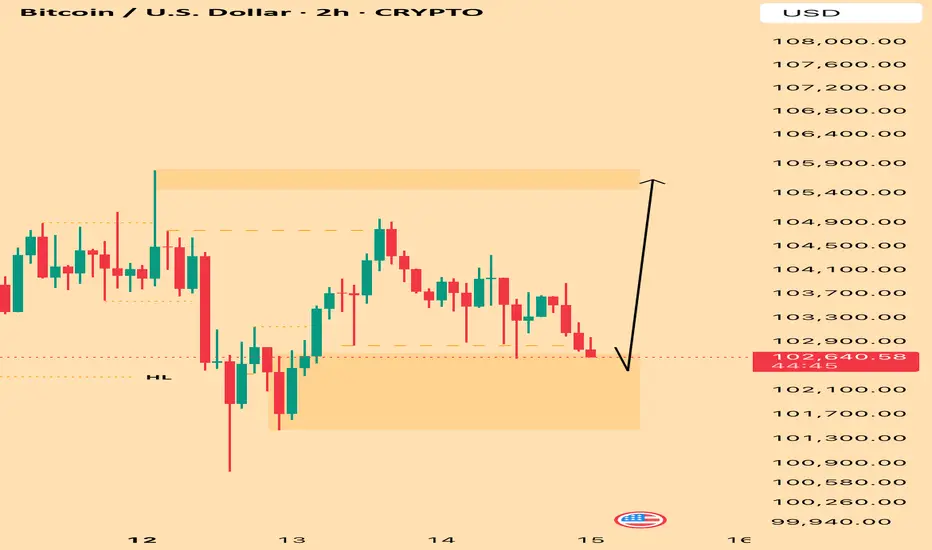
BTC Update - Called It Clean Just like I marked up - price came right into that (demand zone) and gave us the bullish reaction I expected. Zone held strong. No flinch. No cap.
Now that the higher timeframe has done its job, I'm down here on the lower timeframes hunting entries like a sniper. Patience. Precision. Letting the market walk into my trap.
IF you know, you know.
Smart Money always leaves a footprint. I just follow the trail.
#BTC #SmartMoneyConcepts #SMC #ForexTrader #CryptoTrader #PriceAction #Liquidity #Inducement #OrderBlock #RefinedEntries #LuxAlgoConfirmation #TopDownAnalysis
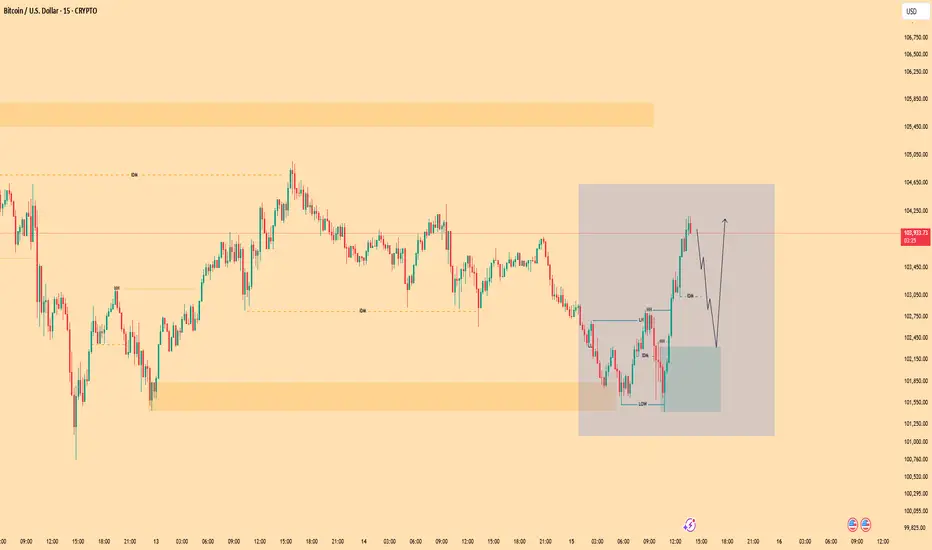
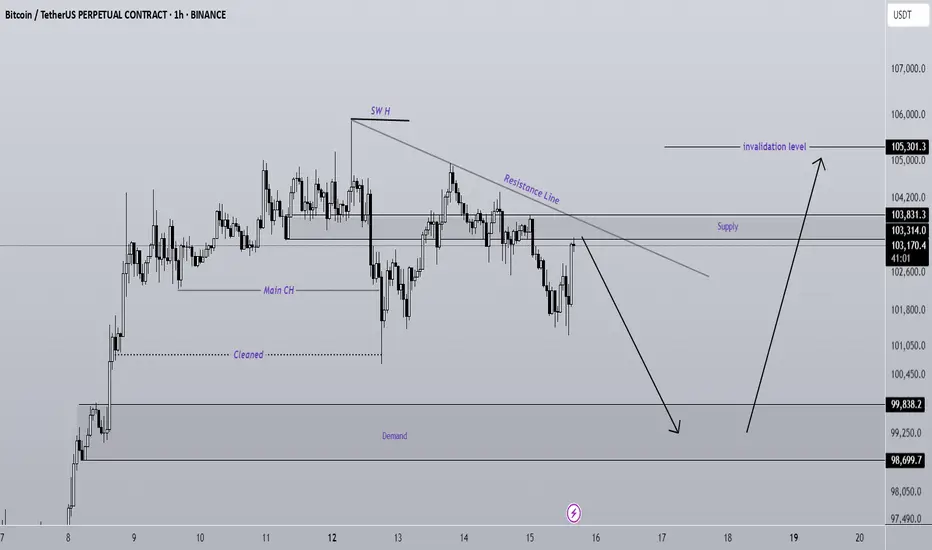
BITCOIN Analysis (1H)We have a CHoCH (Change of Character) in the internal structure, and a bullish order block has been cleared. Price is currently within a supply zone, and there is a resistance line above the current price level.
It appears that price is aiming to pull back to lower support zones. These lower zones are fresh and unmitigated, so we expect that upon reaching them, price may bounce back upward toward the previous high.
A 4-hour candle closing above the invalidation level would invalidate this bias.
Do not enter the position without capital management and stop setting
Comment if you have any questions
thank you
Nifty Analysis EOD - May 15, 2025 - Thursday🟢 Nifty Analysis EOD - May 15, 2025 - Thursday 🔴
Heart-Throbbing Wild Weekly Expiry by Nifty
📈 Nifty Summary
What a day! In yesterday’s report, we highlighted the potential for breakout on both sides—and Nifty said, “Why choose one? Have both!”
Opening with a modest gap-up of 28 points at 24,694, the index wasted no time and took a sharp dive, breaching the Previous Day Low (PDL) and hitting 24,494. This test of the 24,483–24,528 support zone sparked an immediate V-shaped recovery.
By 10:30 AM, Nifty had reclaimed its mean level, and breaching 24,600 triggered short-covering that pushed it sharply toward PDH, which was taken out in just 10 minutes. A rumored update from Trump on a USA–India tariff deal (unverified but possible catalyst) might have played a role—though, as always, price is the final news.
However, within the next 30 minutes, Nifty wiped out all the gains, only to enter a consolidation phase until 1 PM. Then came the real action—another breakout above PDH with strong short-covering and fresh buying. The rally took Nifty to a fresh weekly high of 25,116, closing near the highs at 25,035.
This wasn’t a regular expiry. This was a thriller.
📊 Intraday Walk
📉 Breach of PDL to form 24,494 low
🧲 V-shaped recovery from 24,500 zone
🚀 24,600 breakout triggers short-covering to PDH
⚡ Spike to PDH wiped out → range-bound for 2 hours
🟢 1 PM breakout → new weekly high 25,116
🔚 Closed at 25,035, a solid 341-point day
🕯 Daily Candle Breakdown
Candle Type: Bullish Marubozu-like Engulfing
Range: ~622 points
Key Observation: Engulfed previous two candles and broke 12th May’s high & close
What it Implies: Strong bullish momentum, signs of sustained short-covering
🎯 Gladiator Strategy Update
Strategy Parameters
ATR: 376.94
IB Range: 212.3 → 📏 Medium IB
Market Structure: ⚖️ Balanced
Trade Highlights
✅ 1st Long Trigger: 13:05
🎯 Target Achieved: 1:4 Risk-Reward
💼 Total Trades: 1
📍 Support & Resistance Levels
🟩 Resistance Zones:
25,116 ~ 25,128
25,180 ~ 25,212
25,285
25,399
25,485 ~ 25,511
🟥 Support Zones:
25,000 ~ 24,980
24,882
24,800 ~ 24,768
24,730
24,660
24,590
24,530 ~ 24,480
🧠 Final Thoughts
The Nested Inside Bar setup we spoke of yesterday? It delivered. Clean breakdown of PDL without triggering trade saved us from a trap, while the PDH breakout delivered a 1:4 reward—textbook price action setup. With a strong bullish engulfing on the daily, expect continued strength with dips being bought.
“When the market offers clarity, act. When it offers confusion, observe.” — Stay nimble.
✏️ Disclaimer
This is just my personal viewpoint. Always consult your financial advisor before taking any action.

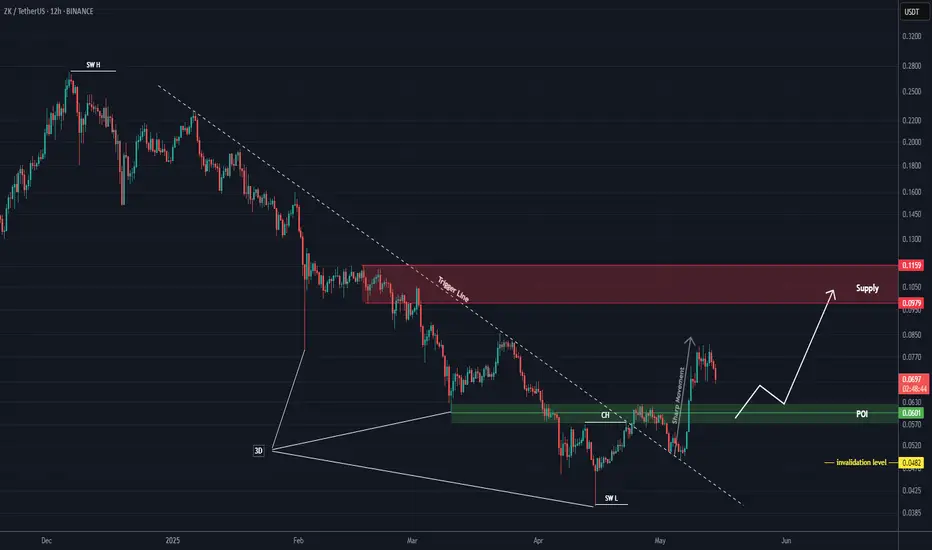
ZK Aanalysis (12H)After forming a 3D bottom, the price moved upward with a strong and rapid bullish wave that was stronger than the previous bullish waves within the bearish move, reclaiming a key zone. Additionally, an important trigger line has been broken, which strengthens the bullish outlook on ZK.
We are looking for buy/long positions within the green zone toward the targets. The targets are marked on the chart.
A daily candle closing below the invalidation level will invalidate this analysis.
For risk management, please don't forget stop loss and capital management
Comment if you have any questions
Thank You
Gold is in the Bearish DirectionHello Traders
In This Chart GOLD HOURLY Forex Forecast By FOREX PLANET
today Gold analysis 👆
🟢This Chart includes_ (GOLD market update)
🟢What is The Next Opportunity on GOLD Market
🟢how to Enter to the Valid Entry With Assurance Profit
This CHART is For Trader's that Want to Improve Their Technical Analysis Skills and Their Trading By Understanding How To Analyze The Market Using Multiple Timeframes and Understanding The Bigger Picture on the Charts
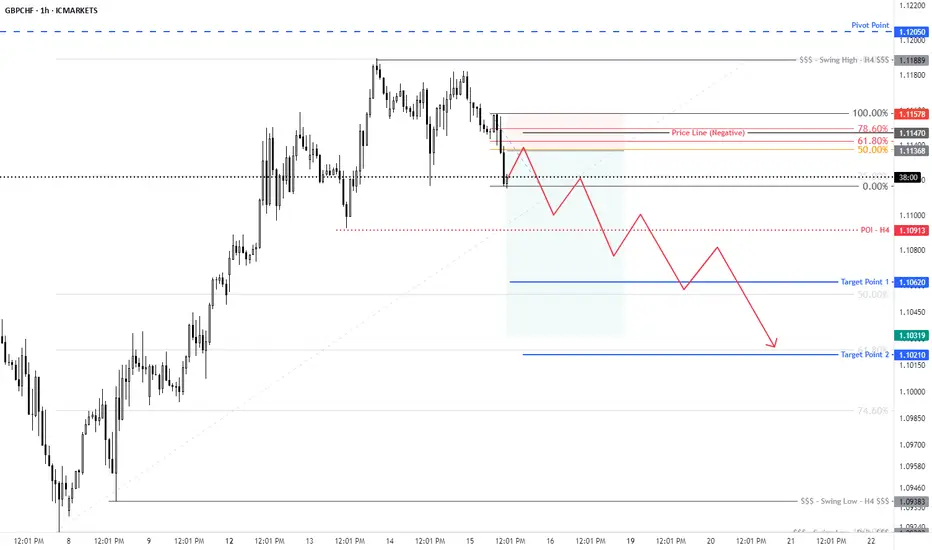
GBP/CHF For Bearish as pull-backyou can go short now
or
wait for entry point and then go short
general trend is up trend
current phase is pull-back
have fun :)
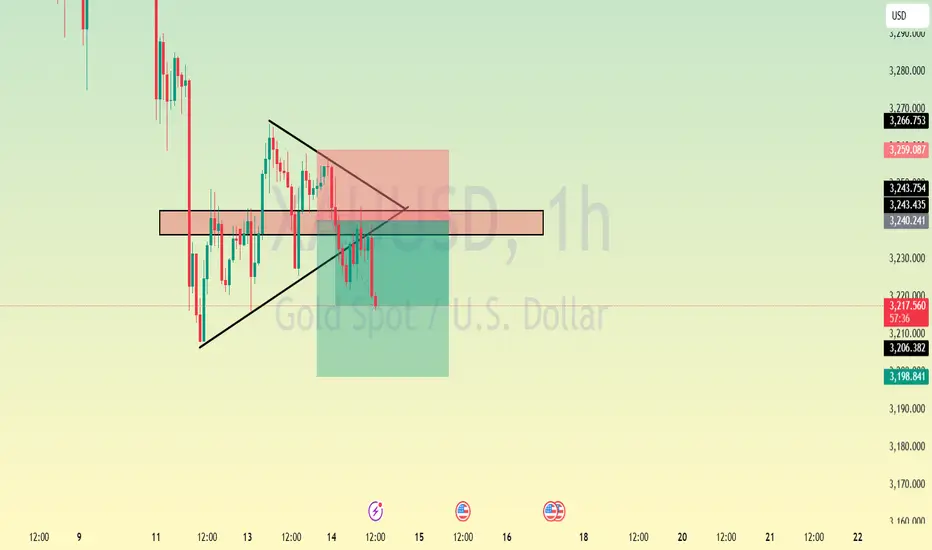
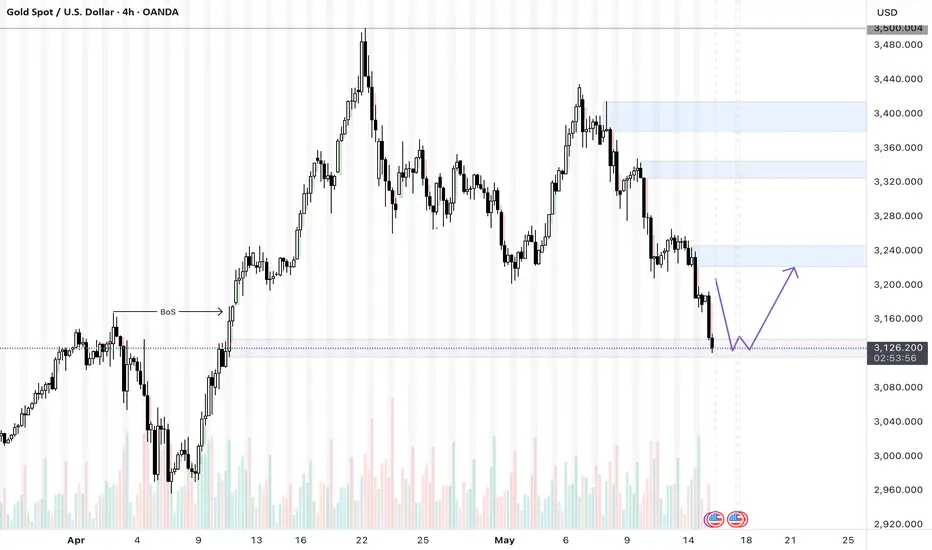
XAUUSD reversal point for this week
Based on 4hour timeframe
- Gold dropped beautifully over the last few days and has reached the demand area that caused the break of structure.
- there is still weakness but for a day trade i would like to see a reversal on the lower timeframe at this point
- the price pushed down during the asian session and not waiting for the reversal on the lower TF that will result in a bullish push during London and hopefully a continuation during US session.
- gold may sweep this zone but i definitely do not want a close after it, if that happens then i will wait for the next extreme zone.
- in terms of target- the first supply zone is my target.
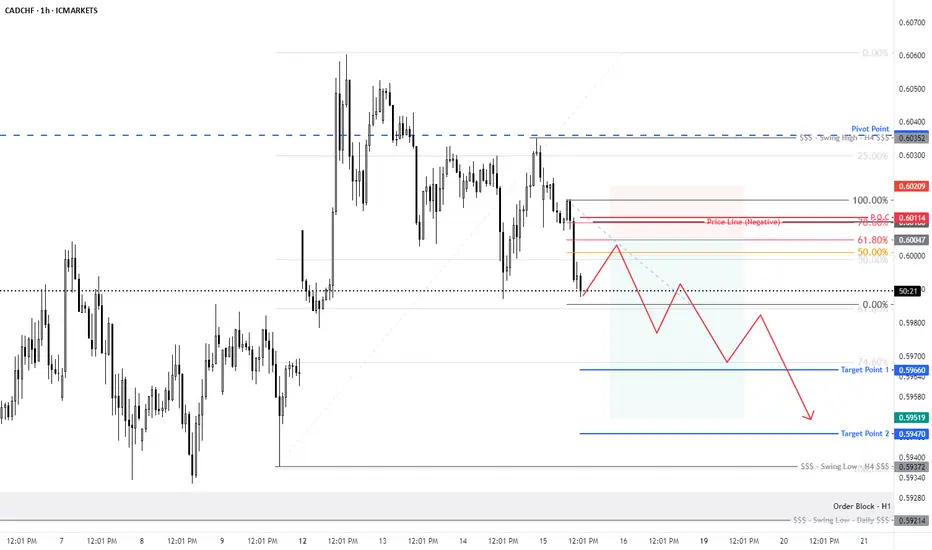
CAD/CHF For Bearish as pull-backyou can go short now
or
wait for entry point and then go short
general trend is up trend
current phase is pull-back
have fun :)
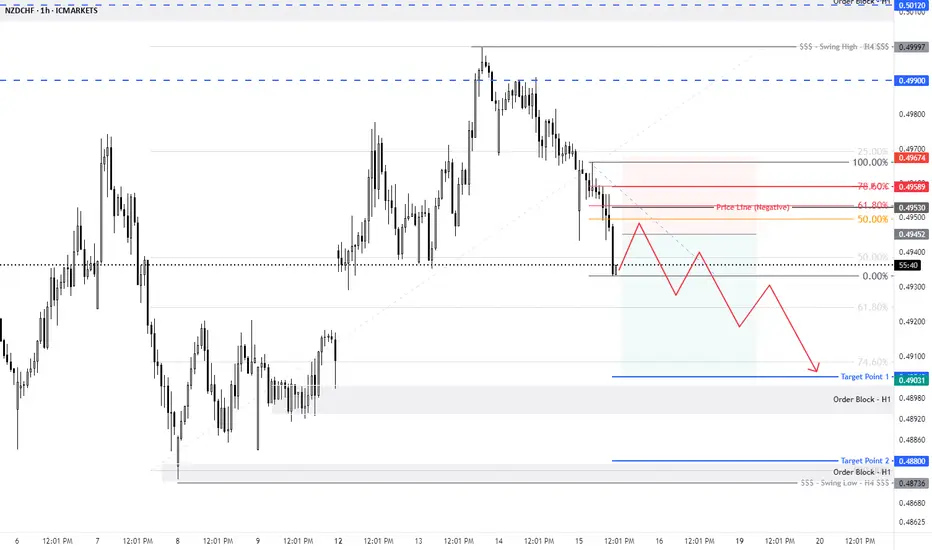
NZD/CHF For Bearish as pull-backyou can go short now
or
wait for entry point and then go short
general trend is up trend
current phase is pull-back
have fun :)
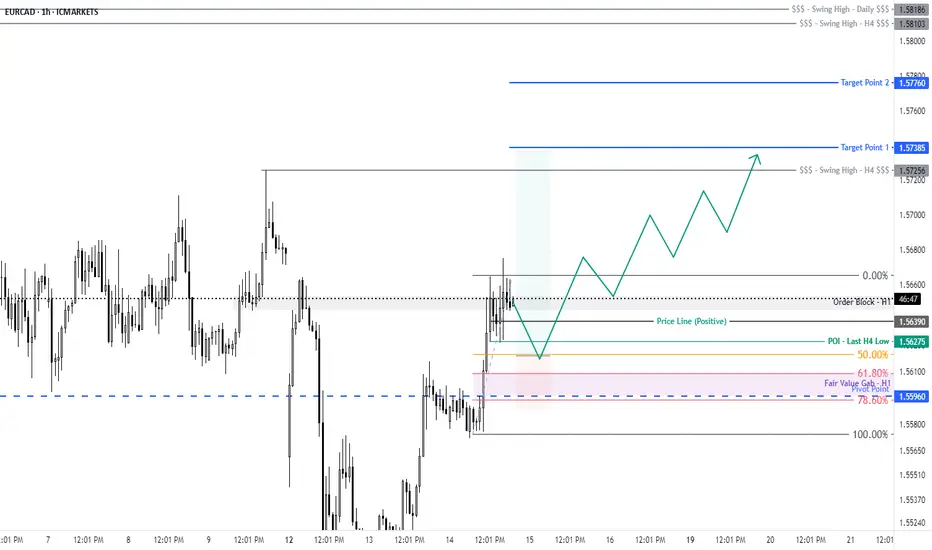
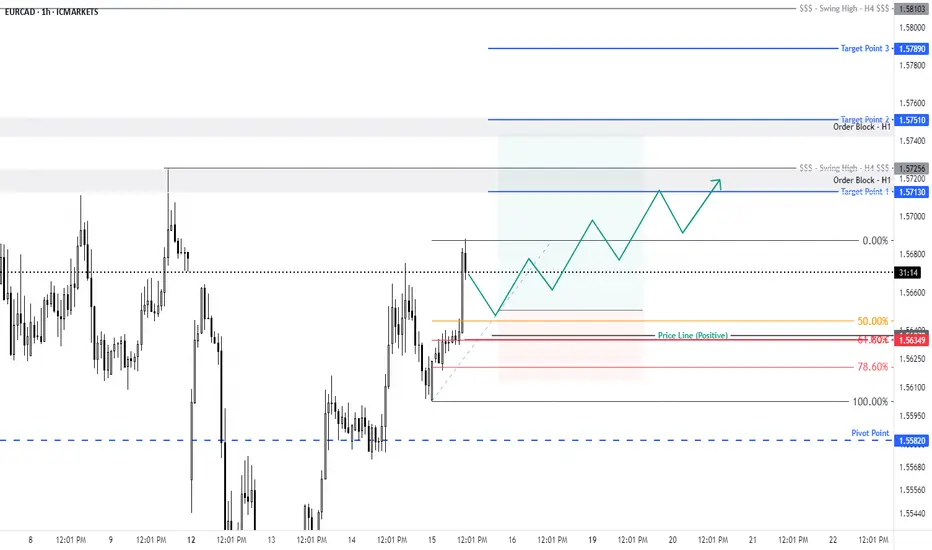
EUR/CAD For Bullishyou can go long now
or
wait for entry point and then go long
general trend is up trend
have fun :)
“BTC: Liquidity Sweep Flipped the Script — Now Watching Bullish BTC moved slick today — I was originally watching for a sell-side mitigation inside the range, but price swept liquidity and reversed quickly without even tapping the OB. No clean mitigation, just a sharp flip. That shift told me bulls are back in control.
Now price is operating with bullish intent. I’m focused on a bullish OB inside the same range — once I get confirmation with a proper OB mitigation following the sweep, I’ll be looking to take longs.
Patience and precision here. Let price do the talking.
Bless Trading!
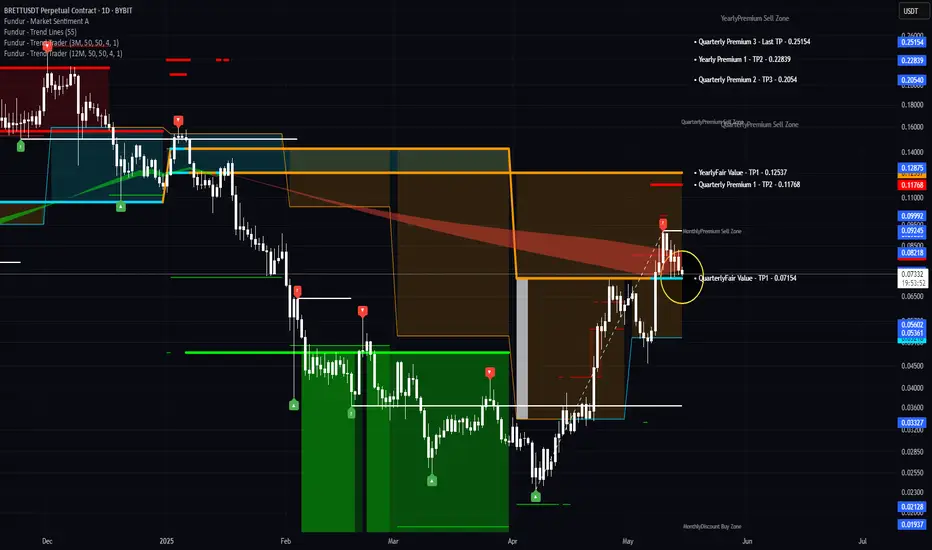
Break and retest? Quarterly Fair Value needs to hold as support if this upwards move is to continue. After which we look to Yearly Fair Value and Quarterly Premium 1. Let's stay positive and bullish.
Momentum Shift: Gold Holds Strong Amid Mounting Dollar PressureHello,
🪙 Gold Market Outlook – May 8, 2025
📈 Current Price Snapshot
Spot Gold (XAU/USD): $3,302/oz
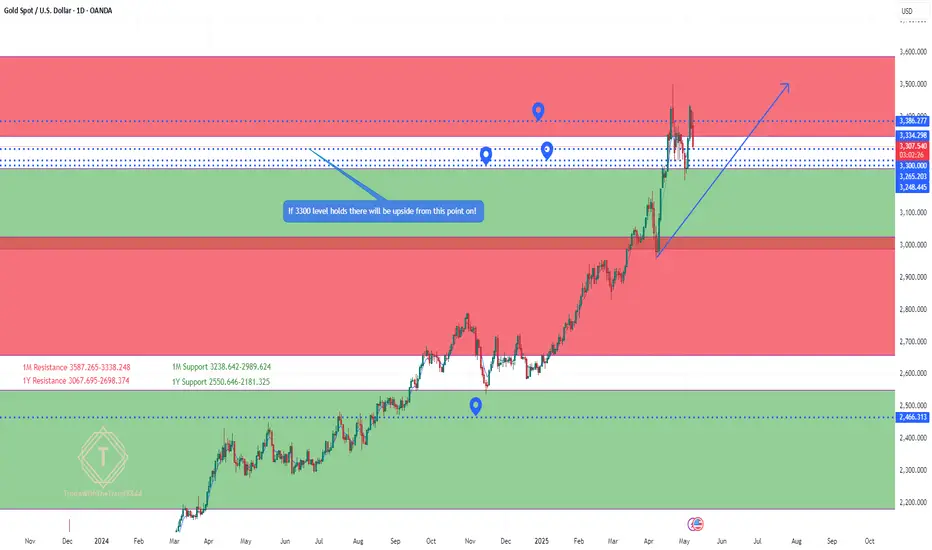
Gold is holding firm above key support levels, signaling sustained bullish momentum. The $3,300 level has now been clearly breached and is acting as short-term support. If this level continues to hold, further upside continuation is expected, with a possible target of $3,500.
🧭 Technical Outlook
4H Major Support: $3,274.637
1D Floor Support: $3,265.328
1W Pivot Point (PP): $3,265.203
1M Pivot Point (PP): $3,248.445
"A test of the weekly/monthly pivot points is possible but uncertain, as current sentiment favors risk-on for gold, while the USD faces risk-off pressure."
A pullback to support is possible, but it’s unlikely under the current macro and technical context.
💬 Macro Fundamentals
Gold prices fell earlier today due to optimism surrounding a potential Trump–UK trade deal and easing geopolitical tensions. However, the market remains cautious as US-China officials are scheduled to meet in Switzerland. Meanwhile, China's central bank approved foreign exchange purchases by commercial banks, further boosting gold imports and supporting physical demand.
"Such measures are likely to keep supporting bullion demand."
— Han Tan, Exinity Group
🌍 Geopolitical Risk Factor
India-Pakistan tensions have escalated, with Pakistan downing 12 Indian drones, which is contributing to increased safe-haven demand in the region.
"Potentially leading to an unquantifiable level of safe-haven demand."
— Ole Hansen, Saxo Bank
Target: $3,500.
The Support and Resistance outlined in green and red are the respective support/resistance for this pair currently for 1M-1Y timeframes!
No Nonsense. Just Really Good Market Insights. Leave a Boost
TradeWithTheTrend3344
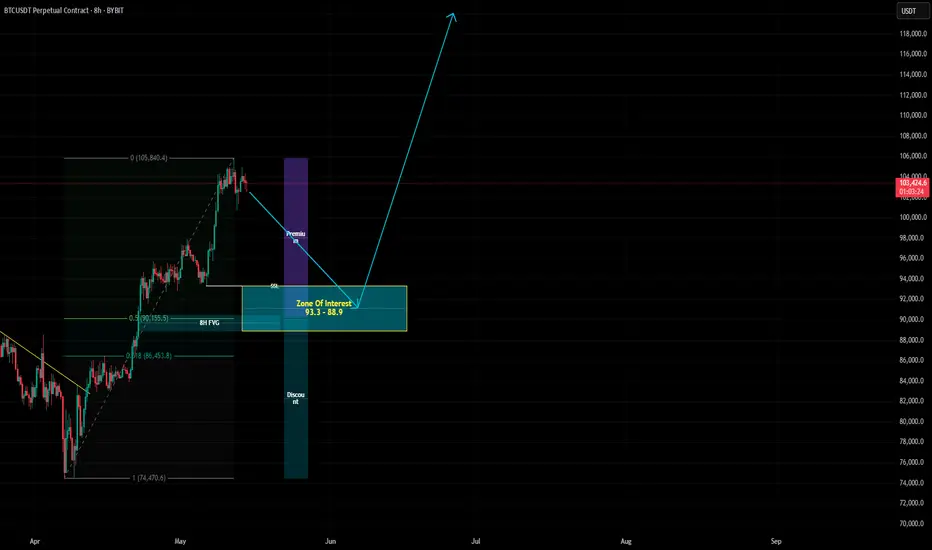
BTC Fibo RetracementIn the meantime, here is my BTC plan. Now we are very close to ATH and I would wait for next retracement to enter long, if we are going to 120.
Zone Of Interest combines several reasons to make an entry.
• 0.5 Fibo
• Sell Side Liquidity
• Valid 8H FVG
• And a border of discount zone
It is not at all necessary that the price will fall to these levels, but if it will, I`ll be watching price action there and make my decision.
Have a good trades!
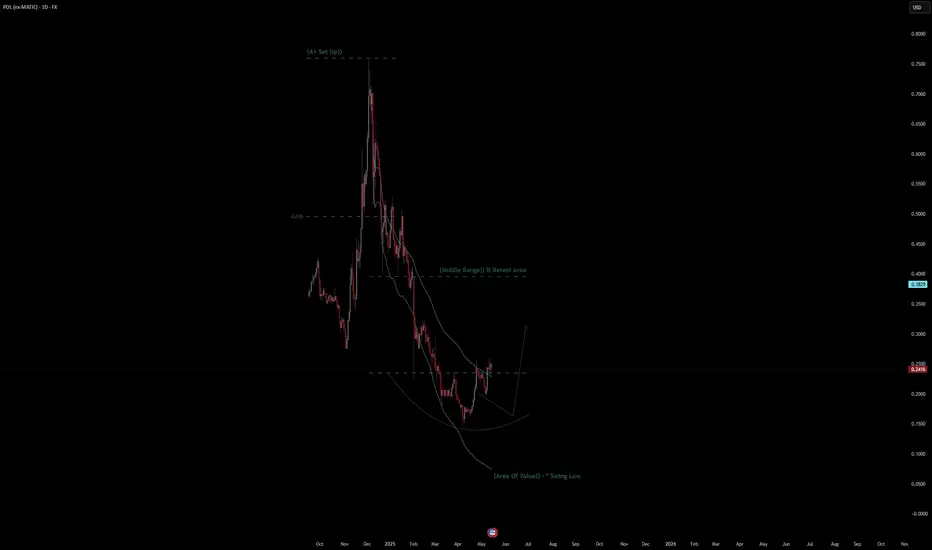
POL (ex-Matic) Stock Quote | Chart & Forecast SummaryKey Indicators On Trade Set Up In General
1. Push Set Up
2. Range Set up
3. Break & Retest Set Up
Notes On Session
#
- Double Formation
* (A+ Set Up)) | Completed Survey
* (Area Of Value)) - * Swing Low | Subdivision 1
- Triple Formation
* (Middle Range)) & Retest Area | Subdivision 2
* (TP1) | Subdivision 3
* Daily Time Frame | Trend Settings Condition
- (Hypothesis On Entry Bias)) | Indexed To 100
- Position On A 1.5RR
* Stop Loss At 50.00 USD
* Entry At 65.00 USD
* Take Profit At 90.00 USD
* (Uptrend Argument)) & No Pattern Confirmation
* Ongoing Entry & (Neutral Area))
Active Sessions On Relevant Range & Elemented Probabilities;
European-Session(Upwards) - East Coast-Session(Downwards) - Asian-Session(Ranging)
Conclusion | Trade Plan Execution & Risk Management On Demand;
Overall Consensus | Buy
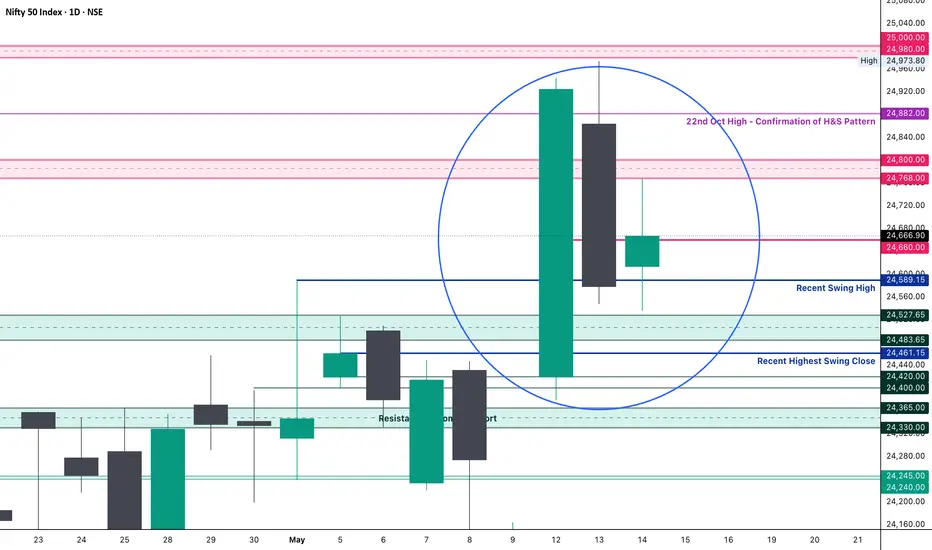
Nifty Analysis EOD - May 14, 2025 - Wednesday🟢 Nifty Analysis EOD - May 14, 2025 - Wednesday 🔴
Day Ends with Directional Uncertainty from Nifty
🔍 Nifty Summary
Nifty opened with a 35-point gap-up, displaying early strength by slowly climbing toward 24,747, which aligned with the critical resistance zone of 24,768–24,800 and the CPR top. But that’s where the rally halted.
From the day’s high, it reversed lower, testing both the Previous Day Low (PDL) and Previous Week High (PWH). Interestingly, the index took support there and managed to close right at the CPR, underlining indecision.
The day was marked by broad consolidation within a 232-point range, with no strong directional follow-through. Price stayed majorly around the CPR zone, signaling a range-bound session with underlying uncertainty.
🕵️ Intraday Walk
☀️ Opened with 35-point gap-up; gradually climbed to 24,747.
🚫 Hit resistance at 24,768–24,800 and reversed.
🔽 Fell to test PDL and PWH zone (24535 area).
🛑 Found support and bounced back to close at CPR.
🔄 A day filled with range-bound movement and no clear trend.
📏 Inside Bar Pattern Watch (Daily Chart)
A 3-day Inside Bar Structure is forming:
📅 May 12: Mother Candle
📅 May 13: Baby candle (ignore 29-point upper wick)
📅 May 14 (Today): Another baby candle within May 13 (ignore 12-point lower wick)
This nested inside bar scenario could trigger a directional breakout soon.
🔼 Upside Levels:
If today’s high (24,767) breaks:Target Zones: 24,800 → 24,882 → 24,940
🔽 Downside Levels:
If today’s low (24,535) breaks:Target Zones: 24,480 → 24,400 → 24,365 → 24,330
🔎 Key Fib Observations
📏 Today’s high (24,747) = ~50% retracement of May 13’s candle → signals rise-on-sell tone
📉 Today’s close (24,640) = ~50% retracement of today’s candle → neutral-to-positive bias
These confluences reflect a tug-of-war between bulls and bears, waiting for a breakout.
🕯 Daily Candle Breakdown
Candle Type: Small-bodied candle inside previous day’s range
Today’s OHLC:▫️ Open: 24,613.80▫️ High: 24,767.55▫️ Low: 24,535.55▫️ Close: 24,666.90 (▲+88.55 / +0.36%)
🔍 Key Observations:
⚠️ No directional expansion, despite higher high & low
✅ Inside bar formation continues
✅ Close at candle midpoint → Neutral, with slight positive bias
📊 Sign of energy build-up for a potential breakout
🛡 Gladiator Strategy Update
Strategy Parameters
ATR: 349.73
IB Range: 169.70 → 📏 Medium IB
Market Structure: ⚖️ Balanced
Trade Highlights
⚠️ No trade triggered
💼 Total Trades: 0
🔢 Support & Resistance Levels
🟩 Resistance Zones:
24,730
24,768 ~ 24,800
24,882
24,980 ~ 25,000
25,100 ~ 25,128
25,180 ~ 25,212
🟥 Support Zones:
24,882
24,800 ~ 24,768
24,730
24,660
24,590
24,530 ~ 24,480
24,461
24,420 ~ 24,400
24,365 ~ 24,330
24,245 ~ 24,240
🔮 What’s Next?
A 3-day Inside Bar Formation generally signals a volatility contraction phase. The tighter the coil, the stronger the potential breakout.
If 24,767 breaks, bulls might regain momentum.If 24,535 fails, we may retest deeper supports from 24,480 downward.
📌 Patience over prediction — let the range resolve.
💬 Final Thoughts
“Inside bars are calm before the storm. Stay alert — breakout decides the next play.”
✏️ DisclaimerThis is just my personal viewpoint. Always consult your financial advisor before taking any action.
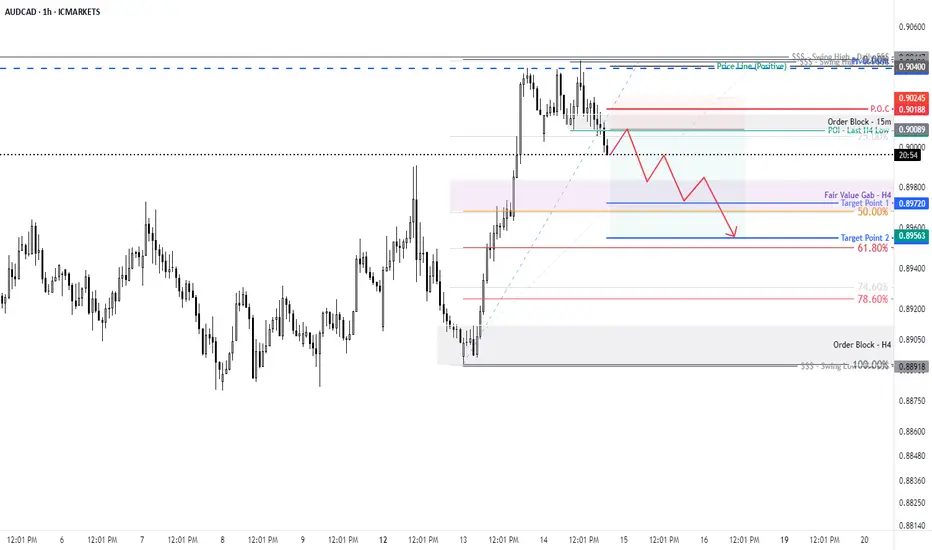
AUD/CAD For Bearish as pull-backyou can go short now
general trend is up trend
current phase is pull-back
have fun :)
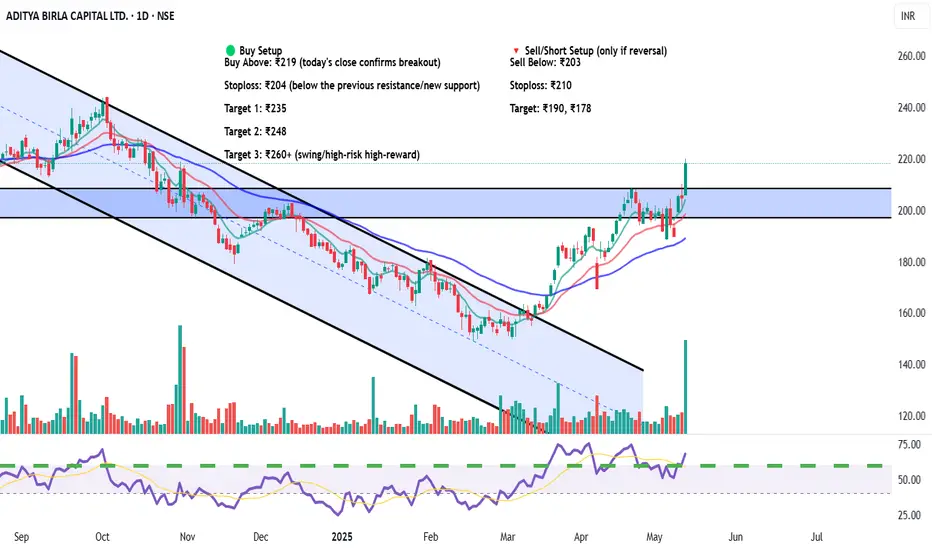
ADITYA BIRLA CAPITAL LTD – Trend Reversal Breakout Trade🧠 Technical Highlights:
Downtrend Channel Breakout: Clear breakout from a falling channel pattern
Resistance Break: Strong breakout above supply zone of ₹204–₹210
Volume: Massive volume spike validates bullish strength
RSI: Above 70, indicating strong momentum but not overbought yet
🟢 Buy Setup
Buy Above: ₹219 (today's close confirms breakout)
Stoploss: ₹204 (below the previous resistance/new support)
Target 1: ₹235
Target 2: ₹248
Target 3: ₹260+ (swing/high-risk high-reward)
🔻 Sell/Short Setup (only if reversal)
Sell Below: ₹203
Stoploss: ₹210
Target: ₹190, ₹178
📅 Timeframe: Short-to-Medium Term (2–6 weeks)
📊 Risk-Reward: ~1:2.5
For Education Purposes Only
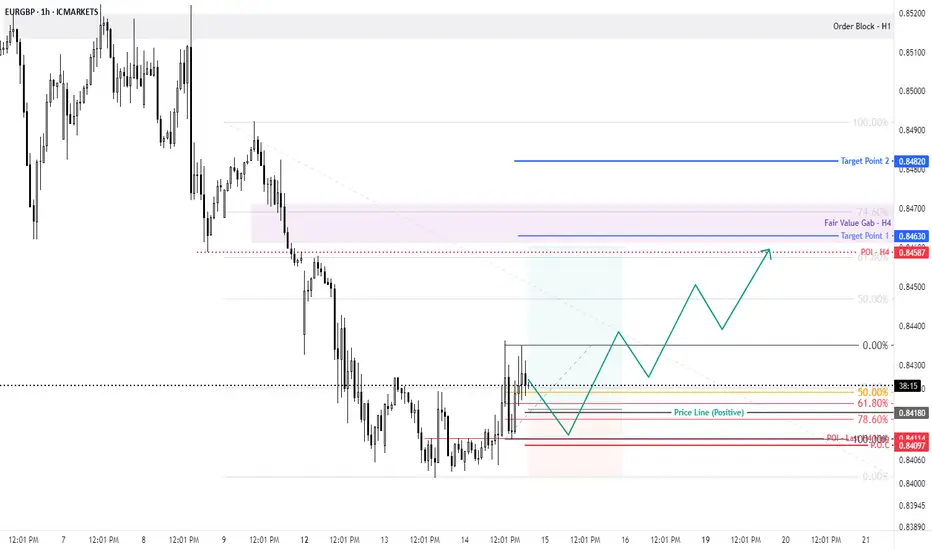
EUR/GBP For Bullish as pull-backyou can go long now
or
wait for pull-back near by entry point and then go long
general trend is down trend
current phase is pull-back
have fun :)
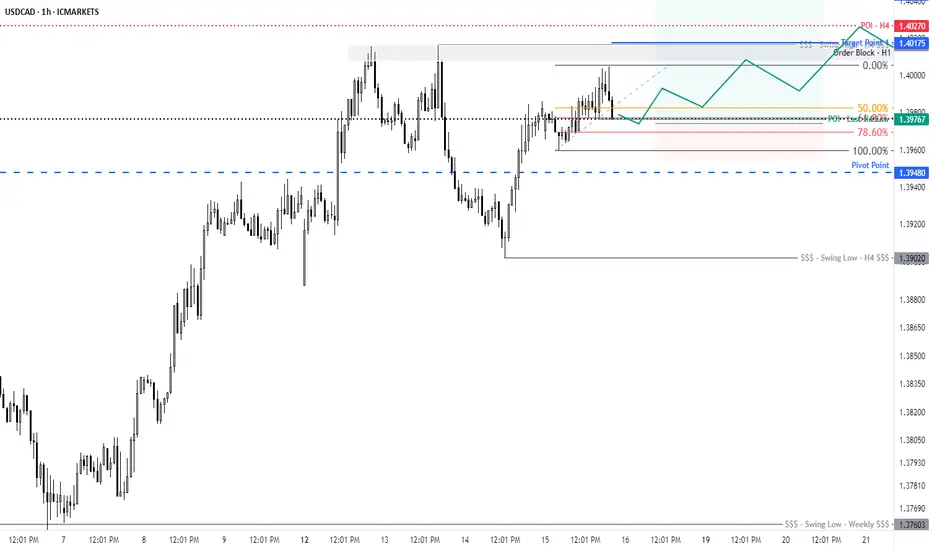
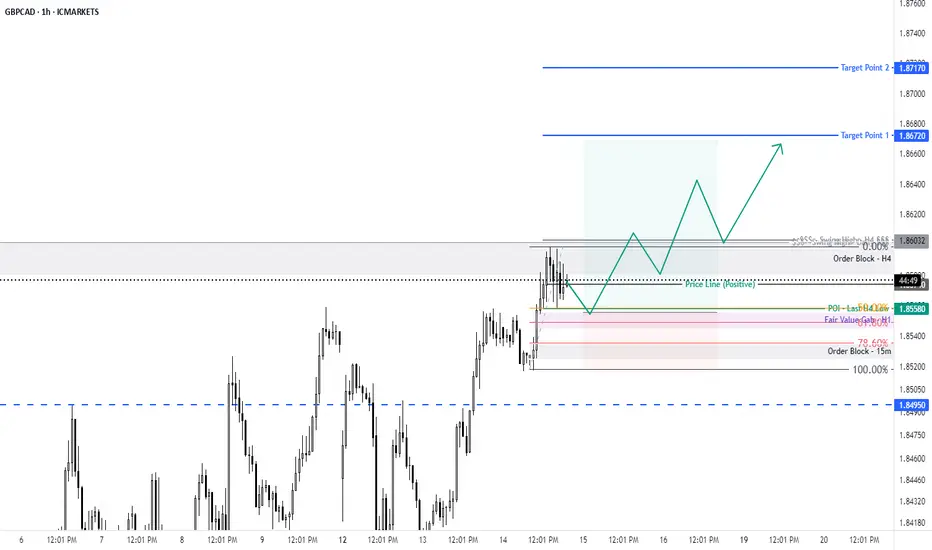
GBP/CAD For Bullishyou can go long now
or
wait for pull-back near entry point and then go long
have fun :)
EUR/CAD For Bullishyou can go long now
or
wait for pull-back near by entry point and then go long
general trend is up trend
have fun :)